---USUAL
📊 USUAL/USDT Trading Analysis – Bullish Opportunity Ahead? 🚀
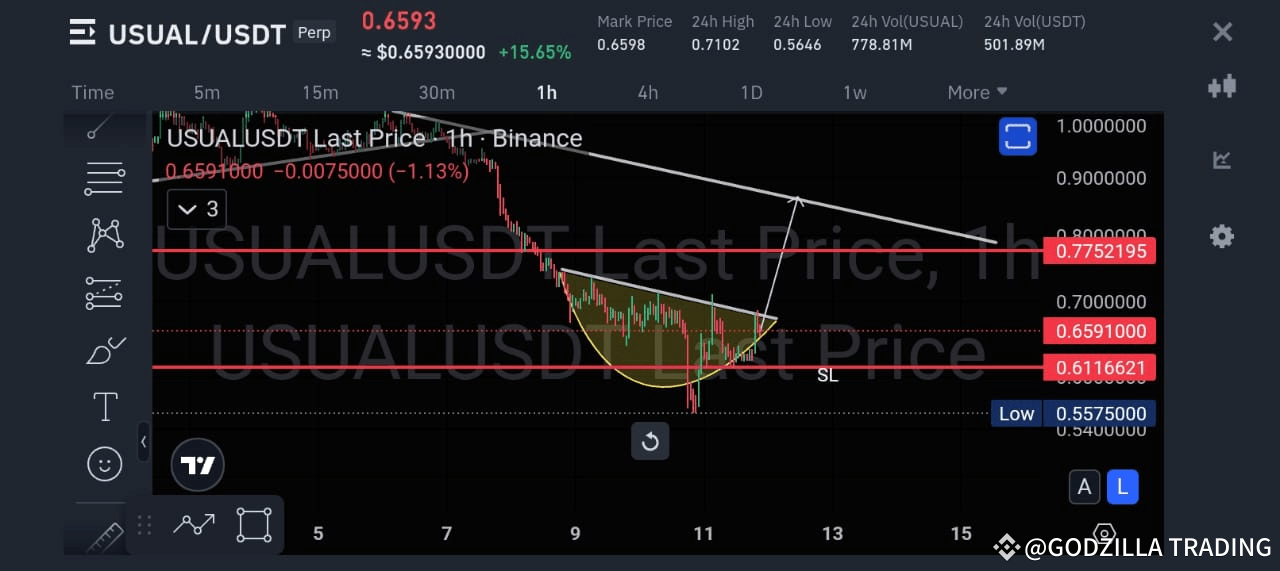
Greetings, traders! Let's dive into the 1-hour chart of USUAL/USDT on Binance and analyze the current market setup. The market is showing an interesting pattern that may indicate potential upside momentum. Here's what the chart reveals:
---
1️⃣ Cup and Handle Formation:
A classic Cup and Handle pattern is visible, which is a bullish continuation signal in technical analysis.
The rounded cup suggests the price found strong support around the $0.5575 level and has started recovering with higher lows.
The handle has formed near $0.6116, and the breakout above this area could lead to a price rally.
---
2️⃣ Key Levels to Watch:
Resistance Zones:
The first resistance is at $0.6591, which aligns with the current price level.
A more significant resistance lies at $0.7752, which could be the next target post-breakout.
Support Levels:
The Stop Loss (SL) is placed below the handle's support at $0.6116, protecting against downside risks.
---
3️⃣ Breakout Potential:
The breakout of the descending trendline and confirmation above the $0.6591 level can fuel a bullish run.
Momentum traders may target $0.7752 or even higher levels if the volume and sentiment support the rally.
---
4️⃣ Volume and RSI Observations:
Volume has started picking up, signaling increasing interest among traders.
If the RSI confirms bullish momentum, it will further strengthen the breakout possibility.
---
⚠️ Risk Management Reminder:
While the setup is bullish, always trade with a proper risk-reward ratio and use stop losses to safeguard your capital. Markets can be unpredictable!
---
💬 What are your thoughts on USUAL/USDT? Are we heading towards a bullish breakout, or will the resistance push us back? Share your analysis and strategy below!
Happy trading, and stay tuned for more updates! 📈