People who play in the secondary market have heard of the diagonal support level, but many do not know how it is formed or what it means.
I use ACX as an example. ACX forms a very obvious diagonal support, as shown in the figure below.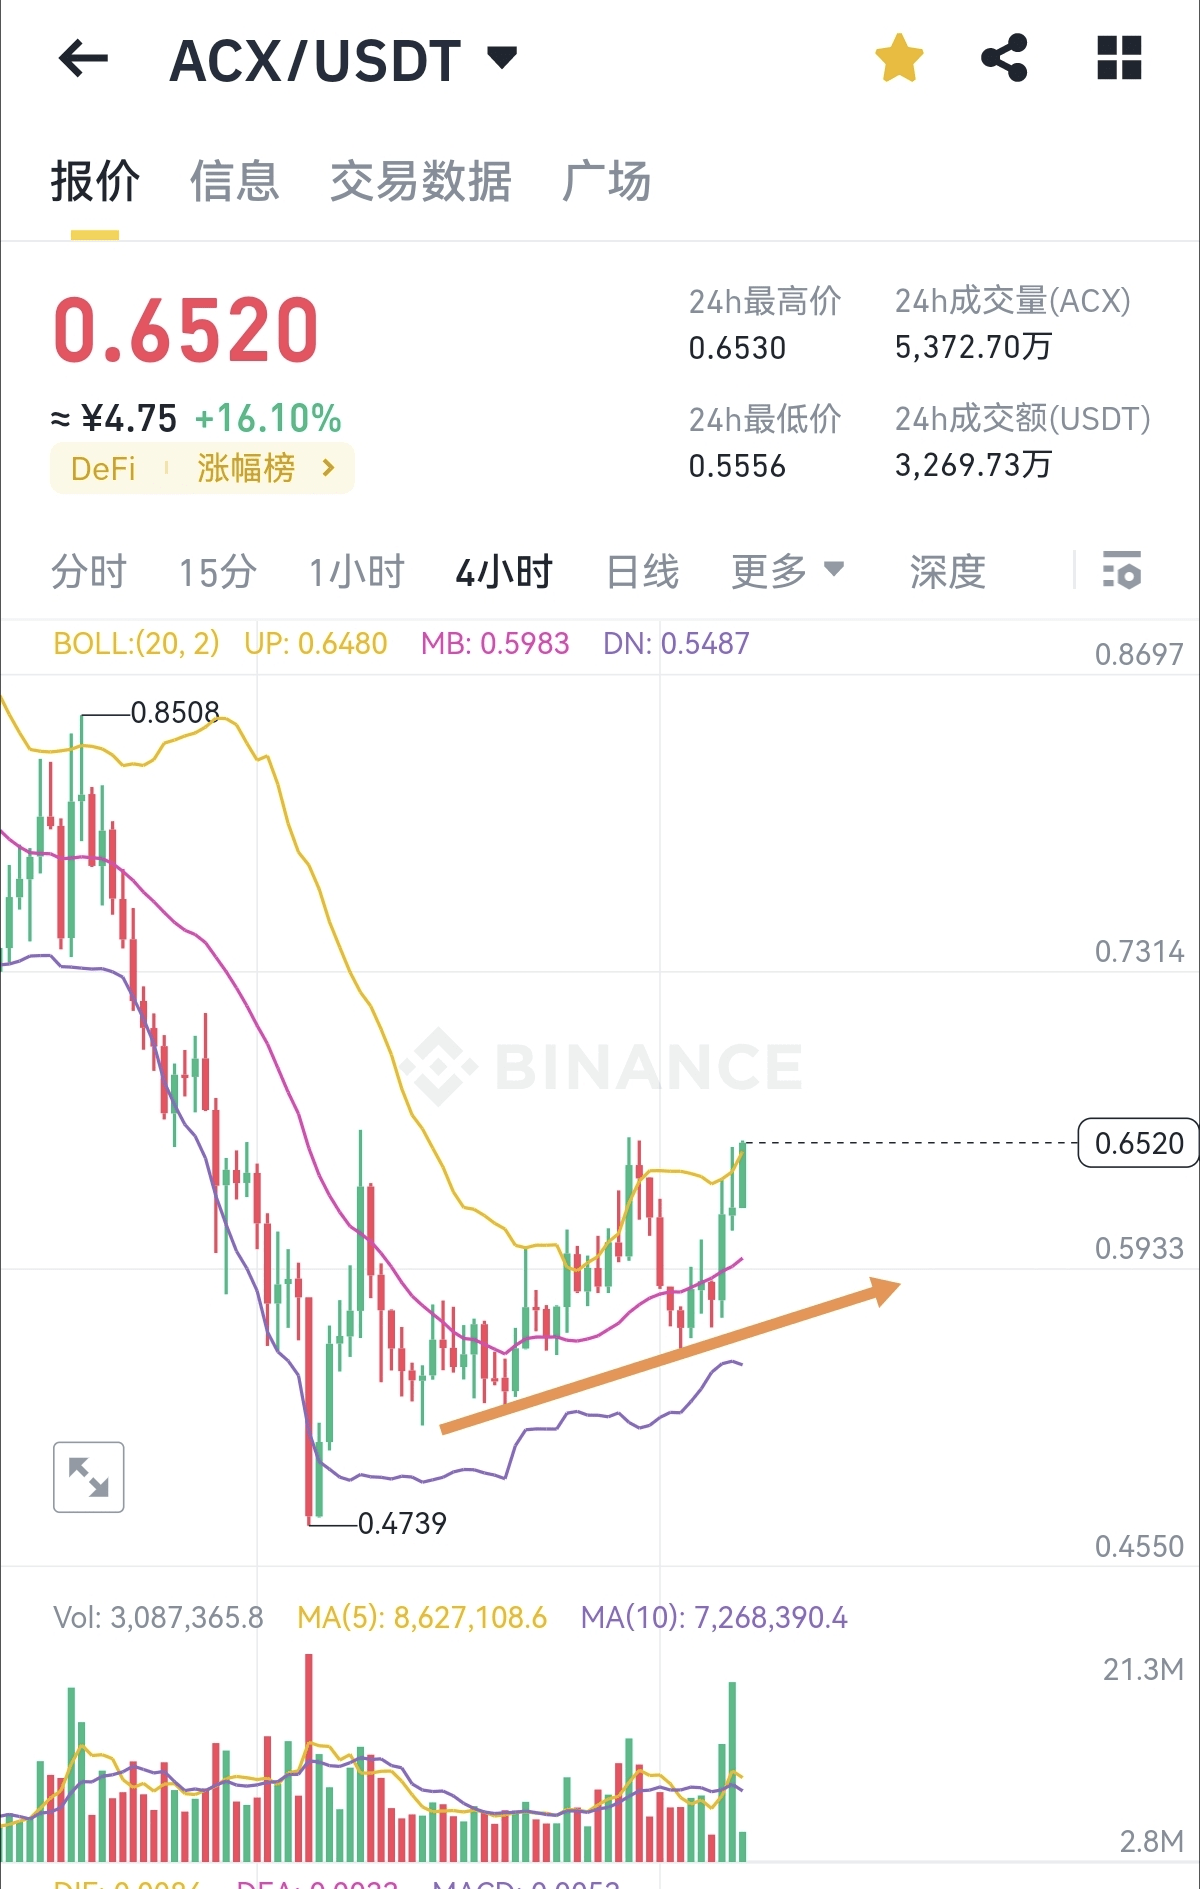
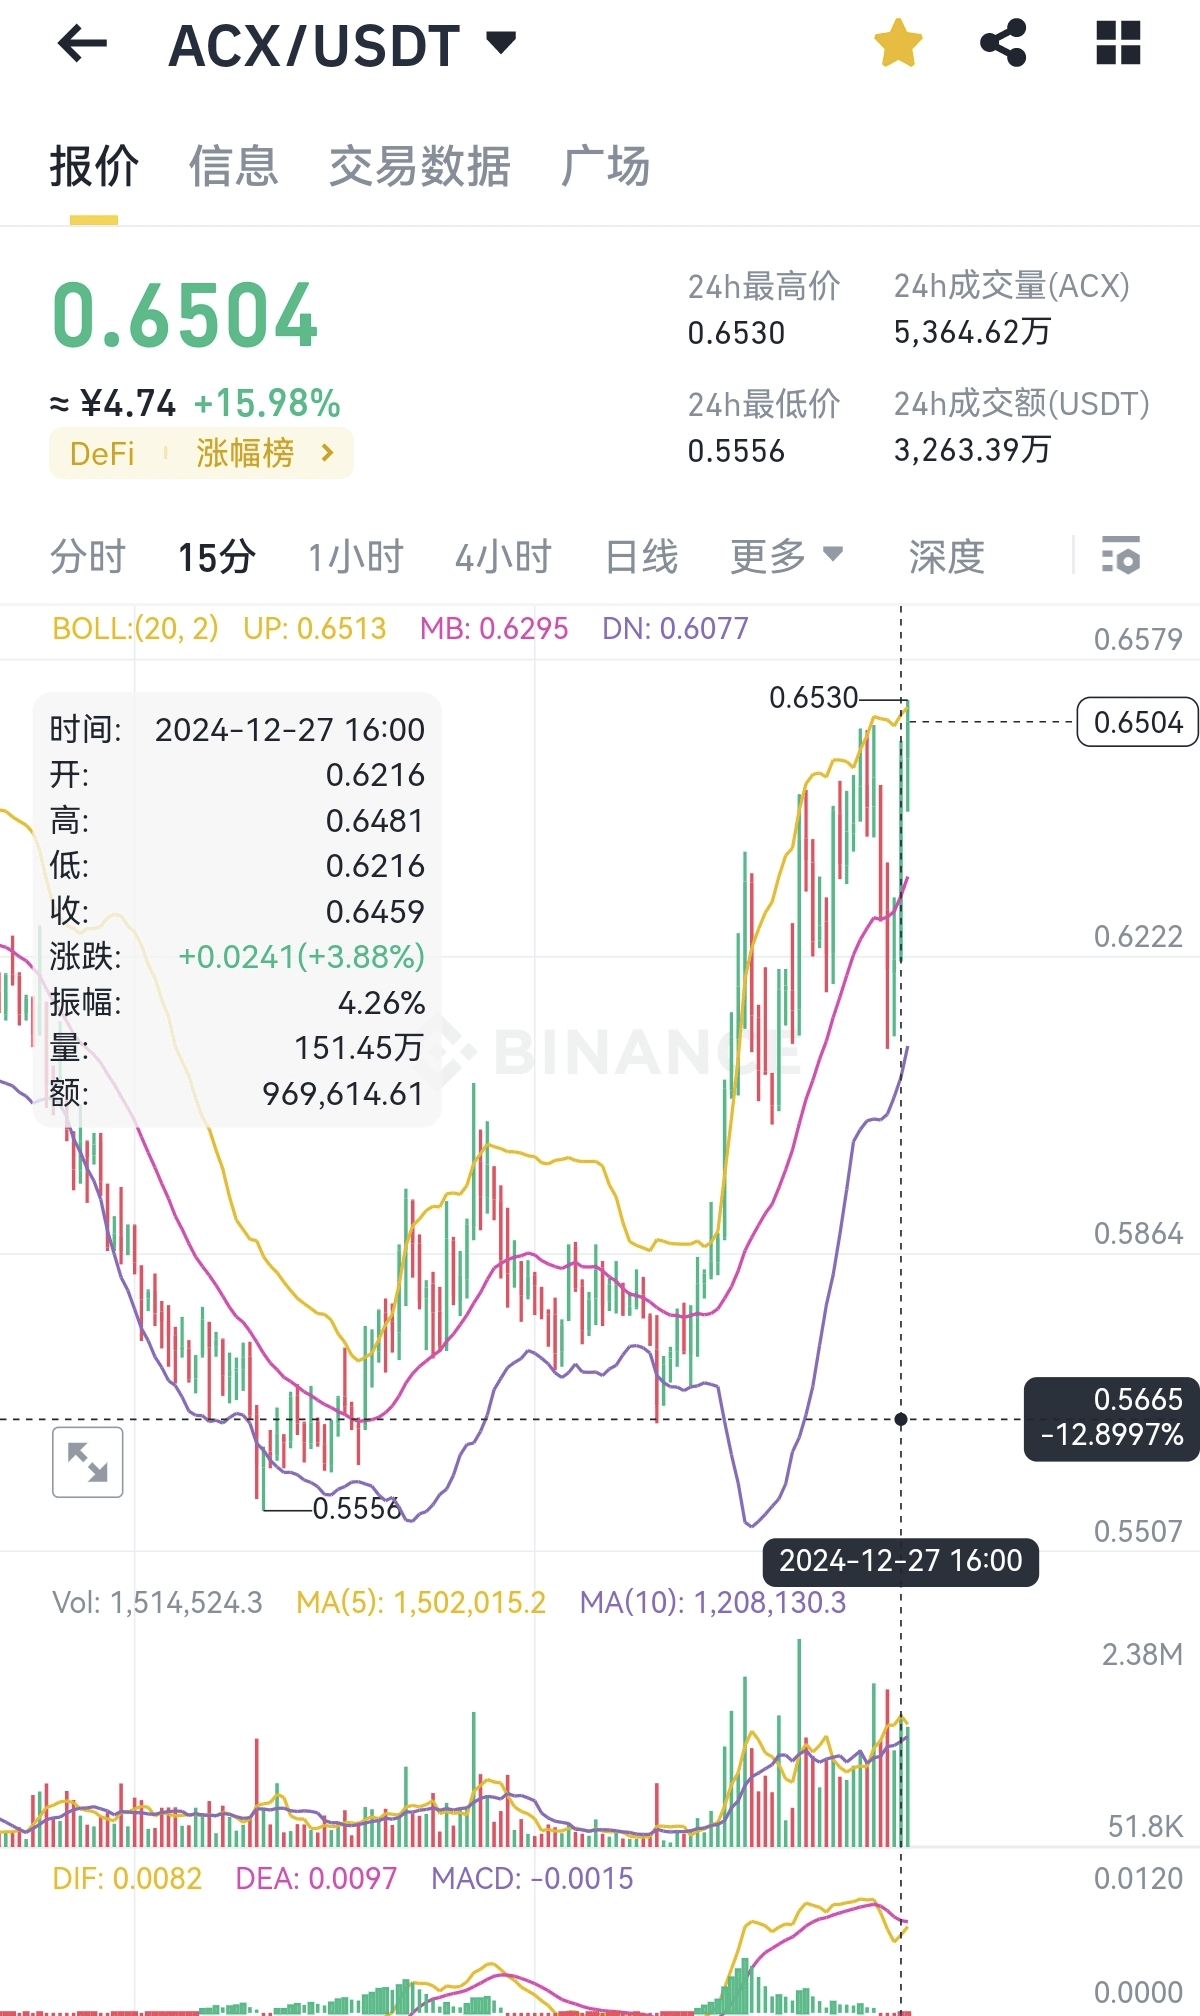
This oblique support is formed by two layers of chip concentration areas. The first layer is supported at 0.556 in the figure below.
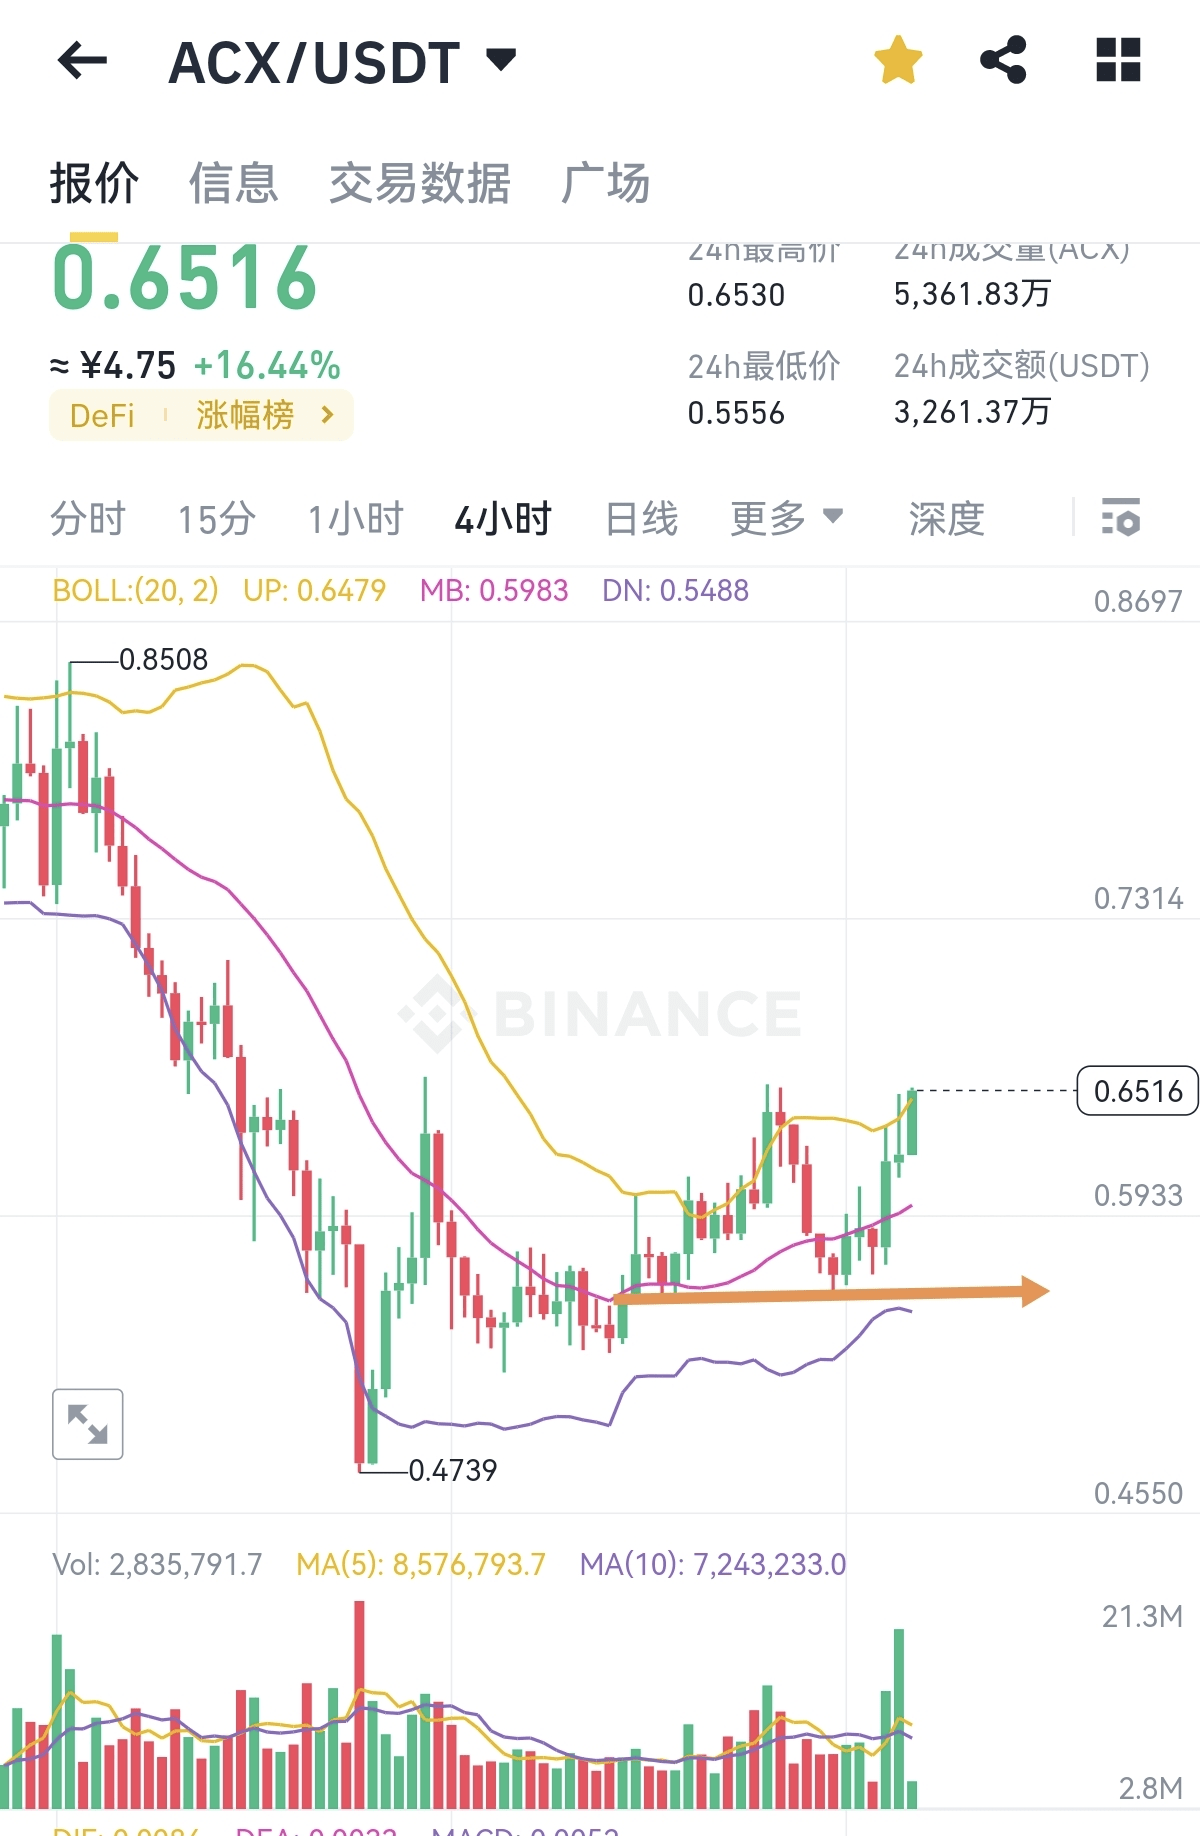
The second layer, as shown below, is supported at 0.566
These two layers of support form a diagonal support level, as shown in the first figure. The decline is unilateral, the main force will suppress, and the buying and selling are dominated by the seller. If the market goes sideways after the decline, with yin and yang interlaced, it means that the turnover rate between buyers and sellers is very high, the volume may not be large, but the buying and selling are very frequent, which is the so-called chip concentration area.
In my previous article, I said that it would usually pull back to around 1.1, because 1.1 is also an area where chips are concentrated, and there will be support here.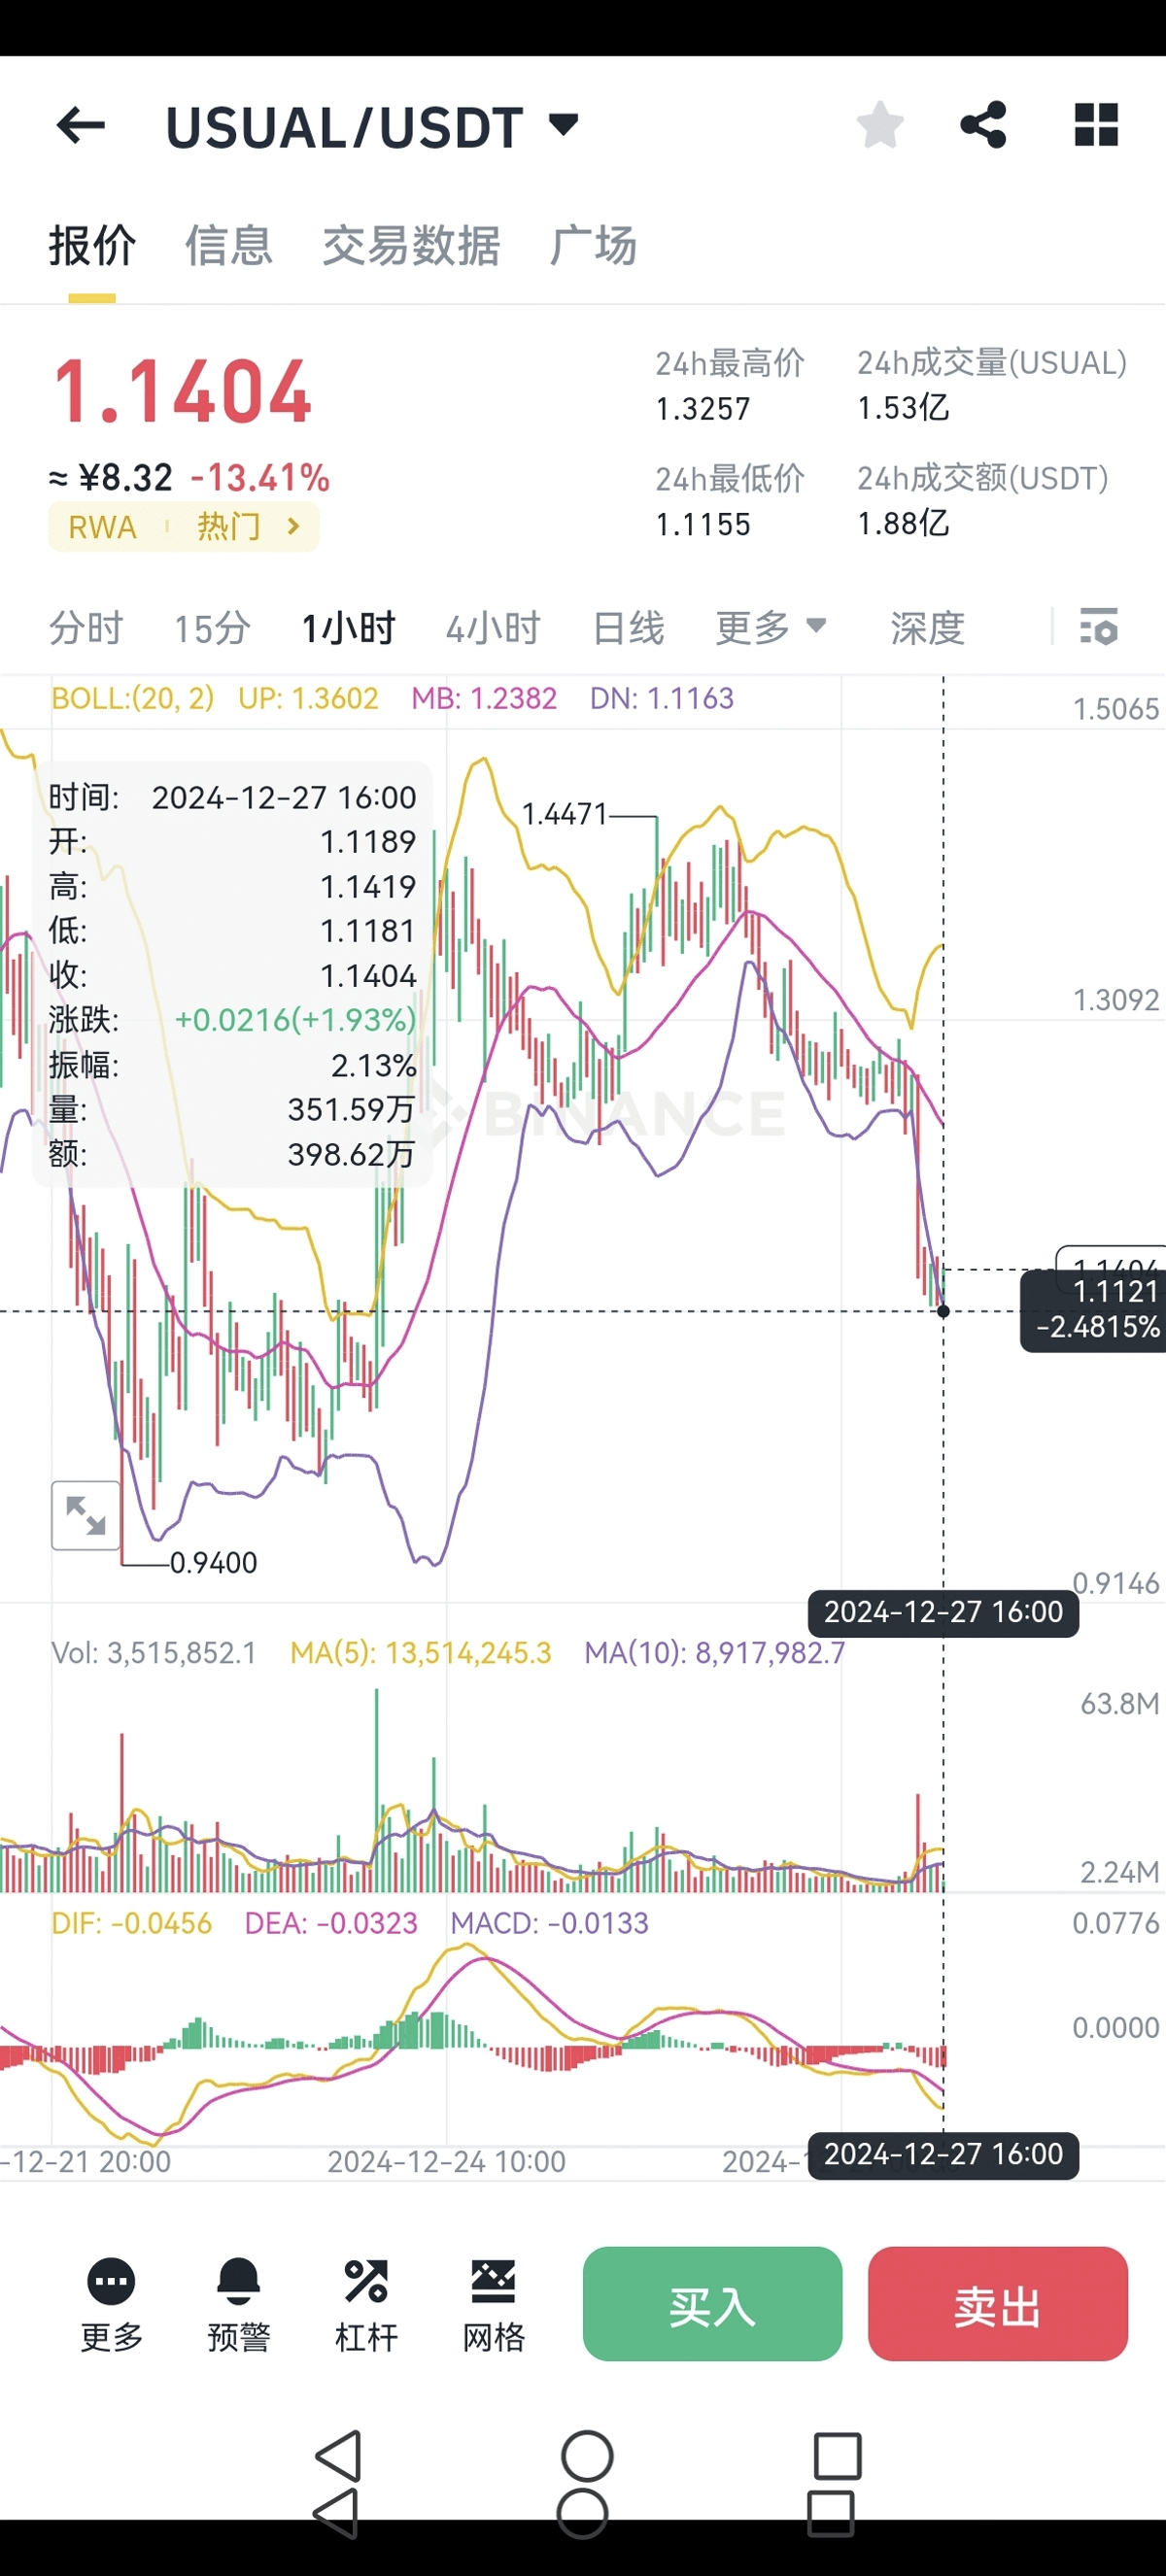
Try to use Bollinger Bands to check support levels. Bollinger Bands reflect resistance and support very well, and the curves of the upper and lower rails are very useful.
