This article is sponsored by Zscope
Zscope: Enabling anyone to become their own crypto analyst.
BTC has once again reached an ATH. Like the ATH earlier this year, it is difficult to make technical judgments at historical highs because there are no references. How much space is left above can only be viewed from the perspective of on-chain indicators.
Question 1: Is the current market value of BTC severely overestimated?
Conclusion: The bubble is not extreme enough to be called very extreme; without being very extreme, it cannot be said to be severely overestimated. If it is not severely overestimated, it cannot be said to have peaked; we must revert to the real value.
BTC Rainbow Chart
Has not reached the bull market level of 2021.

On-chain comprehensive four indicators (MVRV, SOPR, miner income level, reserve risk index)
When all four indicators meet extreme level conditions, a red shadow will be triggered.
Currently, it still has not reached the extreme conditions of the four indicators, nor has it reached the level of the first half of the year; the current value is 0.36, which is quite a difference.

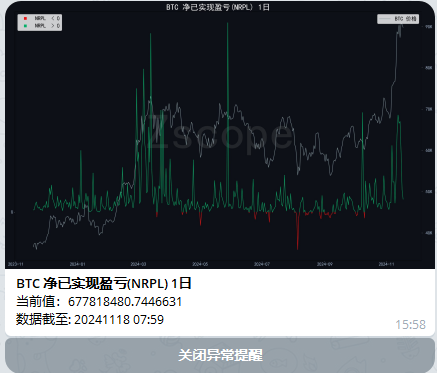
The on-chain net unrealized profit and loss level of BTC is not yet crazy; in other words, floating profits are not high and have not reached the level of the first half of the year.

The net realized profit of BTC on-chain is not high and has not reached the level of the first half of the year. In the figure, it can be seen that after huge realized profits often a phase of price adjustment occurs.
Question 2: Are there signs of large-scale reductions from major players?
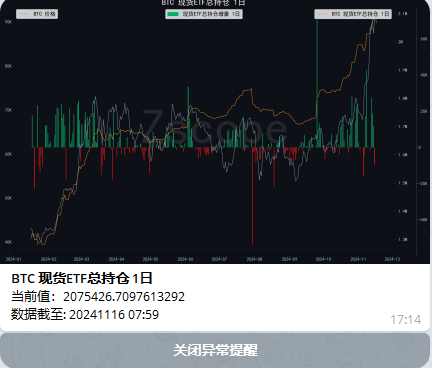
BTC ETF data situation (on-chain addresses serve as reference for ETF data)
Note that after a wave of large ETF increases, the second rally has begun, and currently, there are no signs of large-scale reductions in ETFs.

The BTC UTXO on-chain chip distribution data not only allows us to see the number and thickness of support levels, but I also personally use it to observe where the sell-offs are coming from and who is selling. I only care about the selling actions of major players; as long as it’s not a large-scale sell-off from important forces, I ignore it.
Historically, BTC UTXO data have always shown this pattern. After the ETF approval this year, the main force chips in the 25000 price range first showed large-scale reductions, followed by a phase of pullback. After reaching a new high in the following year, the chips from BlackRock in the 41000 price range also showed large-scale reductions, followed by a phase of pullback. The main force must run first, as their selling directly determines the trend.
We need to pay attention to the movement of the main force chip price segment; currently, 86393-90k is accumulating a new concentrated area.
The support intensity in the range of 73388-54880 is extremely strong in terms of both quantity and range.
Attention should be paid to the gap between 73388 and 86393, as well as the extreme level at 73388, which is near the previous high. From a technical perspective, if there is to be a technical pullback or horizontal consolidation here, the previous high is a key testing point.
A large-scale sell-off has occurred from the main price segment above, regarded as a signal for reducing positions.
Question 3: What is the overall supply and demand situation in the market? Is there purchasing power, and what is the potential sell-off risk for BTC?
The supply of the two major stablecoins on-site remains high, and there are currently no signs of purchasing power leaving.

The on-site supply of BTC is still continuously decreasing, and the potential risk of a large-scale sell-off is relatively low. There are currently no signs of supply entering.
But it should be noted that short-term fluctuations require attention to market liquidity, and we should pay more attention to order book data. When liquidity is poor, for example, when there are suddenly no buy orders or suddenly no sell orders, short-term prices may experience sharp rises and falls, even if the potential risk of large-scale sell-offs is low.
However, the overall trend conclusion is that market demand is strong, and supply is continuously decreasing.

Question 4: What is the dynamic trend of long-term holders?
Historically, whenever long-term holders are in the process of selling, the BTC price experiences a rising cycle.
Currently, long-term holders' chips have just started a new round of selling after a horizontal consolidation, and this process is ongoing. Personally, I believe it will not stop distributing at least in the short term, so pay attention to its next horizontal consolidation or a shift towards an upward trend.

Question 6: Are there potential risks in the short term? (Here, short term refers to periods measured in weeks)
Rough technical judgment (not enough time)
In the initial surge after breaking the descending channel, no stopping behavior has been observed so far, and there are no signals; the trend is also fine.

The only risky area is that the USDT market share has shown a volume increase at a key support level, indicating absorption behavior but not stopping. Altcoins are still in an upward process and have not reached a reversal. I speculate there may be a second test breakthrough at the previous low, and once a new low divergence buff appears and stops confirming, then it can only be a shark move; point D is relatively high. To put it plainly, the mid-term trend has a golden pit, and there is still one more opportunity to add positions.


