1. Bitcoin may continue to rebound in the short term, but BUT’s medium and long-term risks have not yet been eliminated.
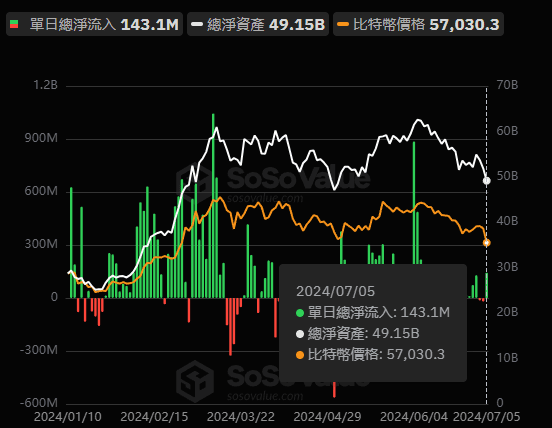
1) On July 5 last week, the single-day net inflow of Bitcoin spot ETF was US$143 million, which was the highest inflow since July. This shows that 55,000-50,000 is a short-term market holding position, which may lead to a short-term rebound. ;
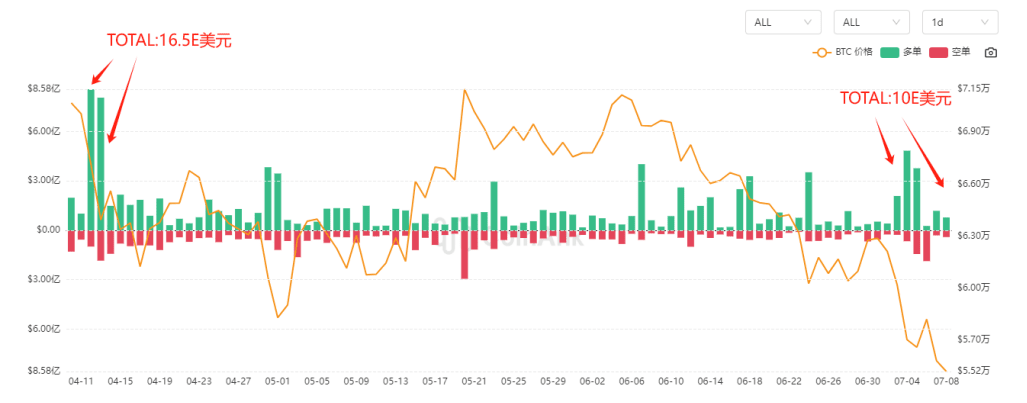
2) Let’s switch to the perspective of liquidation data to see if we can support and verify whether 55000-50000 is the short-term bottom?
From this picture, we can see that last week’s liquidation was $10E, which is less than the amount liquidated at the high level in April of this bull market;
This also shows that there are few long-term contracts in the short-term market that can be exploded. This may be a good opportunity to intervene in the short-term! !
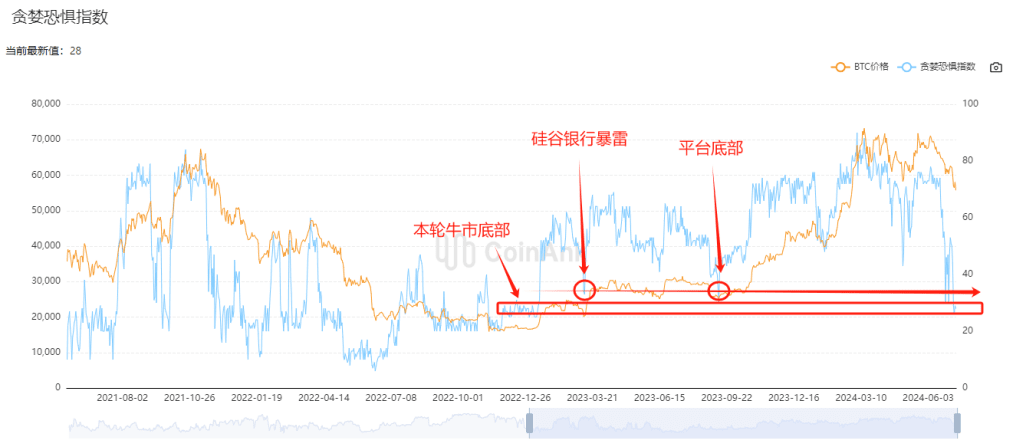
3) Let’s look at the greed and fear index, which has reached 25. The market is in an absolute fear stage. You can see that the current fear index has reached the bottom stage of this bull market, which is even worse than the Silicon Valley Bank thunderstorm and the bottom of the platform at that time. We need to be afraid at all times, Mr. Buffett said, others are afraid but we are greedy. Perhaps this is the time for us to step on other people’s corpses to enter the market! !
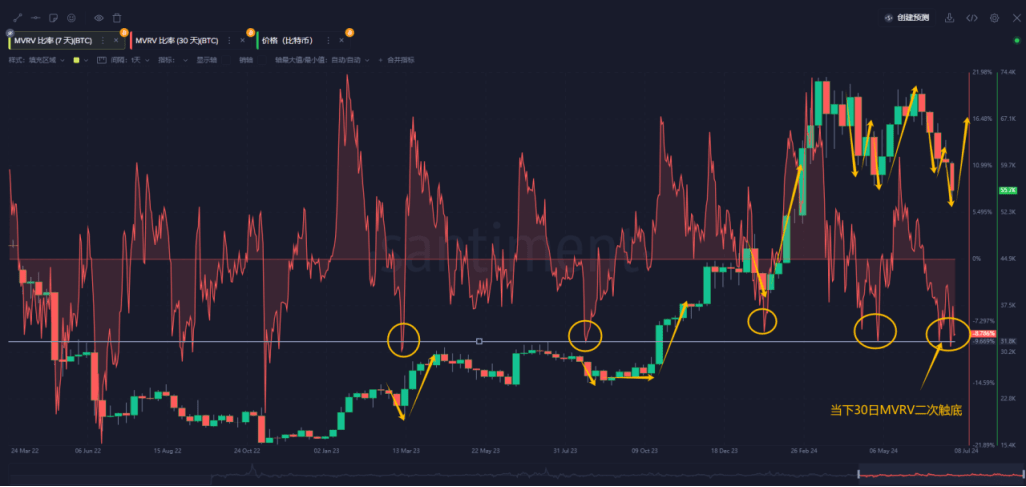
4) At the same time, we found that the MVRV bubble indicator on the 30th also showed an indication signal. First of all, we can see that every time the MVRV on the 30th falls to the gray line on the chart, it is in a bull market. In addition to recovering from sideways shocks, it rebounds quickly. ;So, if this bull market has not ended yet, then we have reason to believe that the bottom of this round may not be far away;
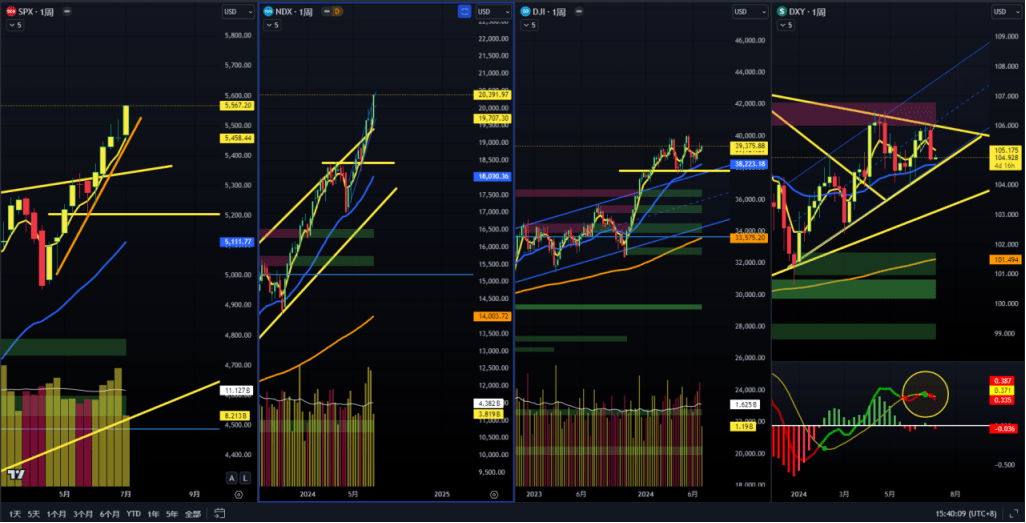
5) Back to the topic, in terms of analysis, we need cross-verification in many aspects. Let’s verify it by looking at the U.S. stock market and the trend of the U.S. dollar index;
We can see from the chart that U.S. stocks are optimistic, and the U.S. index MACD has also shown a weekly level dead cross signal, which also gives us the confidence to operate in the short-term crypto market;
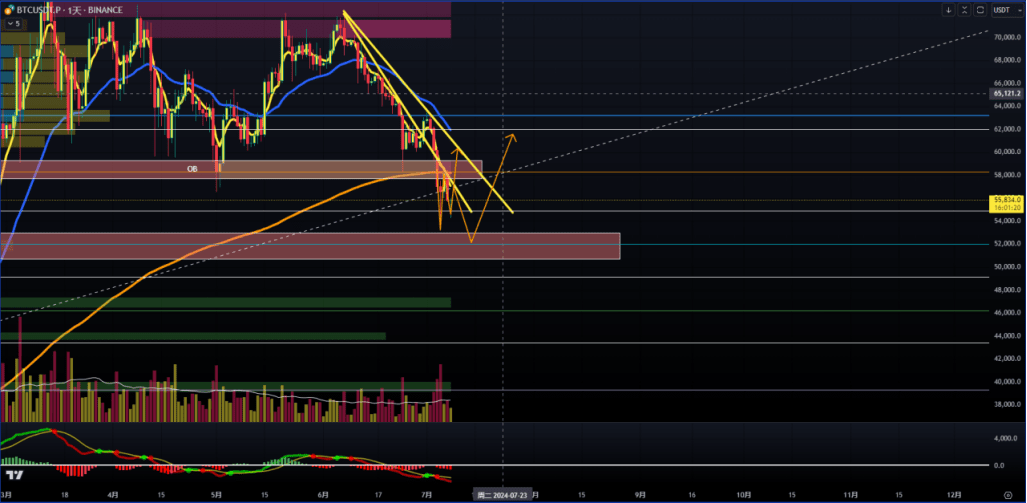
6) Okay, family members, now that we have looked at the big picture, let’s take a look at the performance of the chart. Is it worth participating in the layout now?
We came to the daily line and saw that the trend bottomed out at the Fibonacci 0.382 position for the second time, and closed the lower shadow line, indicating that this position still has some support;
7) At the 4H level, MACD may form a double bottom divergence signal, thus building a W bottom structure to challenge the M top neckline area of the large cycle. This position is very critical and everyone must remember it (because this position is also the daily level EMA200 the dividing line between bulls and bears). If it can stand firmly above 57,000-60,000, the market will be considered to be recovering; therefore, we cannot set our expectations too high for the time being, and we cannot relax in tracking to stabilize this wave;
8) However, if the challenge fails, the trend is still likely to drop to the Fibonacci 0.441 position, which is also the long-short exchange area ahead;
Therefore, you can intervene in the layout in batches at these two positions, and then have the opportunity to come to around 58000 to prepare for moving take-profit;