

#zen
zen
6.4M views
14,376 Discussing
Hot
Latest

·
--
🚨 $ZEN PRINTING THE EXACT SAME HARD-CAP SUPPLY SCARCITY PATTERN THAT LAUNCHED $ZEC ! 💥
Entry: 15 ⚡
Target: 30 - 75 🚀
📌 Hard-capped supply assets with just 21 million coins rarely stay quiet at the $15 floor once rotation kicks in. 📊 We saw this exact blueprint unfold on $ZEC , where an identical supply crunch off multi-month support triggered a massive structural expansion.
⚡ As order books thin out, smart capital is quietly absorbing float before liquidity shifts into a 2x to 5x run. 💬 Are you positioning early on this scarcity setup or waiting for the crowd to notice? 👇
⚠️ Not financial advice. Always manage your risk. 🛡️
🏷️ #ZEN #ZEC #Altcoins #Crypto #Momentum
🚀 💎
38

·
--
$ZEN IS COILING FOR A MOMENTUM EXPANSION OFF KEY SUPPORT! ⚡ 🚀
Entry: Market Price ⚡
Target: $6.20, $6.40 🚀
Stop Loss: $5.90 ⚠️
$ZEN is showing clean accumulation behavior at current market levels, with aggressive bids absorbing selling pressure right at the base of this structure. 📊 Order flow dynamics suggest smart money is positioning early for a swift move toward the upper target zones.
The tight stop loss gives us a crisp risk-to-reward ratio to capitalize on this upside momentum before liquidity gets swept higher. 💡 As long as buyers defend this support, the path of least resistance remains sharply upward. 💬 Are you bidding $ZEN at market or waiting for additional confirmation? 👇
⚠️ Not financial advice. Always manage your risk. 🛡️
🏷️ #ZEN #LongSetup #Altcoins #Crypto
🔥 💎
29
·
--
🚨 $ZEN RECLAIMS KEY SUPPORT AS BULLS PREPARE TO EXPAND TOWARD UPWARD TARGETS 🟢
Entry: $6.10 ⚡
Target: $6.30 - $6.60 🚀
Stop Loss: $5.90 ⚠️
$ZEN is consolidating right over the $6.10 pivot level, where aggressive bids are stepping in to absorb market supply. 📊 Sellers tried pushing price lower, but order flow reveals swift reclaims, signaling a textbook momentum flip in progress.
📌 With tight invalidation anchored below $5.90, this order block presents an asymmetric risk-to-reward setup. 💡 As buying volume expands off this accumulation shelf, a swift move toward upper liquidity pools at $6.30 and $6.60 remains the path of least resistance.
💬 Are you taking the bid at $6.10 or waiting for a high-volume confirmation candle above resistance? 👇
⚠️ Not financial advice. Always manage your risk. 🛡️
🏷️ #ZEN #LongSetup #Crypto #Breakout #Altcoins
⚡ 💎
36
·
--
💥 $ZEN PREPARES FOR HIGH-VELOCITY BREAKOUT AS PRIVACY SECTOR MOMENTUM SURGES! 🚀
Entry: 6.35 ⚡
Target: 8.000 🚀
Stop Loss: 5.720 ⚠️
📌 Capital is rotating aggressively into privacy protocol setups following massive strength in $ZEC , and $ZEN is now coiling directly inside the critical 6.35 demand zone. 📊 Sellers are rapidly losing absorption power while momentum indicators align for a powerful trend continuation.
💡 A sustained reclaim above this consolidation base opens up a clear expansion vector toward higher structural liquidity up to 8.000. ⚡ Risk remains tightly anchored below 5.720, offering a high-conviction asymmetric setup as volume builds.
💬 Are you positioning early on this $ZEN momentum structure or waiting for resistance to snap first? 👇
⚠️ Not financial advice. Always manage your risk. 🛡️
🏷️ #ZEN #ZEC #Breakout #Altcoins #Crypto
⚡ 🎯
25

🚨 $ZEN RECLAIMS CRITICAL SUPPORT AS BULLS PREPARE FOR A RUN TO 6.70! 💥
Entry: 6.33 - 6.37 ⚡
Target: 6.70 🚀
Stop Loss: 6.21 ⚠️
Bulls have successfully defended and flipped the 6.33 level back into structural support. 📊 Order flow is shifting decisively upward as short-term buyers step in to absorb overhead supply.
⚡ If this momentum holds through the current consolidation, the runway clears for a direct expansion toward the 6.70 liquidity pocket. 📌 Risk is strictly defined below 6.21, giving this setup a sharp asymmetric profile. 🤔 Are you riding this reclaim to resistance or waiting for another retest? 👇
⚠️ Not financial advice. Always manage your risk. 🛡️
🏷️ #ZEN #LongSetup #Crypto #Breakout
🔥 🎯
30
·
--
🚨 $ZEN BREAKS OUT ABOVE KEY RESISTANCE WITH EXPLOSIVE HOURLY MOMENTUM! 🚀
Entry: 7.40 – 7.55 ⚡
Target: 7.80 / 8.10 / 8.50 🚀
Stop Loss: 7.15 ⚠️
📌 Buyers are aggressively tearing through the $7.50 supply zone, stacking consecutive green hourly candles into a clean higher-high market structure. 📊 As long as demand holds firm above the $7.40 flip level, order flow heavily favors another leg upward into higher resistance targets.
⚡ Momentum traders are clearly front-running this expansion, leaving very little room for late sellers to breathe. 💡 With structure fully aligned on the lower timeframes, the path of least resistance remains sharply upward. 💬 Are you riding this momentum wave or waiting for a retest of support? 👇
⚠️ Not financial advice. Always manage your risk. 🛡️
🏷️ #ZEN #LongSetup #Breakout #Crypto
🔥 💎
23
·
--
$ZEN DELIVERS ANOTHER PERFECT TARGET SLICE AT $7.40 AS MOMENTUM EXPANDS 🎯 ⚡
Target: 7.40 🚀
Buyers smashed through the $7.00 resistance level before driving price action straight into our secondary $7.40 objective. 📊 That brings the current run to five consecutive winning setups with flawless execution across the board.
The order flow absorbed overhead selling pressure precisely on schedule, showing strong buyer conviction during the breakout. ⚡ With structural liquidity reclaimed, watching how price consolidates here will set the stage for the next leg. 💬 Are you securing gains at $7.40 or trailing your stops for a higher continuation? 👇
⚠️ Not financial advice. Always manage your risk. 🛡️
🏷️ #ZEN #Crypto #Trading #Breakout
🔥 🎯
24
·
--
⚡ $ZEN VAPORIZES RESISTANCE WITH AN EXPLOSIVE 18% VOLUME-BACKED VERTICAL SURGE! 🚀
Target: 9.800 🚀
Aggressive market orders are devouring sell liquidity as $ZEN tears through key local ceilings, printing an undeniable expansion candle today. 📊 Massive order flow volume is backing this move, leaving short sellers completely out of position as momentum accelerates.
Standing against a freight train of this caliber is a fast track to getting squeezed while smart money rides the trend. ⚡ The order book is signaling heavy continuation into upper overhead targets while buyers absorb every micro-pullback with zero hesitation. 💬 Are you riding this vertical breakout to the target or waiting for a retest? 👇
⚠️ Not financial advice. Always manage your risk. 🛡️
🏷️ #ZEN #Breakout #Crypto #Momentum #BTR
💥 🐂
20

🔻 SELLER VOLUME EXPANDS ON $ZEN FOR A HIGH-CONVICTION SHORT SWIPE 🚨
Entry: 7.36 - 7.55 ⚡
Target: 6.77 🎯
Stop Loss: 8.04 ⚠️
Sellers are stacking heavy order flow into the 7.36 - 7.55 resistance zone as buying momentum completely dries up. 📉 This weak retest reflects classic institutional distribution, setting up a swift move lower toward untapped market liquidity. 📊
Invalidation is clearly defined right above 8.04, presenting a crisp, asymmetric trade profile down to our lower targets. 💡 Bears maintain firm command over local market structure as momentum shifts downward. 💬 Are you shorting this distribution block or waiting for lower support to shatter? 👇
⚠️ Not financial advice. Always manage your risk. 🛡️
🏷️ #ZEN #ShortSetup #Bearish #Crypto #Trading
📉 🐻
34
🚨 $ZEN BREAKS OUT ABOVE $7.50 RESISTANCE WITH EXPLOSIVE BULLISH MOMENTUM! 💥
Entry: 7.70 - 7.90 ⚡
Target: 8.10 - 8.80 🚀
Stop Loss: 7.45 ⚠️
📌 Sellers just lost control of the critical $7.50 level as aggressive market orders pushed $ZEN into a violent 4H expansion toward $7.90. 📊 The momentum flip is real, and as long as buyers defend the $7.60–$7.70 demand zone, the path of least resistance remains strictly upward.
⚡ If this retest holds clean, the next liquidity pools up to $8.80 are primed for a fast sweep. 💬 Are you riding this momentum continuation or waiting for a deeper pullback? 👇
⚠️ Not financial advice. Always manage your risk. 🛡️
🏷️ #ZEN #Breakout #Altcoins #CryptoTrading #ZEC
🔥 💎
38

💥 $ZEN READY TO EXPLODE TOWARD 10.00 AS ACCUMULATION REACHES CREST LEVEL! 🚀
Entry: 7.85 - 7.90 ⚡
Target: 8.235 - 10.00 🚀
Stop Loss: 7.23 ⚠️
📌 Smart money is quietly absorbing sell-side pressure in the 7.85 to 7.90 demand zone, setting up a high-probability support flip. 🔍 Momentum indicators on the lower timeframes suggest sellers are running out of fuel right before the next potential expansion leg.
💡 Keeping risk strictly controlled below 7.23 offers an asymmetric risk-to-reward ratio as buyers target interim levels at 8.235, 8.88, and 9.50 on the path to 10.00. 💬 Are you bidding this demand retest or waiting for a clean breakout past 8.88? 👇
⚠️ Not financial advice. Always manage your risk. 🛡️
🏷️ #ZEN #LongSetup #Breakout #Altcoins #Crypto
🔥 💎
18
·
--
💥 $ZEN CLEARS RESISTANCE AS BULLS ACCELERATE TOWARD HIGHER LIQUIDITY TARGETS! 🚀
Entry: 7.90 - 8.00 ⚡
Target: 8.30 - 8.96 🚀
Stop Loss: 7.56 ⚠️
Buyers have systematically reclaimed control, pushing $ZEN directly into the 8.00 zone with relentless upward pressure. 📊 The steady stair-step structure signals aggressive spot absorption, leaving minimal overhead sell-side resistance.
Holding above the entry zone locks in a clean market structure flip, setting up a direct expansion toward higher supply targets. ⚡ Momentum indicators are firing on all cylinders as buyers front-run the next leg up. 💡
💬 Are you riding this breakout move or waiting to see if support holds first? 👇
⚠️ Not financial advice. Always manage your risk. 🛡️
🏷️ #ZEN #LongSetup #Breakout #Crypto
🔥 ⚡
23
·
--
📉 HEAVY REJECTION AT RESISTANCE SENDS $ZEN TUMBLING TOWARD KEY DEMAND! 🔻
Entry: 7.687 - 7.763 ⚡
Target: 6.927 📉
Stop Loss: 8.096 ⚠️
Sellers firmly defended the $8.00 psychological wall, leaving behind a sharp rejection tail as downside volume starts to expand. 📊 A clean breakdown beneath 7.687 opens up a clear run straight into lower liquidity pockets.
With momentum tipping heavily toward the bears, order flow suggests sellers are taking control ahead of a deeper liquidity sweep. 🌊 Downside pressure is building fast across shorter timeframes, pointing toward a swift leg lower. 📌
🤔 Are you riding this momentum down to 6.927 or waiting for a temporary bounce? 👇
⚠️ Not financial advice. Always manage your risk. 🛡️
🏷️ #ZEN #ShortSetup #Crypto #Bearish #Trading
🔴 🐻
29
💥 $ZEN AND $DASH LEADING THE CHARGE AS HIGH-CONVICTION SETUPS UNLOCK! 🚀
Capital is shifting fast into active movers, with $ZEN and $DASH carving out clean momentum continuation structures as bids stack up on lower timeframes. 📊 Order flow indicates smart money is aggressively absorbing floating supply right at these key technical inflection points.
When volume expands across top gainers alongside tokens like $MARSCOIN , it signals a prime window for momentum traders to catch early velocity before retail FOMO hits. ⚡ Keeping a close eye on these retests gives us the cleanest risk-to-reward edge on the board.
🤔 Which of these top momentum movers are you bidding for continuation today? 👇
⚠️ Not financial advice. Always manage your risk. 🛡️
🏷️ #ZEN #DASH #MARSCOIN #Altcoins #Breakout
🔥 💎
29
·
--
🔻 HEAVY REJECTION AT $8.00 COLLAPSES $ZEN INTO CRITICAL DOWN-TRENDING WINDOW! 🚨
Entry: 7.30 - 7.45 ⚡
Target: 6.50 🎯
Stop Loss: 7.75 ⚠️
Sellers stepped up heavy right at the $8.00 ceiling, capping the recent expansion with back-to-back bearish candle prints. 📊 A clean breakdown beneath the 7.30 structural trigger opens the trapdoor for downside momentum to accelerate.
💡 Order flow reveals aggressive distribution as momentum shifts, setting up an ideal risk-managed unwind toward lower demand pools. 💬 Are you shorting this breakdown to 6.50 or waiting to buy the floor? 👇
⚠️ Not financial advice. Always manage your risk. 🛡️
🏷️ #ZEN #ShortSetup #Bearish #Crypto #Trading
🔴 📉
24
·
--
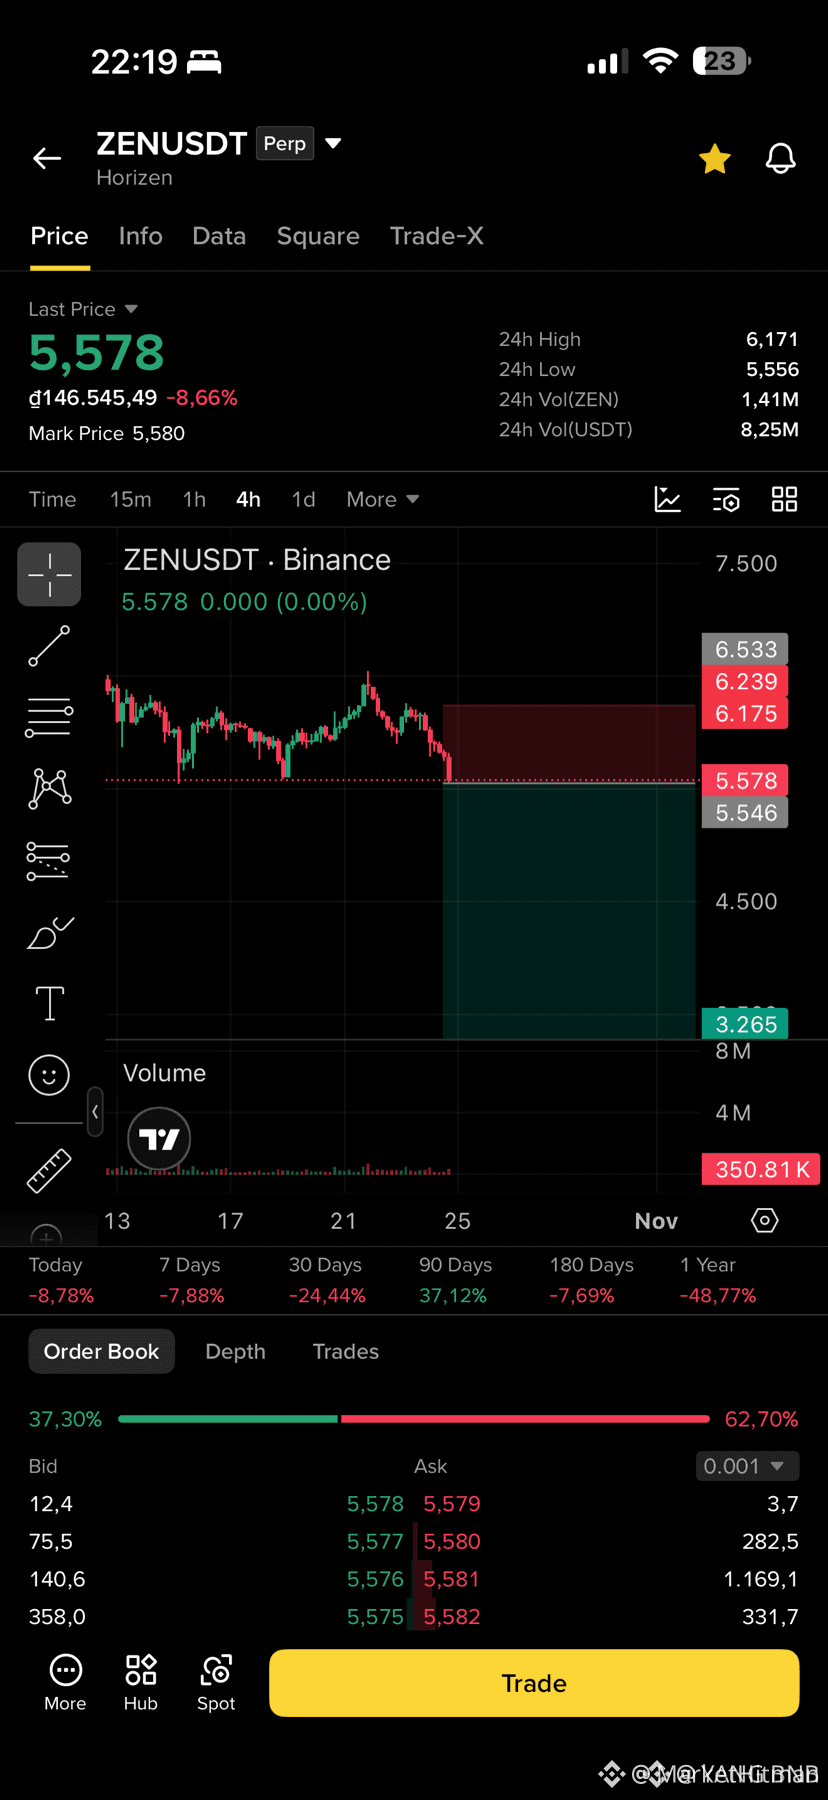
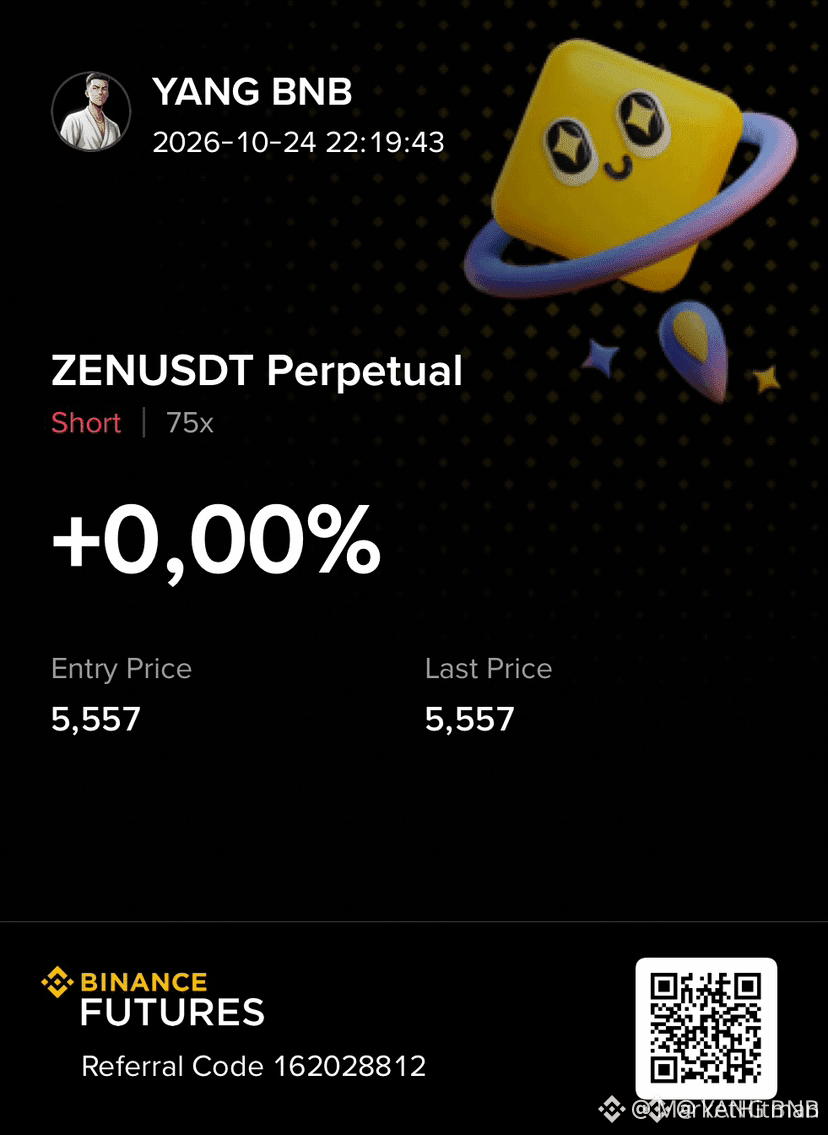
🚨 $ZEN BEAR SWEEP ON THE HORIZON! 🔴
Entry: 5.55-5.65 ⚡
Target: 5.30 / 4.90 / 4.50 🎯
Stop Loss: 6.20 ⚠️
📉 The 4H frame is screaming lower highs, and the $5.55 support is cracking under relentless sell pressure. 🦈 Smart money is draining liquidity, and each bite pushes the market deeper into the red. 📊 Volume spikes confirm the bearish tide, making a clean break look imminent.
💬 Are you ready to ride the downside wave or waiting for the next liquidity grab? 👇
⚠️ Not financial advice. Always manage your risk. 🛡️
🏷️ #ZEN #ShortSetup #Bearish #Crypto
🔥 🦈
15

·
--
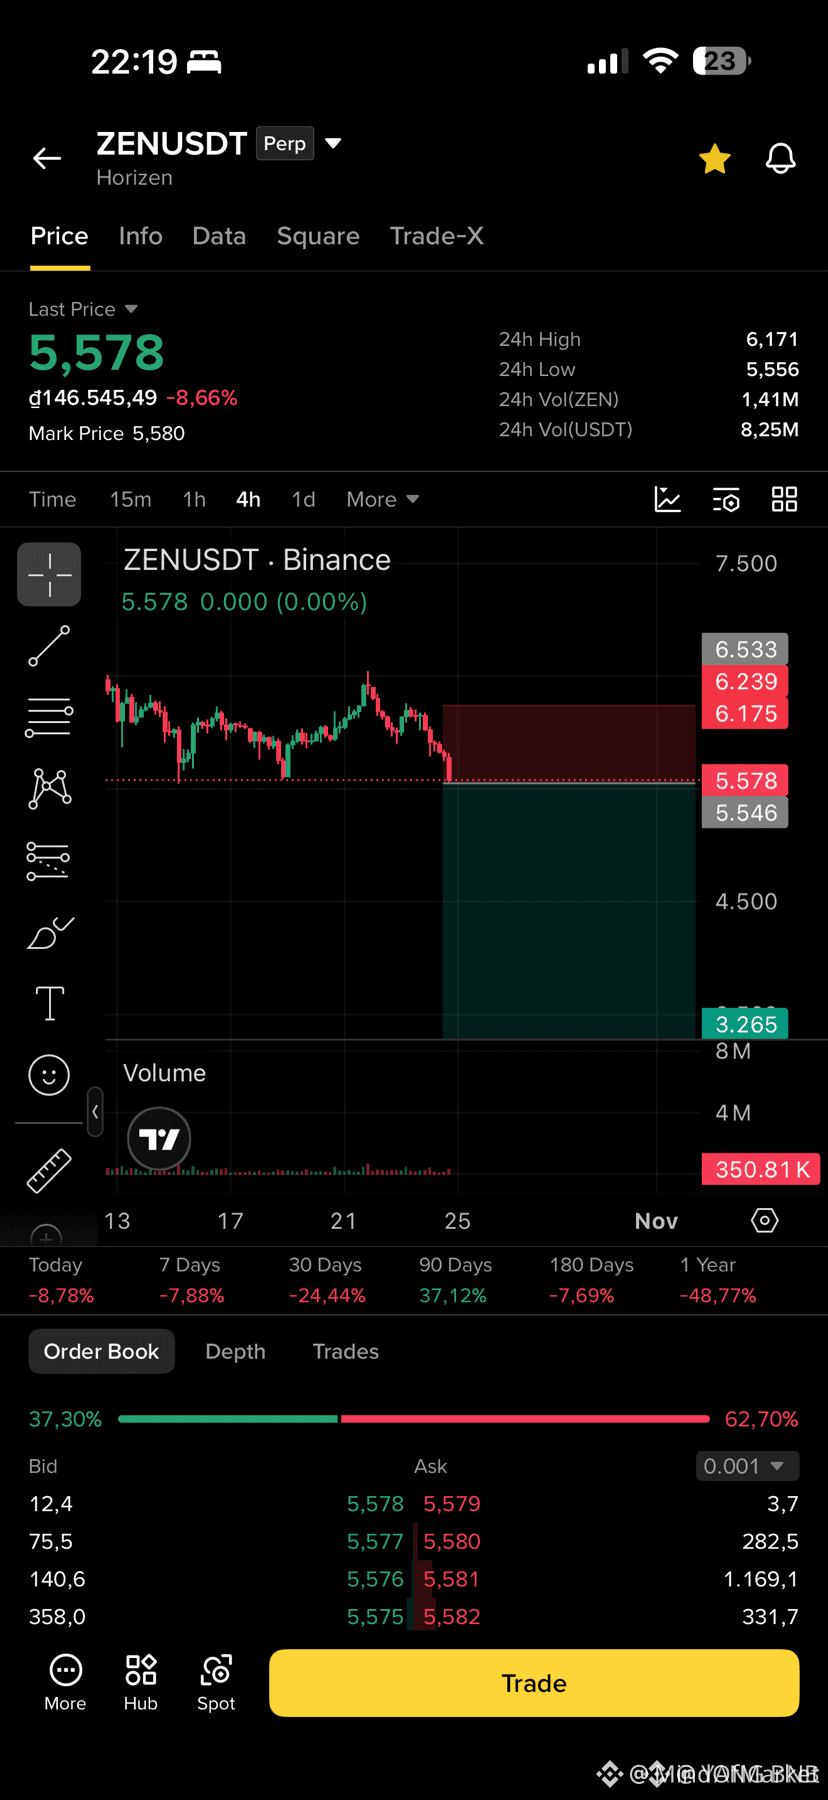
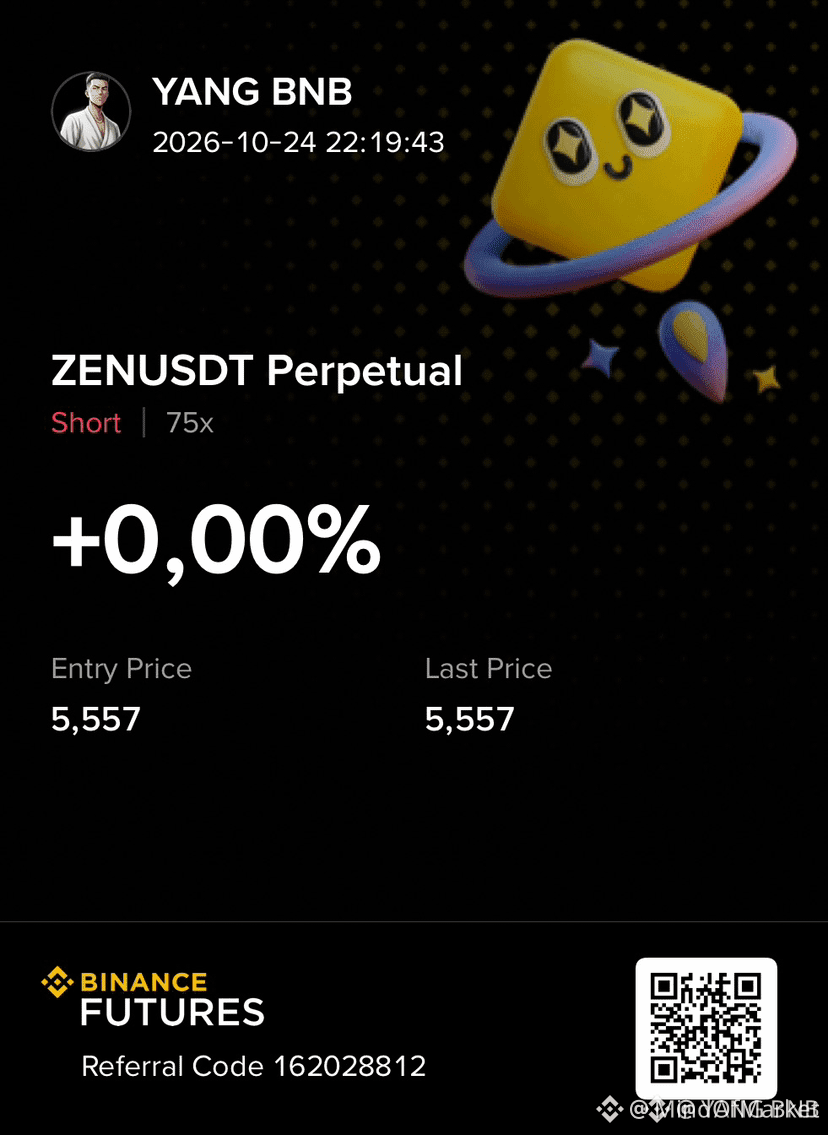
🔴 $ZEN BEARISH BREAKDOWN THREATENS $5.55 SUPPORT 🐻
Entry: 5.55-5.65 ⚡
Target: 5.30, 4.90, 4.50 🚀
Stop Loss: 6.20 ⚠️
The 4H frame is painting a textbook descending triangle, with lower highs eroding the last bullish foothold. A clean break below the $5.55 📌 order block would hand the market to the smart‑money sellers hunting liquidity 🌊.
Volume spikes 📊 on the downside and a rising bearish divergence on the RSI confirm the pressure, while the $6.20 stop sits snug above the recent swing high, offering a tight risk envelope ⚡.
💬 Are you positioning for the next leg down or waiting for a trap? 👇
⚠️ Not financial advice. Always manage your risk. 🛡️
🏷️ #ZEN #ShortSetup #Bearish #Liquidity #Crypto
🦈 🔥
18

·
--
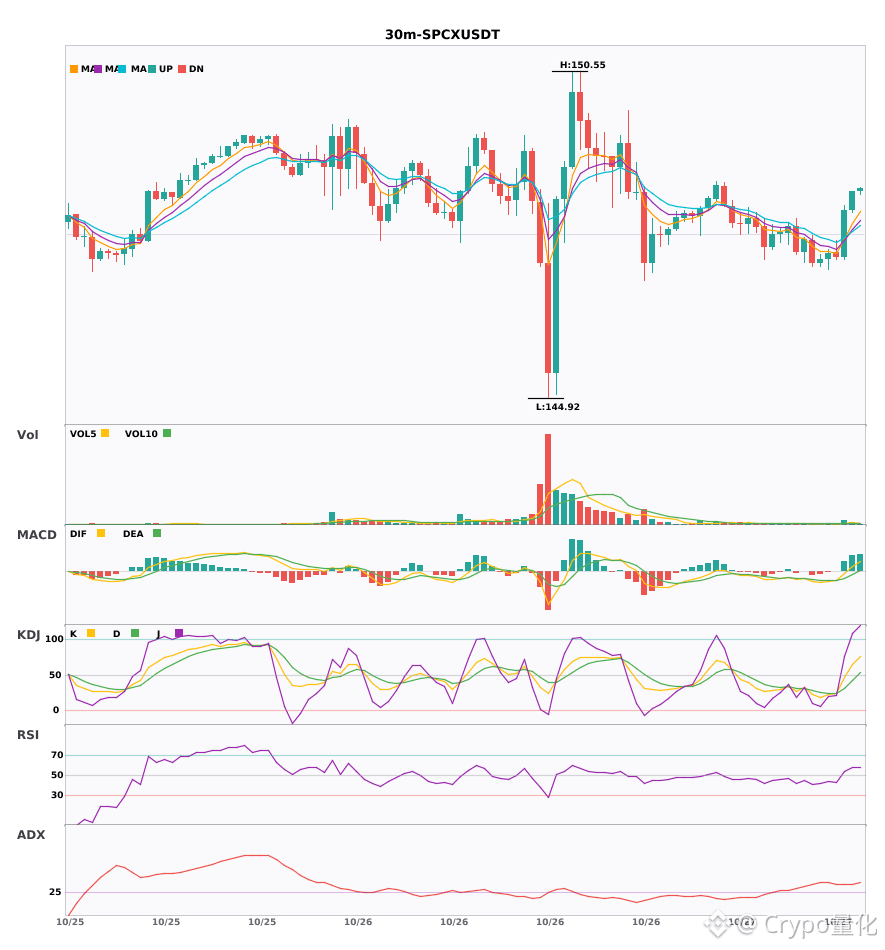
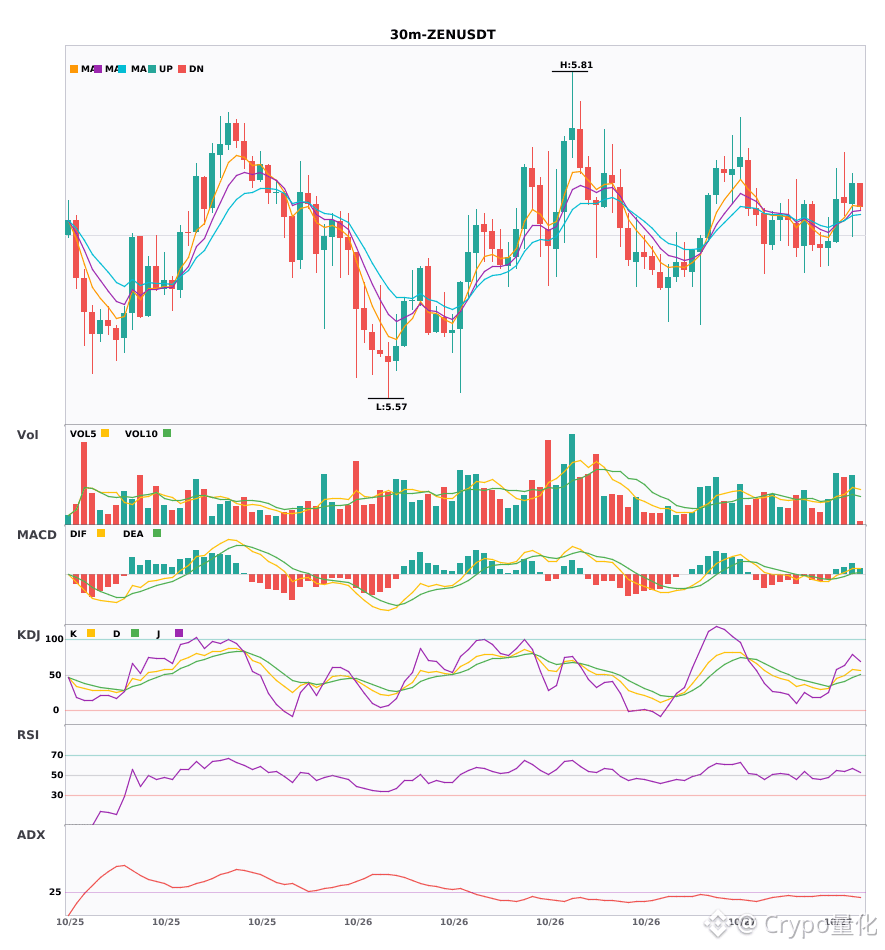
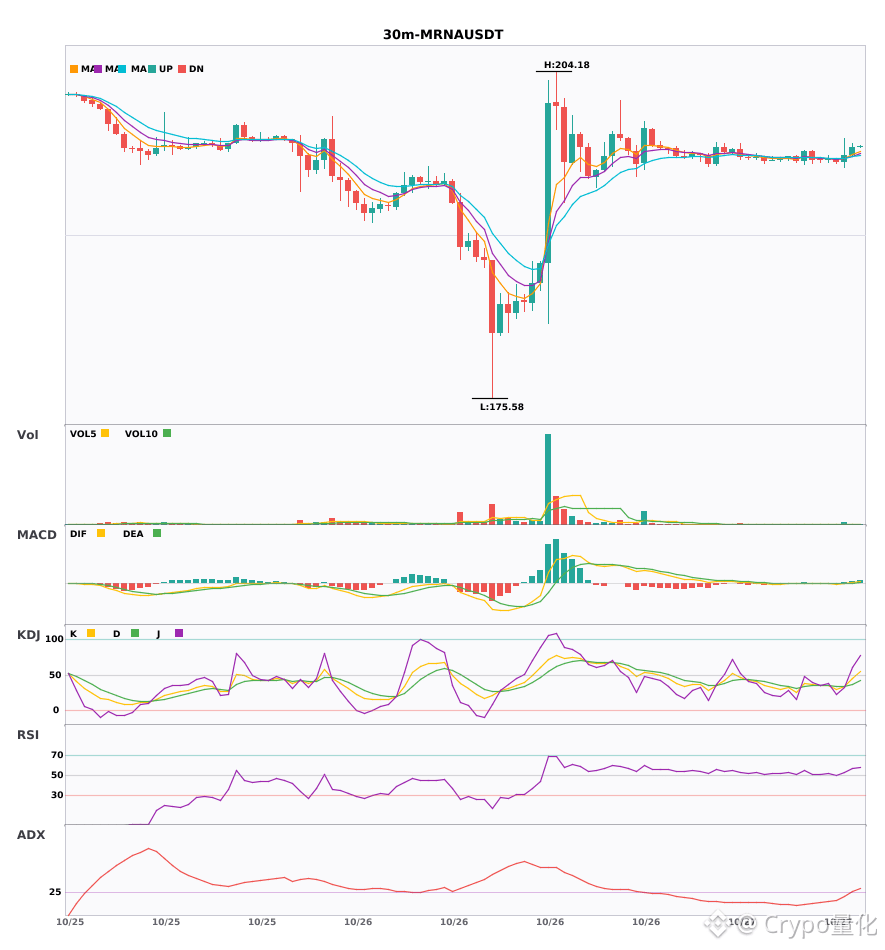
$SPCX / $ZEN / $MRNA 30-minute charts are bullish, with short-term confluence opportunities 🔥
════════════════════
🔴 $SPCX 30-minute bullish signal
⚠️Technical analysis: ADX (38) indicates a clear trending market | MACD DIF breaks above the zero line, signaling a bullish trend | EMA5 > EMA8 > EMA13, bullish alignment | Volume surge (3.5x)
════════════════════
🔴 $ZEN 30-minute bullish signal
⚠️Technical analysis: ADX (25) indicates a trend is forming; an opportunity to participate | MACD DIF breaks above the zero line, signaling a bullish trend | EMA5 > EMA8 > EMA13, bullish alignment | KDJ is weak, with bears in control (K: 48.9, D: 41.5) | Volume increase (1.9x)
════════════════════
🔴 $MRNA 30-minute bullish signal
⚠️Technical analysis: ADX (29) indicates a trend is forming; an opportunity to participate | MACD DIF breaks above the zero line, signaling a bullish trend | EMA5 crosses above EMA8, indicating a short-term bullish turn | KDJ golden cross, short-term outlook is bullish (K: 45.0, D: 37.3) | Volume surge (4.8x)
════════════════════
🔔 Follow for the latest market movements 🔔
#技术分析 #SPCX #ZEN #MRNA
📌 When trading, check whether the candlestick pattern confirms the signal
════════════════════
🔴 $SPCX 30-minute bullish signal
⚠️Technical analysis: ADX (38) indicates a clear trending market | MACD DIF breaks above the zero line, signaling a bullish trend | EMA5 > EMA8 > EMA13, bullish alignment | Volume surge (3.5x)
════════════════════
🔴 $ZEN 30-minute bullish signal
⚠️Technical analysis: ADX (25) indicates a trend is forming; an opportunity to participate | MACD DIF breaks above the zero line, signaling a bullish trend | EMA5 > EMA8 > EMA13, bullish alignment | KDJ is weak, with bears in control (K: 48.9, D: 41.5) | Volume increase (1.9x)
════════════════════
🔴 $MRNA 30-minute bullish signal
⚠️Technical analysis: ADX (29) indicates a trend is forming; an opportunity to participate | MACD DIF breaks above the zero line, signaling a bullish trend | EMA5 crosses above EMA8, indicating a short-term bullish turn | KDJ golden cross, short-term outlook is bullish (K: 45.0, D: 37.3) | Volume surge (4.8x)
════════════════════
🔔 Follow for the latest market movements 🔔
#技术分析 #SPCX #ZEN #MRNA
📌 When trading, check whether the candlestick pattern confirms the signal
8

·
--

Article
ZEN slipped about 1.5%—why were long liquidations nearly 175 times higher?ZEN was gently sold off by about 1.5% on both exchanges, but liquidations over the past day were almost entirely on the long side: about $98,422 in longs versus roughly $563 in shorts, widening the liquidation gap to around 175 times.
Binance: about $5.67300000 (-1.6130%); OKX: about $5.67600000 (-1.5950%). Over 24 hours, long liquidations totaled about $98,422 and short liquidations about $563, for roughly $98,985 across 76 liquidations. Open interest was about 5.79 million on Binance and 1.19 million on OKX; the long/short account ratio was about 57.2%/42.8%. Binance funding was about -0.000047 and OKX about +0.000006, with the two rates pulling in opposite directions.
Price only softened by about 1.5%, and long positions still made up more than half of accounts, yet almost all liquidations were longs—this looks more like leveraged longs getting caught out first during a decline than short-led wash trading.
ZEN slipped about 1.5%—why were long liquidations nearly 175 times higher?
ZEN was gently sold off by about 1.5% on both exchanges, but liquidations over the past day were almost entirely on the long side: about $98,422 in longs versus roughly $563 in shorts, widening the liquidation gap to around 175 times.
Binance: about $5.67300000 (-1.6130%); OKX: about $5.67600000 (-1.5950%). Over 24 hours, long liquidations totaled about $98,422 and short liquidations about $563, for roughly $98,985 across 76 liquidations. Open interest was about 5.79 million on Binance and 1.19 million on OKX; the long/short account ratio was about 57.2%/42.8%. Binance funding was about -0.000047 and OKX about +0.000006, with the two rates pulling in opposite directions.
Price only softened by about 1.5%, and long positions still made up more than half of accounts, yet almost all liquidations were longs—this looks more like leveraged longs getting caught out first during a decline than short-led wash trading.
36
🚨 HEAVY DISTRIBUTION ON $ZEN SENDS CLEAR BEARISH CONTINUATION SIGNAL 📉
Entry: 7.2 - 7.5 🔻
Target: 6.8 - 6.5 📉
Stop Loss: 7.78 🛑
Smart money is visibly dumping $ZEN inventory directly into late-chasing buyers near local resistance. 📊 Heavy distribution volume across lower timeframes confirms market makers are unloading, leaving aggressive longs as exit liquidity.
With overhead supply overwhelming bids, momentum is rolling over for a clean breakdown toward deeper demand zones. 🔍 The order flow heavily favors sellers as support thins out. 💬 Are you positioning short alongside institutional order flow or catching falling knives here? 👇
⚠️ Not financial advice. Always manage your risk. 🛡️
🏷️ #ZEN #ShortSetup #Bearish #MarketStructure #Crypto
🔻 🩸
18
Log in to explore more content
Join global crypto users on Binance Square
⚡️ Get latest and useful information about crypto.
💬 Trusted by the world’s largest crypto exchange.
👍 Discover real insights from verified creators.
Email / Phone number
Trending Topics
1
#CanMicrosoftDeliverOnAI
40,667 views
538 Discussing
2
#CanGoogleDefindItsCore
19,797 views
415 Discussing
3
#FOMCWatch
9M views
27,699 Discussing
4
#EthereumDropsBelow$2300
9,340 views
144 Discussing
5
#BitcoinSlipsBelow$80KAgain
26,054 views
111 Discussing
6
#ThailandLaunchesWORPTStablecoinToQRPaymentApp
50,747 views
721 Discussing
7
#StrategySkipsBitcoinPurchasesSpends$205MOnSTRCBuybacks
10,063 views
94 Discussing
8
#BitmineAdds10452ETH
91,678 views
1,107 Discussing
9
#SouthKoreaConsidersEducationTaxOnCryptoExchanges
49,311 views
810 Discussing
10
#OCCUrgesCommunityBanksToEnterStablecoinPayments
37,858 views
577 Discussing