
#phantich
phantich
50,972 views
333 Discussing
Hot
Latest

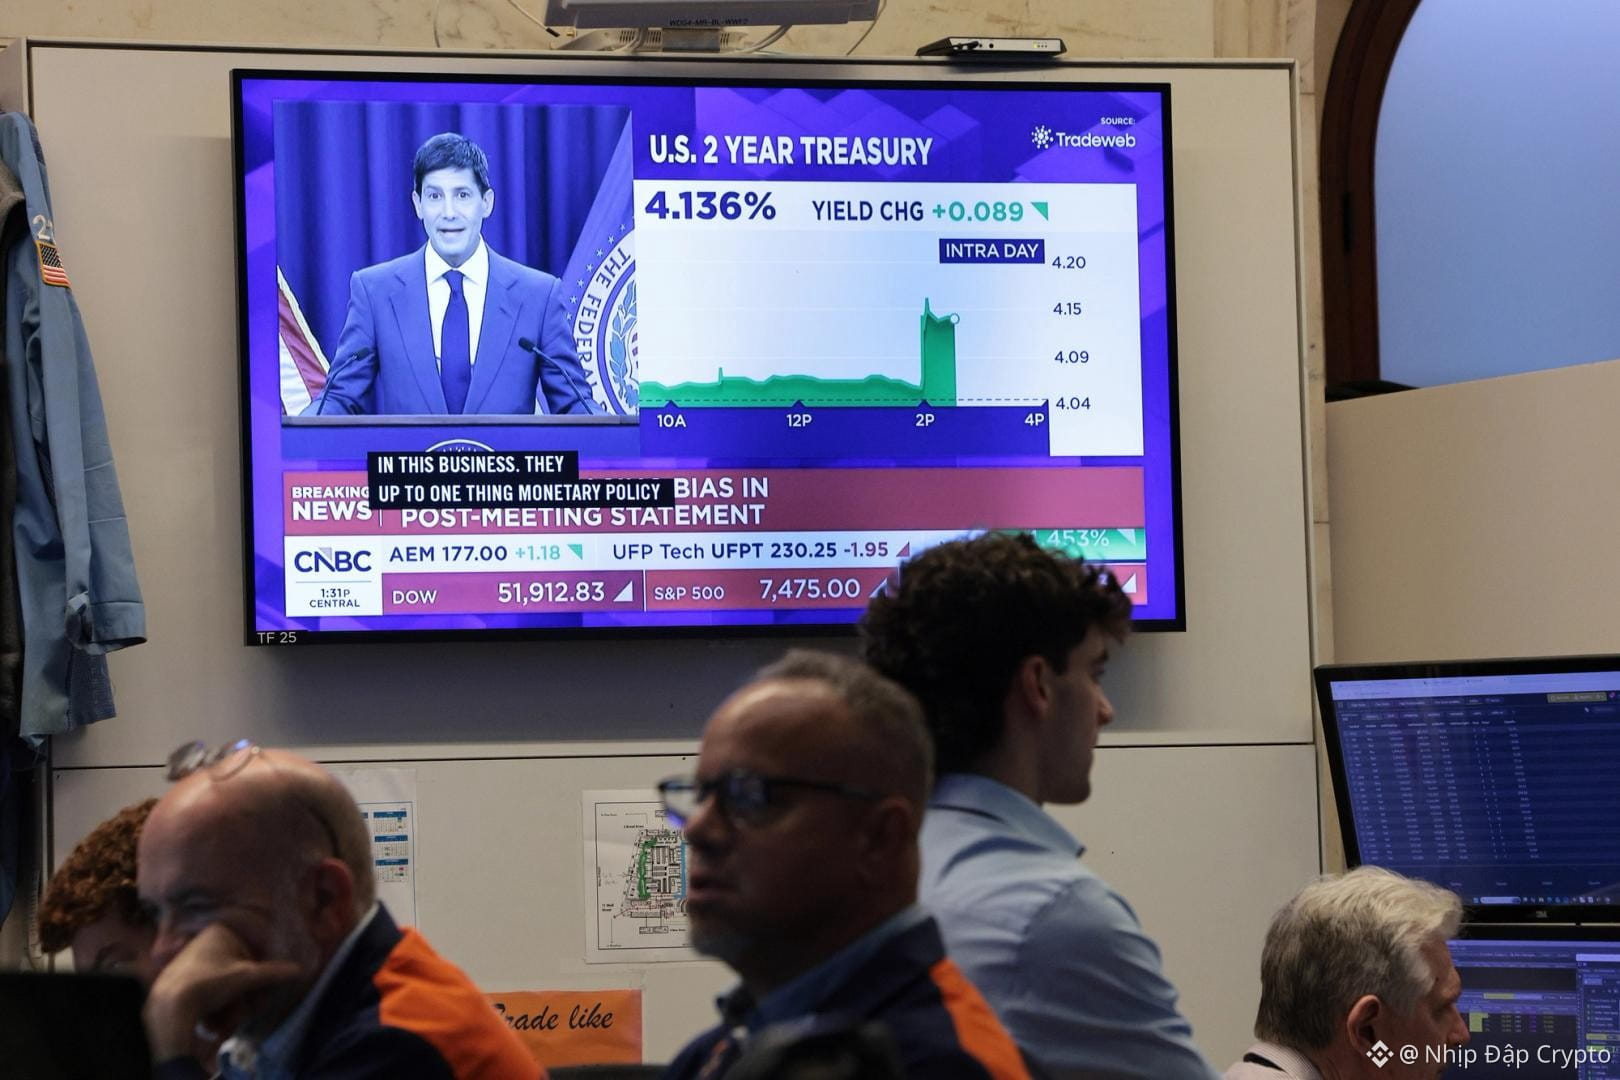
The latest U.S. jobs report sent bond yields sharply higher and $BTC was immediately pressured, but are we being swept up in an overly aggressive sell-off?
A breakdown of the data shows wage inflation pressure did not explode, and Fed rate expectations on CME FedWatch are nearly unchanged. The recent drop mainly came from news-driven selling algorithms, triggering a liquidation cascade of highly leveraged long positions.
At the time of writing, $BTC is trading around $79,428.2 (-0.40% in 24h). This support zone around $79,000 - $79,400 is a key line of defense:
- Positive scenario: Price holds this area to absorb selling pressure and confirm a short-term shakeout.
- Negative scenario: If support breaks under heavy selling, there is a risk of falling into deeper liquidity zones.
My personal view: Futures traders should reduce leverage, follow stop-loss rules, and patiently wait for confirmation signals instead of rushing to catch the falling knife.
Do you think this price level for $BTC is an opportunity or a risk? Check the $BTC chart below! 👇
#BTC #Bitcoin #Crypto #PhanTich
A breakdown of the data shows wage inflation pressure did not explode, and Fed rate expectations on CME FedWatch are nearly unchanged. The recent drop mainly came from news-driven selling algorithms, triggering a liquidation cascade of highly leveraged long positions.
At the time of writing, $BTC is trading around $79,428.2 (-0.40% in 24h). This support zone around $79,000 - $79,400 is a key line of defense:
- Positive scenario: Price holds this area to absorb selling pressure and confirm a short-term shakeout.
- Negative scenario: If support breaks under heavy selling, there is a risk of falling into deeper liquidity zones.
My personal view: Futures traders should reduce leverage, follow stop-loss rules, and patiently wait for confirmation signals instead of rushing to catch the falling knife.
Do you think this price level for $BTC is an opportunity or a risk? Check the $BTC chart below! 👇
#BTC #Bitcoin #Crypto #PhanTich
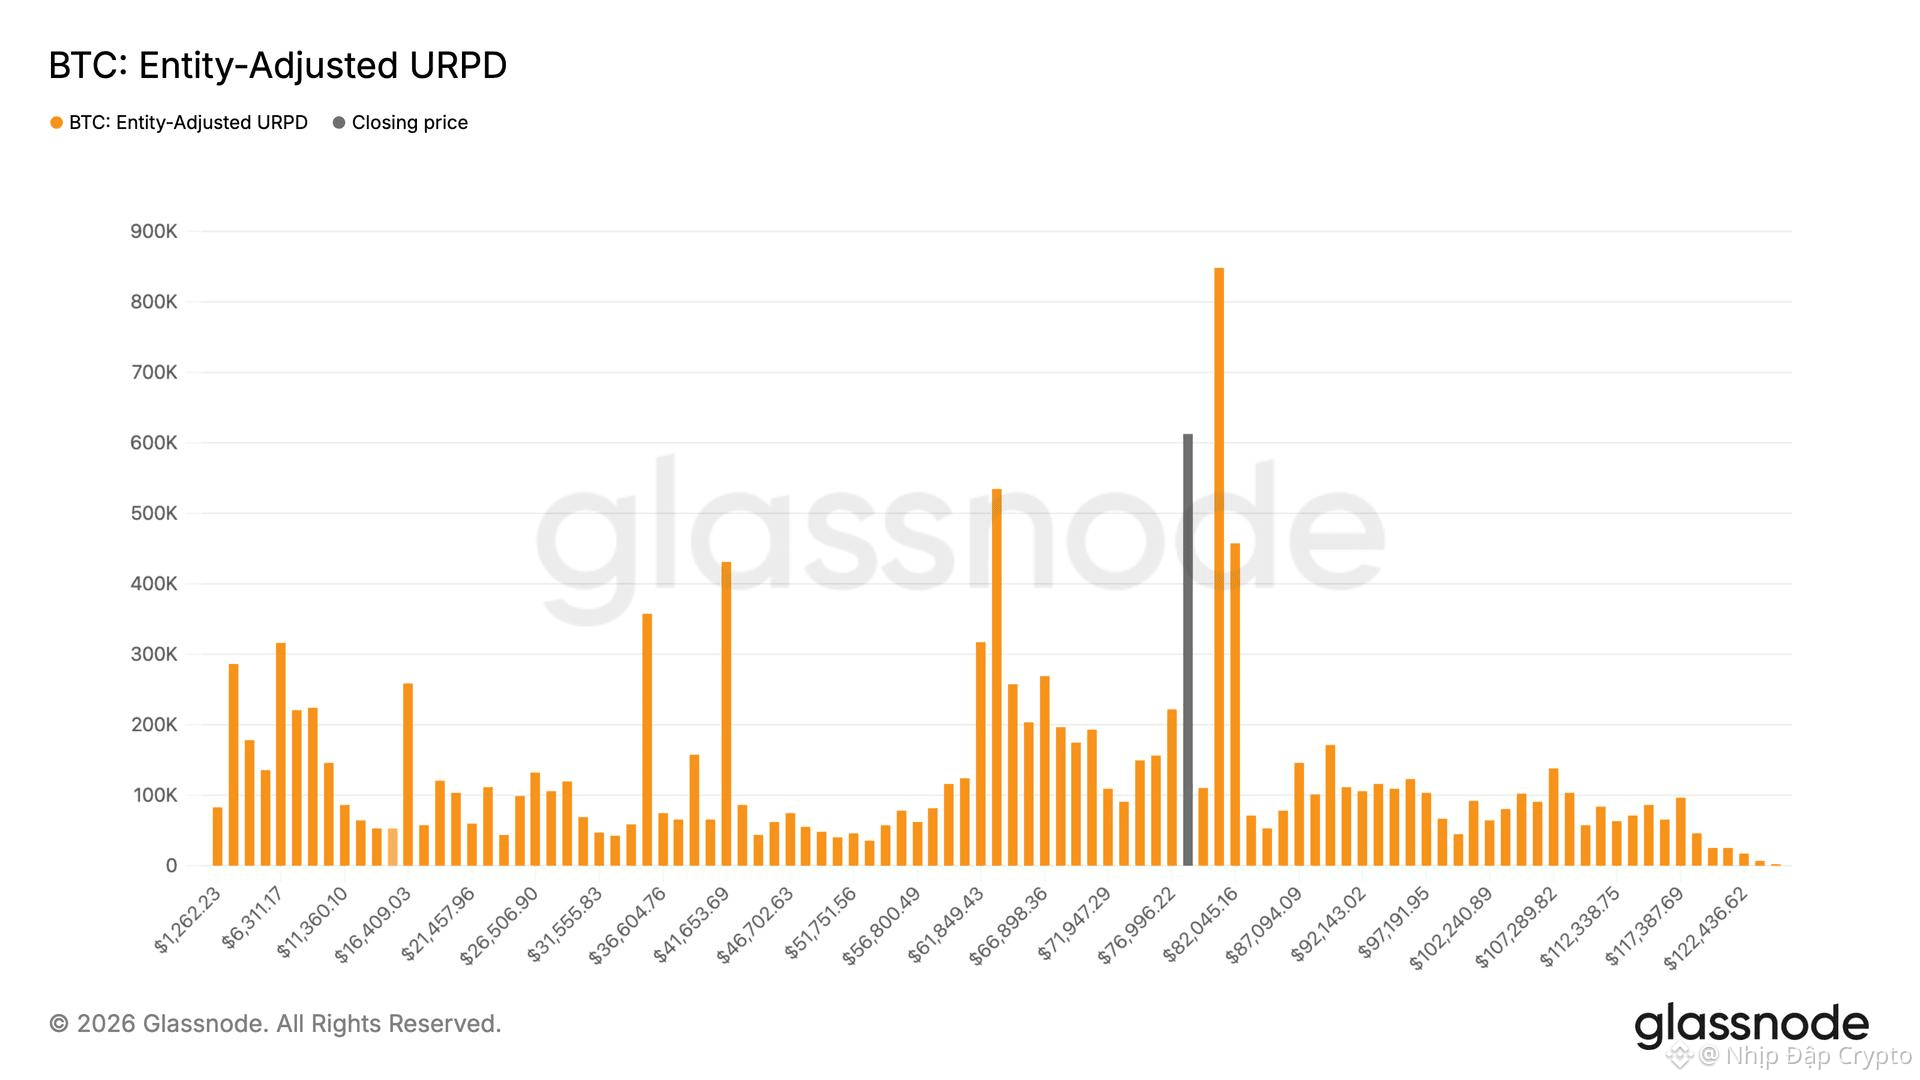
Will $BTC be able to swallow the entire massive 80,000 USD sell-off wall once large funds start breaking even?
The market is nearing the sensitive 80k level, with $BTC hovering around 79,716.1 USD. From a cash-flow perspective, this is not only technical resistance but a decisive battleground point for major institutions.
On-chain data shows that about 8% of the total supply $BTC (with the 80k mark alone accounting for up to 5%) has been accumulated in the 80,000–82,000 USD range—right at the average breakeven price level of Spot ETF funds in the US. When the price returns to the buy position, the institutional sentiment of exiting at breakeven will trigger a wave of massive selling to liquidate.
Despite ETF inflows being net positive for 8 consecutive days and macro conditions supporting liquidity, the upward momentum is still slowing as it approaches the 50-week MA (around 81,000 USD), amid retail traders’ skepticism.
In my opinion, this is the part where everyone should be patient and watch how the price responds instead of rushing to put money in.
Do you think this $BTC price level is an opportunity or a risk? Check the chart $BTC below! 👇
#BTC #Bitcoin #PhanTich #DauTu
The market is nearing the sensitive 80k level, with $BTC hovering around 79,716.1 USD. From a cash-flow perspective, this is not only technical resistance but a decisive battleground point for major institutions.
On-chain data shows that about 8% of the total supply $BTC (with the 80k mark alone accounting for up to 5%) has been accumulated in the 80,000–82,000 USD range—right at the average breakeven price level of Spot ETF funds in the US. When the price returns to the buy position, the institutional sentiment of exiting at breakeven will trigger a wave of massive selling to liquidate.
Despite ETF inflows being net positive for 8 consecutive days and macro conditions supporting liquidity, the upward momentum is still slowing as it approaches the 50-week MA (around 81,000 USD), amid retail traders’ skepticism.
In my opinion, this is the part where everyone should be patient and watch how the price responds instead of rushing to put money in.
Do you think this $BTC price level is an opportunity or a risk? Check the chart $BTC below! 👇
#BTC #Bitcoin #PhanTich #DauTu

$SHELL price shoots out of the lower Bollinger Band on the daily chart—an extremely oversold signal
On the daily timeframe, $SHELL is trading outside the lower Bollinger Band, a technical signal indicating that the sell-off has moved beyond the usual volatility range.
📊 Price position vs. daily Bollinger Bands:
⬇️ DN: 0.0186
💰 Current price: 0.0185 — lower than even the DN line
📊 Context:
🔴 Broke through the old support zone of 0.0193
📉 Down 2.63% in the last 24h
When price moves outside the lower Bollinger Band, it is often considered a sign of an extreme capitulation phase, where price volatility has exceeded two standard deviations from the moving average. Statistically, this is an area where price rarely stays for long without a corrective bounce or accumulation back within the band.
However, price being outside the Bollinger Band does not necessarily mean an immediate reversal. In strong downtrends, price may continue to hug or remain outside the lower band for some time before a genuine technical rebound appears.
#SHELL #PhanTich
On the daily timeframe, $SHELL is trading outside the lower Bollinger Band, a technical signal indicating that the sell-off has moved beyond the usual volatility range.
📊 Price position vs. daily Bollinger Bands:
⬇️ DN: 0.0186
💰 Current price: 0.0185 — lower than even the DN line
📊 Context:
🔴 Broke through the old support zone of 0.0193
📉 Down 2.63% in the last 24h
When price moves outside the lower Bollinger Band, it is often considered a sign of an extreme capitulation phase, where price volatility has exceeded two standard deviations from the moving average. Statistically, this is an area where price rarely stays for long without a corrective bounce or accumulation back within the band.
However, price being outside the Bollinger Band does not necessarily mean an immediate reversal. In strong downtrends, price may continue to hug or remain outside the lower band for some time before a genuine technical rebound appears.
#SHELL #PhanTich
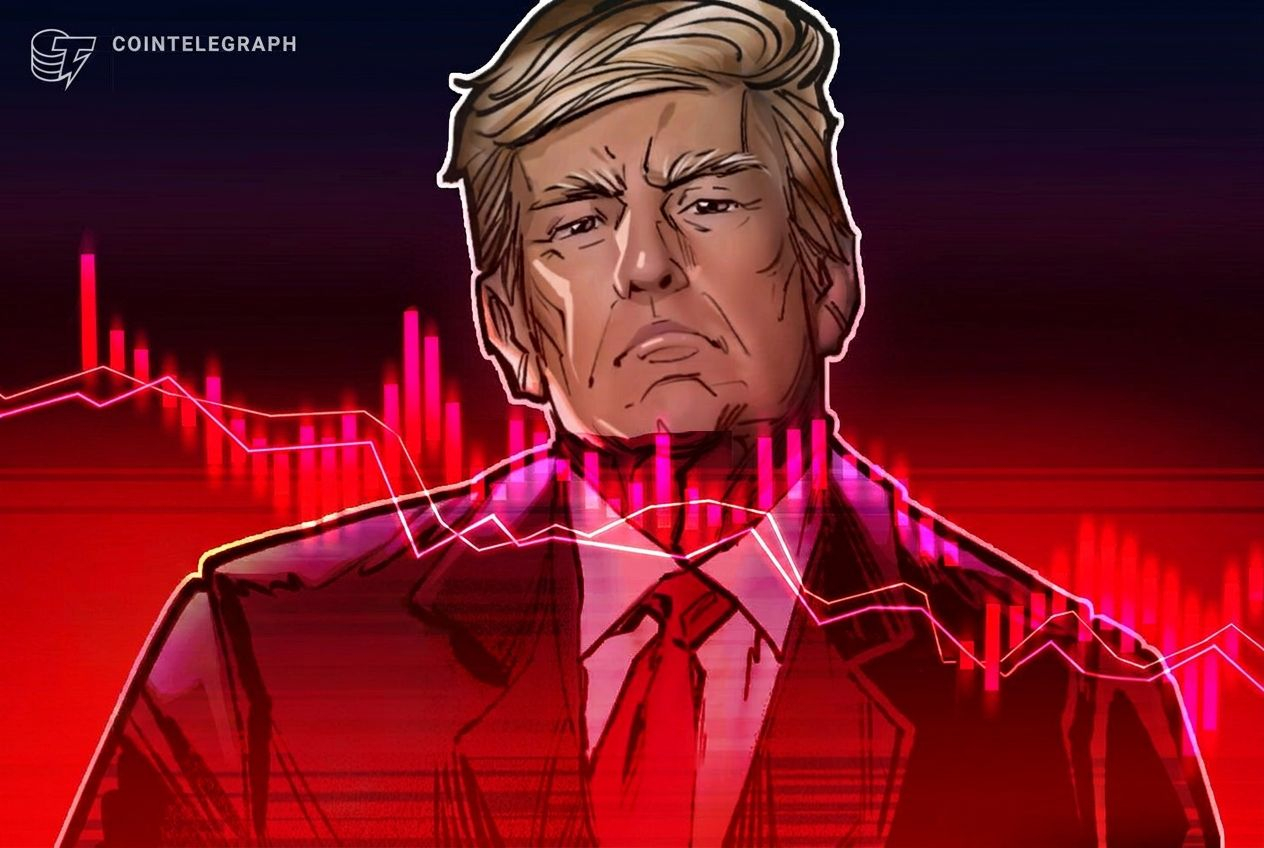
More than $3.8 billion has evaporated from the wallets of Trump memecoin investors, according to a new report from Nansen. Nearly 500,000 wallets are in profit, but the rest—millions of buyers who came later—are left holding the full loss. This is the classic scenario of political pump-and-dump cycles: insiders buy early, offload to those who arrive after. There’s no intrinsic value—only sentiment and FOMO.
Low liquidity on DEXs makes it even harder to exit when the price crashes. Participants in the late stages often end up wiped out because there’s no escape route.
The lesson I’ve learned after many years of trading: don’t chase the top of any speculative token just because of its name or a headline event. Always have a clear stop-loss plan and only play with money you’re willing to lose. DYOR—check on-chain data before entering a trade.
#Altcoin #PhanTich #ChinhTri #Memecoin #RuiRo
Low liquidity on DEXs makes it even harder to exit when the price crashes. Participants in the late stages often end up wiped out because there’s no escape route.
The lesson I’ve learned after many years of trading: don’t chase the top of any speculative token just because of its name or a headline event. Always have a clear stop-loss plan and only play with money you’re willing to lose. DYOR—check on-chain data before entering a trade.
#Altcoin #PhanTich #ChinhTri #Memecoin #RuiRo
Bitcoin has just ended June with a rare bearish Marubozu candle on the monthly chart. The price dropped 20% to below $60k, with a red candle body that is nearly without wicks.
For 30 days, the bears completely dominated, with no significant recovery. This is far from the usual down months that always show two-way volatility.
Smart money is withdrawing. U.S. spot ETFs recorded a record net outflow of $4.5 billion—matching the chart signal.
The Marubozu candle on the monthly timeframe is not a sign of a bottom. It warns that the downtrend may continue, with the deep support zone of $48k-$55k being mentioned by analysts.
Don’t predict the bottom. Just a reminder: every cycle has two directions. Buying cheaper doesn’t necessarily mean you’ll win if the trend hasn’t changed.
DYOR and risk management.
#BTC #Bitcoin #PhanTich #ThiTruong
For 30 days, the bears completely dominated, with no significant recovery. This is far from the usual down months that always show two-way volatility.
Smart money is withdrawing. U.S. spot ETFs recorded a record net outflow of $4.5 billion—matching the chart signal.
The Marubozu candle on the monthly timeframe is not a sign of a bottom. It warns that the downtrend may continue, with the deep support zone of $48k-$55k being mentioned by analysts.
Don’t predict the bottom. Just a reminder: every cycle has two directions. Buying cheaper doesn’t necessarily mean you’ll win if the trend hasn’t changed.
DYOR and risk management.
#BTC #Bitcoin #PhanTich #ThiTruong

Have you ever wondered why savings deposits keep losing value, while $BTC quietly holds steady at 78,026.9 USD at the time of writing?
The reason lies in "Financial Repression": when global public debt reaches its peak, central banks are forced to keep real interest rates negative to quietly reduce the debt. This pressure on the depreciation of fiat money has driven large capital flows into $BTC .
With a fixed supply of 21 million coins and support from ETF funds, institutional investment funds are viewing $BTC as a macro-hedging insurance channel rather than just a speculative asset.
My personal take right now: Even though the macro picture favors the long-term buyers, if you’re trading futures, you still need to stay extremely calm—avoid FOMO with heavy leverage in this zone, because the market is very prone to sweeping liquidity from both directions.
Do you think this price level of $BTC is an opportunity or a risk? Check the chart of $BTC below! 👇
#Bitcoin #BTC #PhanTich #DauTu
The reason lies in "Financial Repression": when global public debt reaches its peak, central banks are forced to keep real interest rates negative to quietly reduce the debt. This pressure on the depreciation of fiat money has driven large capital flows into $BTC .
With a fixed supply of 21 million coins and support from ETF funds, institutional investment funds are viewing $BTC as a macro-hedging insurance channel rather than just a speculative asset.
My personal take right now: Even though the macro picture favors the long-term buyers, if you’re trading futures, you still need to stay extremely calm—avoid FOMO with heavy leverage in this zone, because the market is very prone to sweeping liquidity from both directions.
Do you think this price level of $BTC is an opportunity or a risk? Check the chart of $BTC below! 👇
#Bitcoin #BTC #PhanTich #DauTu
MicroStrategy sells at a loss of 108 million USD for $BTC consecutive 2 weeks, yet the MSTR stock still holds steady—do you see the paradox?
In fact, this is most likely an optimization maneuver for taxes (tax-loss harvesting) combined with portfolio restructuring, not Saylor bailing out of the market. The 650 million USD MSTR share offering was also well absorbed by institutional funds.
Right now, $BTC is trading around 64.338 USD. The 64.000 USD support level is extremely sensitive: if it breaks, liquidation waves of leveraged positions are very likely to ignite.
My take: If you’re trading futures on this move, prioritize risk management, reduce leverage, and absolutely don’t FOMO and chase the price before a clear trend is confirmed.
In this zone, are you going LONG or SHORT on $BTC ? Tap $BTC below and let’s review the chart together! 👇
#BTC #Bitcoin #PhanTich #DauTu
In fact, this is most likely an optimization maneuver for taxes (tax-loss harvesting) combined with portfolio restructuring, not Saylor bailing out of the market. The 650 million USD MSTR share offering was also well absorbed by institutional funds.
Right now, $BTC is trading around 64.338 USD. The 64.000 USD support level is extremely sensitive: if it breaks, liquidation waves of leveraged positions are very likely to ignite.
My take: If you’re trading futures on this move, prioritize risk management, reduce leverage, and absolutely don’t FOMO and chase the price before a clear trend is confirmed.
In this zone, are you going LONG or SHORT on $BTC ? Tap $BTC below and let’s review the chart together! 👇
#BTC #Bitcoin #PhanTich #DauTu
$15.6 billion in buyback requests from private credit in Q2—three times the outflow from the Bitcoin ETF, nearly $5 billion. This is not just a crypto story.
The outflow of $4–5 billion from BTC ETF flows caused the price to drop 14% and extended a third-quarter losing streak. But the severity of liquidity stress in the $2 trillion private credit market is even more acute: in 10 out of 16 BDC funds, buybacks exceeded the 5% cap; many investors only received a portion and had to wait. Fitch expects this pressure to persist.
Combined with the fact that the U.S. strategic oil reserve is running low, the message is clear: financial and physical buffers are thinning. Bitcoin—sensitive to fluctuations in fiat liquidity—often reacts first, acting like an early warning bell.
My take: this is a warning about systemic risk rather than a standalone story about one asset. No panic, but managing positions and liquidity should be the priority. Do your own research and closely track macro data.
#BTC #PhanTich #DauTu #RuiRo
The outflow of $4–5 billion from BTC ETF flows caused the price to drop 14% and extended a third-quarter losing streak. But the severity of liquidity stress in the $2 trillion private credit market is even more acute: in 10 out of 16 BDC funds, buybacks exceeded the 5% cap; many investors only received a portion and had to wait. Fitch expects this pressure to persist.
Combined with the fact that the U.S. strategic oil reserve is running low, the message is clear: financial and physical buffers are thinning. Bitcoin—sensitive to fluctuations in fiat liquidity—often reacts first, acting like an early warning bell.
My take: this is a warning about systemic risk rather than a standalone story about one asset. No panic, but managing positions and liquidity should be the priority. Do your own research and closely track macro data.
#BTC #PhanTich #DauTu #RuiRo
75.7 million USD in Bitcoin ETF inflows for the second consecutive week sounds promising, but when looking at the overall picture, this recovery lacks momentum. The inflows are mainly concentrated in large funds like IBIT and FBTC, while smaller funds recorded net outflows—clearly indicating noticeable caution from institutional investors.
Both spot trading volume and open interest in futures declined, signaling weak speculative sentiment. With high interest rates and the Fed not yet easing, the market is “waiting”—waiting for March’s CPI, for the SEC’s action on the ETH ETF, or for the halving to have real effects.
With capital flows at only one-quarter of the average levels from earlier last year, the price of BTC could continue to trade sideways around the 65–67k range in the short term. Don’t rush into FOMO if there isn’t a strong enough catalyst. Risk management and doing your own research (DYOR) should be the top priority right now.
#BTC #DauTu #PhanTich #ThiTruong
Both spot trading volume and open interest in futures declined, signaling weak speculative sentiment. With high interest rates and the Fed not yet easing, the market is “waiting”—waiting for March’s CPI, for the SEC’s action on the ETH ETF, or for the halving to have real effects.
With capital flows at only one-quarter of the average levels from earlier last year, the price of BTC could continue to trade sideways around the 65–67k range in the short term. Don’t rush into FOMO if there isn’t a strong enough catalyst. Risk management and doing your own research (DYOR) should be the top priority right now.
#BTC #DauTu #PhanTich #ThiTruong

Korea’s Kospi index unexpectedly fell by 11% in a single session, immediately triggering a wave of sell-offs and pulling Bitcoin down by 2% to near the $63,300 level.
The dual pressure comes as traditional capital withdraws from risk assets, along with a dose of cold water from the U.S. Senate after they decided to temporarily postpone the Crypto Clarity Act. The delay keeps the legal framework unclear, causing AI- and Layer-1-sensitive altcoins such as FET or NEAR to drop sharply by 8% to 10%. At present, ETH is also struggling below the psychological $2,000 mark.
From my perspective, this pullback is a normal chain reaction when global financial markets shake. The real factor that will determine the next direction will be the Fed’s interest-rate decision this Wednesday.
This is not the time to rush to catch the bottom or use excessively high leverage. Preserving capital and observing how BTC reacts around key support zones matters far more than trying to guess the bottom peak. Be patient and always prioritize risk management.
#BTC #PhapLy #PhanTich #Crypto
The dual pressure comes as traditional capital withdraws from risk assets, along with a dose of cold water from the U.S. Senate after they decided to temporarily postpone the Crypto Clarity Act. The delay keeps the legal framework unclear, causing AI- and Layer-1-sensitive altcoins such as FET or NEAR to drop sharply by 8% to 10%. At present, ETH is also struggling below the psychological $2,000 mark.
From my perspective, this pullback is a normal chain reaction when global financial markets shake. The real factor that will determine the next direction will be the Fed’s interest-rate decision this Wednesday.
This is not the time to rush to catch the bottom or use excessively high leverage. Preserving capital and observing how BTC reacts around key support zones matters far more than trying to guess the bottom peak. Be patient and always prioritize risk management.
#BTC #PhapLy #PhanTich #Crypto
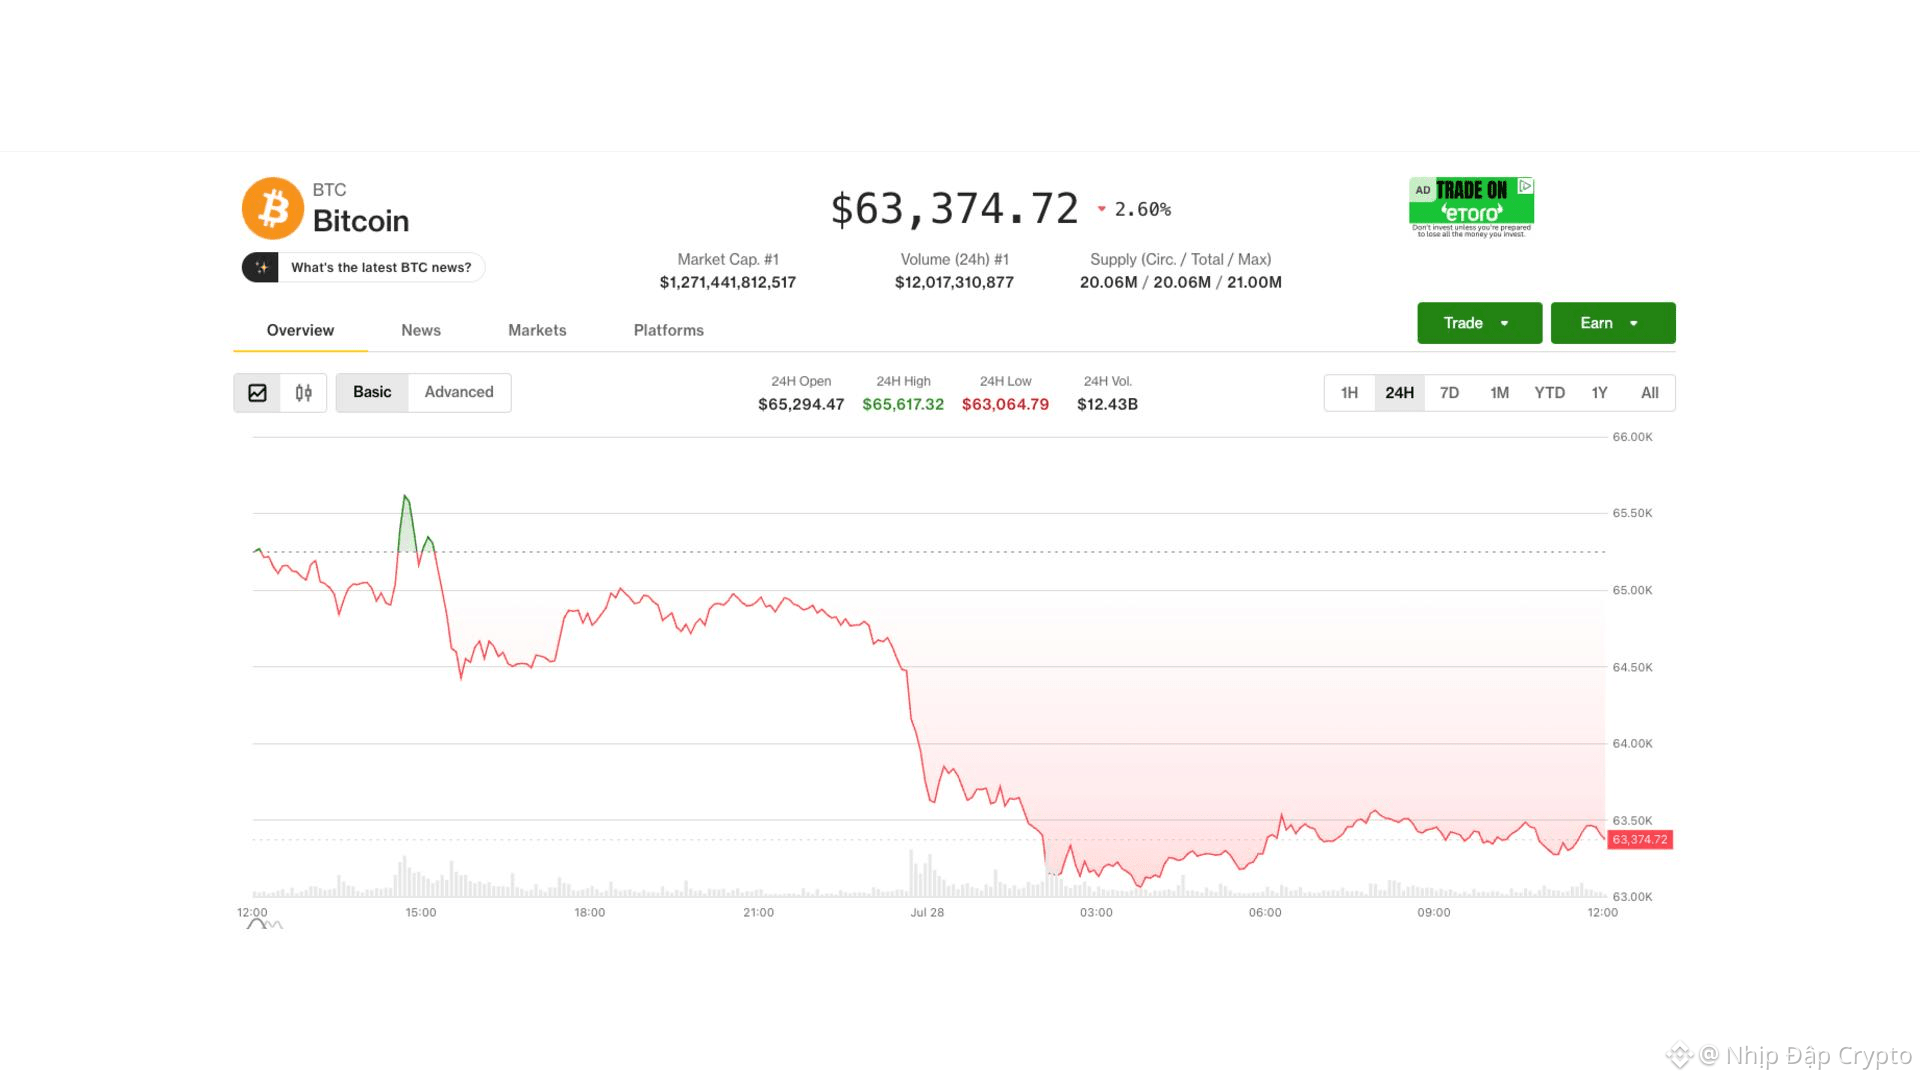
Bitcoin has just slipped below the $60,000 level amid the Japanese yen hitting a 40-year low versus the US dollar. The weakening yen not only lifts the greenback but also raises fears of a large-scale unwind of carry trades—something that previously caused major volatility across all risk assets, including crypto.
But the story doesn’t stop at the macro level. Strategy (MicroStrategy) has just approved a plan to raise $1.25 billion via its “treasury monetization” program—plainly, it could mean selling some Bitcoin. A notable shift from the perpetual HODL signal toward accepting selling when the market is weak. As expert Jeff Dorman notes, the issue is only being delayed, not resolved.
With both foreign inflows and the moves by major players putting pressure on the market, risk management is the top priority. Every decision should be based on real analysis, not driven by emotions.
#BTC #Bitcoin #PhanTich #ThiTruong
But the story doesn’t stop at the macro level. Strategy (MicroStrategy) has just approved a plan to raise $1.25 billion via its “treasury monetization” program—plainly, it could mean selling some Bitcoin. A notable shift from the perpetual HODL signal toward accepting selling when the market is weak. As expert Jeff Dorman notes, the issue is only being delayed, not resolved.
With both foreign inflows and the moves by major players putting pressure on the market, risk management is the top priority. Every decision should be based on real analysis, not driven by emotions.
#BTC #Bitcoin #PhanTich #ThiTruong

BTC-0.31%
MSTRUS-3.36%

💎 Notable: Has Bitcoin hit bottom yet?
According to experts from Grayscale, there are currently two conflicting schools of thought regarding Bitcoin’s cycle:
🔸 *The 4-year cycle theory*: Believes that the Halving event is the core driver. Historically, the bottom often appears about 2.5 years after Halving, meaning Bitcoin could fall further and only form a bottom in September or October.
🔸 *The macro impact theory*: Treats Bitcoin as a maturing asset, with price movements driven by interest rates and policies from the U.S. Federal Reserve (Fed).
*Why it matters?*
👉 Grayscale leans toward the macro view. If the Fed stops raising interest rates and the economy stabilizes, Bitcoin is likely to have already hit bottom.
👉 The shift in thinking from the “4-year cycle” to a “macro asset” suggests that Bitcoin is increasingly integrating with traditional financial markets.
👉 Explore a deeper perspective — Follow the Channel https://app.binance.com/uni-qr/cpro/Square-Creator-4a0f2008149d?l=en&r=BOZMO8A1
#Bitcoin #Grayscale #ThiTruongCrypto #PhanTich. $BTC
According to experts from Grayscale, there are currently two conflicting schools of thought regarding Bitcoin’s cycle:
🔸 *The 4-year cycle theory*: Believes that the Halving event is the core driver. Historically, the bottom often appears about 2.5 years after Halving, meaning Bitcoin could fall further and only form a bottom in September or October.
🔸 *The macro impact theory*: Treats Bitcoin as a maturing asset, with price movements driven by interest rates and policies from the U.S. Federal Reserve (Fed).
*Why it matters?*
👉 Grayscale leans toward the macro view. If the Fed stops raising interest rates and the economy stabilizes, Bitcoin is likely to have already hit bottom.
👉 The shift in thinking from the “4-year cycle” to a “macro asset” suggests that Bitcoin is increasingly integrating with traditional financial markets.
👉 Explore a deeper perspective — Follow the Channel https://app.binance.com/uni-qr/cpro/Square-Creator-4a0f2008149d?l=en&r=BOZMO8A1
#Bitcoin #Grayscale #ThiTruongCrypto #PhanTich. $BTC
Despite Strategy’s recent move to sell Bitcoin, Standard Chartered still maintains its year-end target of 100,000 USD. They describe this sell-off as merely "short-term noise"—a notable reassurance from a major bank.
Why are they optimistic? Spot ETF inflows remain strong; institutions like BlackRock continue to buy, while exchange supply is declining. Strategy’s selling size is actually very small compared with its total holdings, and the market has absorbed it well even as the price stays above 90k.
For traders, this is a reminder: don’t let short-term news disrupt your strategy. But also don’t be blind—track Strategy’s next move and manage your own risk. The 100k milestone is feasible, but nothing is certain. DYOR.
#BTC #Bitcoin #DauTu #PhanTich
Why are they optimistic? Spot ETF inflows remain strong; institutions like BlackRock continue to buy, while exchange supply is declining. Strategy’s selling size is actually very small compared with its total holdings, and the market has absorbed it well even as the price stays above 90k.
For traders, this is a reminder: don’t let short-term news disrupt your strategy. But also don’t be blind—track Strategy’s next move and manage your own risk. The 100k milestone is feasible, but nothing is certain. DYOR.
#BTC #Bitcoin #DauTu #PhanTich

A slow-acting bomb is hanging over the heads of U.S. traders as perpetual futures contracts (perps) face the risk of being taxed with ordinary income taxes instead of the current 60/40 tax treatment.
The latest warning from CME CEO Terry Duffy about the legal battle with the CFTC has exposed a worrying reality. The nature of perps, with their periodic funding-rate mechanism, makes them easily classifiable as swap contracts rather than futures contracts. If this happens, the IRS could tighten regulations and pursue back taxes, creating a major legal shock.
As a trader, I see this as not just a U.S. story. Any policy change here will directly affect capital flows and global liquidity in the derivatives sector. Leverage is not only about charts and candles—new policy risk is what can wipe out your position.
In a market full of variables, hedging accounts and strict risk management should always be top priorities. Always proactively research thoroughly before making any trading decisions.
#PhapLy #DauTu #PhanTich #CryptoFutures
The latest warning from CME CEO Terry Duffy about the legal battle with the CFTC has exposed a worrying reality. The nature of perps, with their periodic funding-rate mechanism, makes them easily classifiable as swap contracts rather than futures contracts. If this happens, the IRS could tighten regulations and pursue back taxes, creating a major legal shock.
As a trader, I see this as not just a U.S. story. Any policy change here will directly affect capital flows and global liquidity in the derivatives sector. Leverage is not only about charts and candles—new policy risk is what can wipe out your position.
In a market full of variables, hedging accounts and strict risk management should always be top priorities. Always proactively research thoroughly before making any trading decisions.
#PhapLy #DauTu #PhanTich #CryptoFutures

Bitcoin mining stocks integrated with AI are down 10–20% in just two weeks, and the story isn’t simple at all. Blocksbridge Consulting highlights a hot spot: large-scale insider selling combined with non-transparent governance, causing investors to lose confidence. Names like MARA, RIOT, and CLSK have faded much more sharply than the broader market.
What’s happening? Executives sell shares right when prices are high—possibly driven by personal liquidity needs, but the timing and volume are highly suspicious. On top of that, using GPUs for Bitcoin mining to switch into AI has no clear mechanism in place, making it hard for shareholders to assess performance. The previous run-up was driven largely by AI expectations, not sustainable mining.
For crypto traders, this is a reminder of the risks of speculation based on a narrative. Personally, I believe the pressure won’t stop if there’s no positive news from the upcoming earnings reports. DYOR and risk management come first.
#BTC #KhaiThacBitcoin #PhanTich #DauTu
What’s happening? Executives sell shares right when prices are high—possibly driven by personal liquidity needs, but the timing and volume are highly suspicious. On top of that, using GPUs for Bitcoin mining to switch into AI has no clear mechanism in place, making it hard for shareholders to assess performance. The previous run-up was driven largely by AI expectations, not sustainable mining.
For crypto traders, this is a reminder of the risks of speculation based on a narrative. Personally, I believe the pressure won’t stop if there’s no positive news from the upcoming earnings reports. DYOR and risk management come first.
#BTC #KhaiThacBitcoin #PhanTich #DauTu

More than 93% of the volume in the current crypto derivatives market comes from perpetual contracts (perps) — a figure that shows the Bitcoin pricing game has completely shifted away from the spot market.
Many still believe the spot order book determines price, but in reality, it’s the leveraged flows in the perps market that reflect information earliest. History shows that even when spot buying pressure weakens, the increase in perp positions is enough to trigger powerful rallies. This tool is so effective that SpaceX’s pre-IPO contracts even predict the listing value more accurately than Wall Street banks.
The key here is the funding rate. It’s not just the cost of maintaining a position, but the most direct measure of sentiment. When the funding rate is too high or too negative, that’s when the market is about to see major volatility that will liquidate overly stretched positions.
However, perps only reflect immediate demand and are highly vulnerable to sudden supply shocks. My view is to treat the funding rate as a momentum warning signal, but never forget leverage risk management. The derivatives market can lead trends, but it’s also where liquidity gets wiped out the most brutally.
#PhanTich #DauTu #BTC #Futures
Many still believe the spot order book determines price, but in reality, it’s the leveraged flows in the perps market that reflect information earliest. History shows that even when spot buying pressure weakens, the increase in perp positions is enough to trigger powerful rallies. This tool is so effective that SpaceX’s pre-IPO contracts even predict the listing value more accurately than Wall Street banks.
The key here is the funding rate. It’s not just the cost of maintaining a position, but the most direct measure of sentiment. When the funding rate is too high or too negative, that’s when the market is about to see major volatility that will liquidate overly stretched positions.
However, perps only reflect immediate demand and are highly vulnerable to sudden supply shocks. My view is to treat the funding rate as a momentum warning signal, but never forget leverage risk management. The derivatives market can lead trends, but it’s also where liquidity gets wiped out the most brutally.
#PhanTich #DauTu #BTC #Futures

An overhang of $4.4B in supply is weighing on Bitcoin. ETF outflows of 71,600 BTC this month — the largest selloff ever. Meanwhile, institutions are buying only 7,500 BTC. A gap of 77,000 BTC.
A telling figure: institutional demand is too weak to absorb supply from both ETFs and newly mined coins. Not to mention Strategy (MSTR) selling an additional potential $1.25B to pay dividends and interest on debt.
This is real selling pressure, not short-lived FUD. Any rally could be only temporary if large capital inflows have not returned. An adverse correlation with USD/JPY also breaks the carry-trade theory — macro noise.
The market is oversupplied. Don’t chase the top. Manage risk carefully, and only enter when there are clear signs that institutional demand has truly improved.
#BTC #Bitcoin #PhanTich #DauTu
A telling figure: institutional demand is too weak to absorb supply from both ETFs and newly mined coins. Not to mention Strategy (MSTR) selling an additional potential $1.25B to pay dividends and interest on debt.
This is real selling pressure, not short-lived FUD. Any rally could be only temporary if large capital inflows have not returned. An adverse correlation with USD/JPY also breaks the carry-trade theory — macro noise.
The market is oversupplied. Don’t chase the top. Manage risk carefully, and only enter when there are clear signs that institutional demand has truly improved.
#BTC #Bitcoin #PhanTich #DauTu
BTC-0.31%
MSTRUS-3.36%
The decision by the Bank of Japan (BOJ) to keep interest rates unchanged at 1% has eased pressure on Bitcoin, helping the price trend stay firmly anchored around the $64,000 level.
This decision means that capital flows from interest-rate differential trading (carry trade) in Japanese yen have not been tightened immediately. Although Governor Ueda has issued hawkish signals, the market appears to have priced in expectations of rate hikes in advance. As the pressure on the USD/JPY exchange rate cools down, liquidity continues to be injected into risk assets, preserving BTC’s uptrend structure.
Alongside BTC’s stability, BNB is also showing notable strength, rising 3.5% over the day and approaching the $591 zone.
In my view, the market’s good absorption of macro news is a positive sign. However, the $64,000 area still represents a major psychological resistance. Futures traders during this period should be patient, avoid FOMO in sensitive zones, and always put risk management first. Do your own thorough research before putting money down.
#BTC #BNB #CarryTrade #PhanTich
This decision means that capital flows from interest-rate differential trading (carry trade) in Japanese yen have not been tightened immediately. Although Governor Ueda has issued hawkish signals, the market appears to have priced in expectations of rate hikes in advance. As the pressure on the USD/JPY exchange rate cools down, liquidity continues to be injected into risk assets, preserving BTC’s uptrend structure.
Alongside BTC’s stability, BNB is also showing notable strength, rising 3.5% over the day and approaching the $591 zone.
In my view, the market’s good absorption of macro news is a positive sign. However, the $64,000 area still represents a major psychological resistance. Futures traders during this period should be patient, avoid FOMO in sensitive zones, and always put risk management first. Do your own thorough research before putting money down.
#BTC #BNB #CarryTrade #PhanTich

BTC at $61.8k, thought the buy-side would win. But options still point the other way. Put premium is still even higher than calls by 16% in terms of vol, despite having fallen from 25% last week. Traders don’t believe the rally has legs yet, still holding protective puts against risk.
The long-dated put-call skew is also around 10%. Ether is in the same situation. $221 million into the Bitcoin ETF ends a streak of outflows, but options signals say it can’t hibernate yet.
Notable: the ETH/BTC ratio is nearing the 100-day SMA. Since December, every time it has touched this level, it has failed. If this time it can break through, that would be the strongest signal for alt strength. If not, then it’s another stop-out sweep.
Weekend liquidity drops because the US is on holiday. Unusual volatility is likely. Manage risk.
#BTC #Ether #PhanTich #ThiTruong
The long-dated put-call skew is also around 10%. Ether is in the same situation. $221 million into the Bitcoin ETF ends a streak of outflows, but options signals say it can’t hibernate yet.
Notable: the ETH/BTC ratio is nearing the 100-day SMA. Since December, every time it has touched this level, it has failed. If this time it can break through, that would be the strongest signal for alt strength. If not, then it’s another stop-out sweep.
Weekend liquidity drops because the US is on holiday. Unusual volatility is likely. Manage risk.
#BTC #Ether #PhanTich #ThiTruong

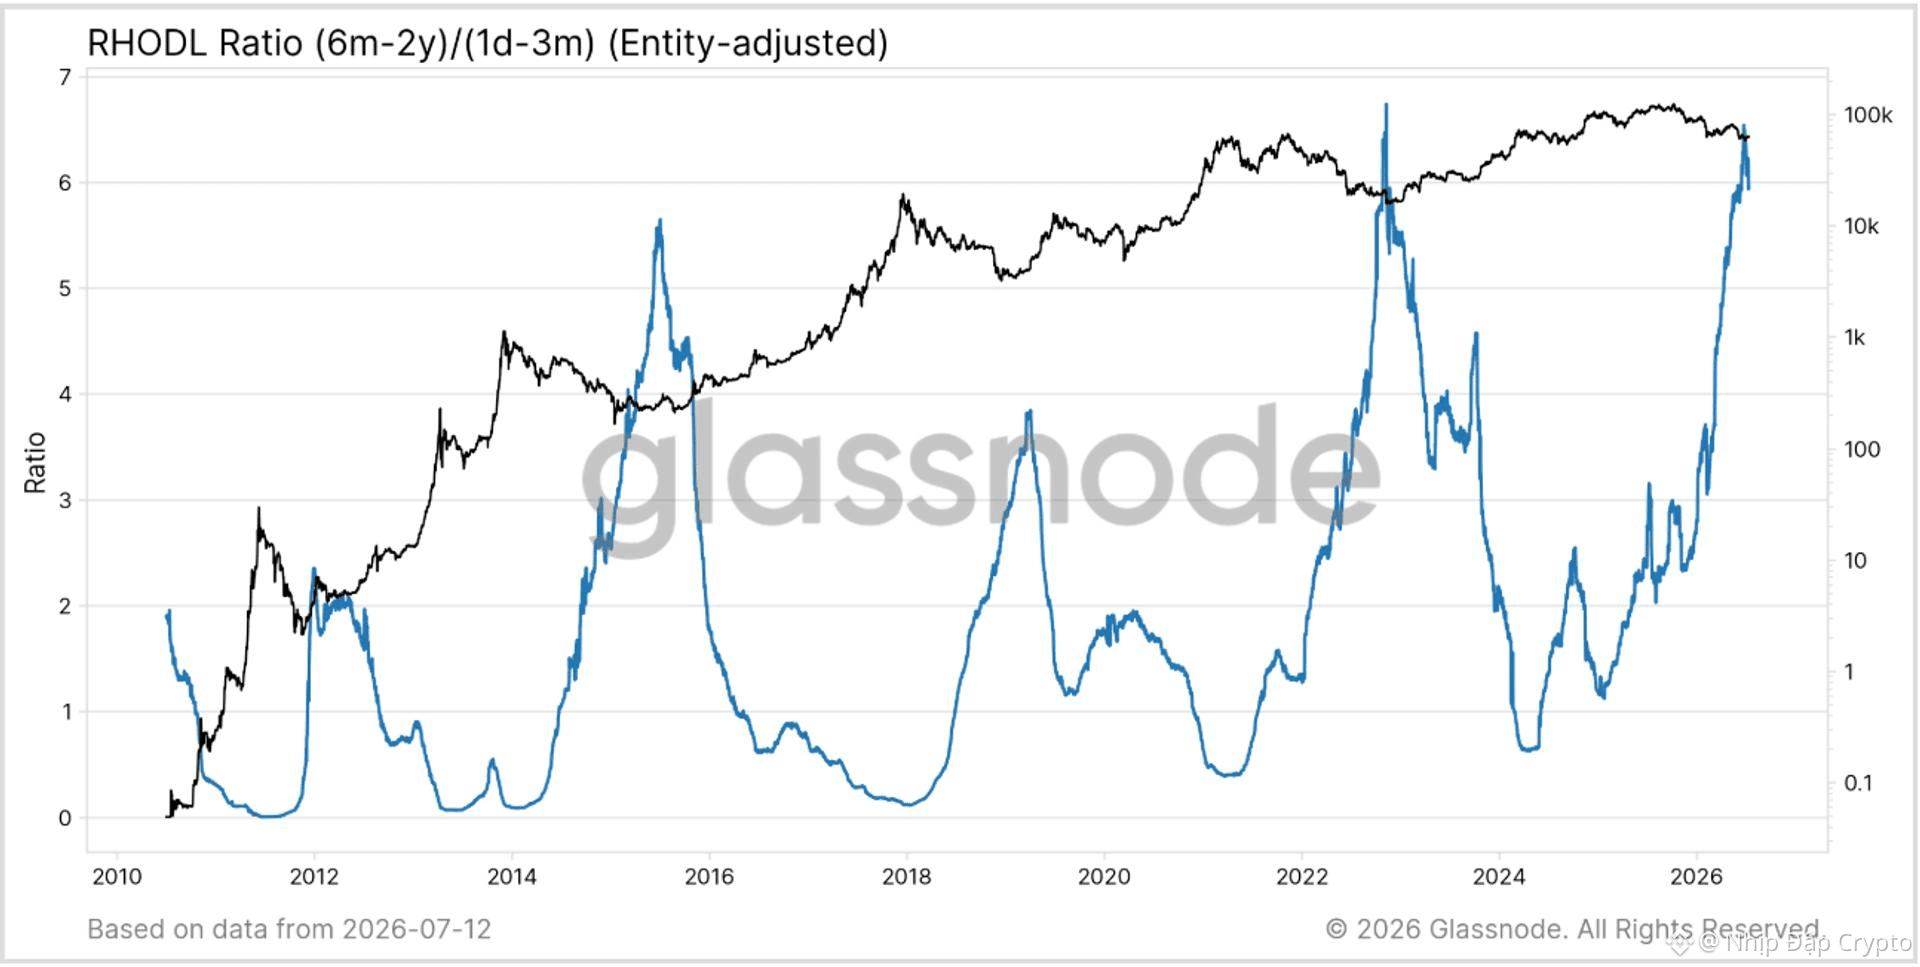
The RHODL Index just touched 6.5— the second-highest level in history—yet Bitcoin is still moving sideways at $62,000 after 5 months. What does that say?
Supply is quietly shifting from long-term holders—those who accumulated in 2023–2024—to a new generation that views the current price zone as a discounted opportunity. This is the essence of the Wyckoff distribution phase: whales dump to buyers who are too eager.
But unlike 2022, this compression is happening quietly, without panic. History shows that RHODL compression phases near the bottoms of 2015, 2019, and 2023 have often preceded a breakout afterward.
However, the Fed is still the biggest unknown. The market is pricing in a 50-basis-point increase over the next 6 months—if that happens, a capitulation wave could be triggered. Is this just accumulation for the next bull run, or a trap before a macro headwind?
My take: this phase requires more discipline than ever. Don’t FOMO when RHODL compresses, and don’t panic-sell out of fear. Set a clear timeframe and enforce tight risk management—whales always look for ways to shake out the weak before a real bottom forms. DYOR.
#BTC #Bitcoin #PhanTich #DauTu
Supply is quietly shifting from long-term holders—those who accumulated in 2023–2024—to a new generation that views the current price zone as a discounted opportunity. This is the essence of the Wyckoff distribution phase: whales dump to buyers who are too eager.
But unlike 2022, this compression is happening quietly, without panic. History shows that RHODL compression phases near the bottoms of 2015, 2019, and 2023 have often preceded a breakout afterward.
However, the Fed is still the biggest unknown. The market is pricing in a 50-basis-point increase over the next 6 months—if that happens, a capitulation wave could be triggered. Is this just accumulation for the next bull run, or a trap before a macro headwind?
My take: this phase requires more discipline than ever. Don’t FOMO when RHODL compresses, and don’t panic-sell out of fear. Set a clear timeframe and enforce tight risk management—whales always look for ways to shake out the weak before a real bottom forms. DYOR.
#BTC #Bitcoin #PhanTich #DauTu
Log in to explore more content