
#tradesetup
tradesetup
4.4M views
35,362 Discussing
Hot
Latest

·
--
Bearish
A 300% pump in 24 hours? Gravity always wins, and the trap is set on $JCT ! 🐻
Do not buy this top. Here is my exact Short setup to ride the inevitable bloodbath. 👇
🔴 Short Setup
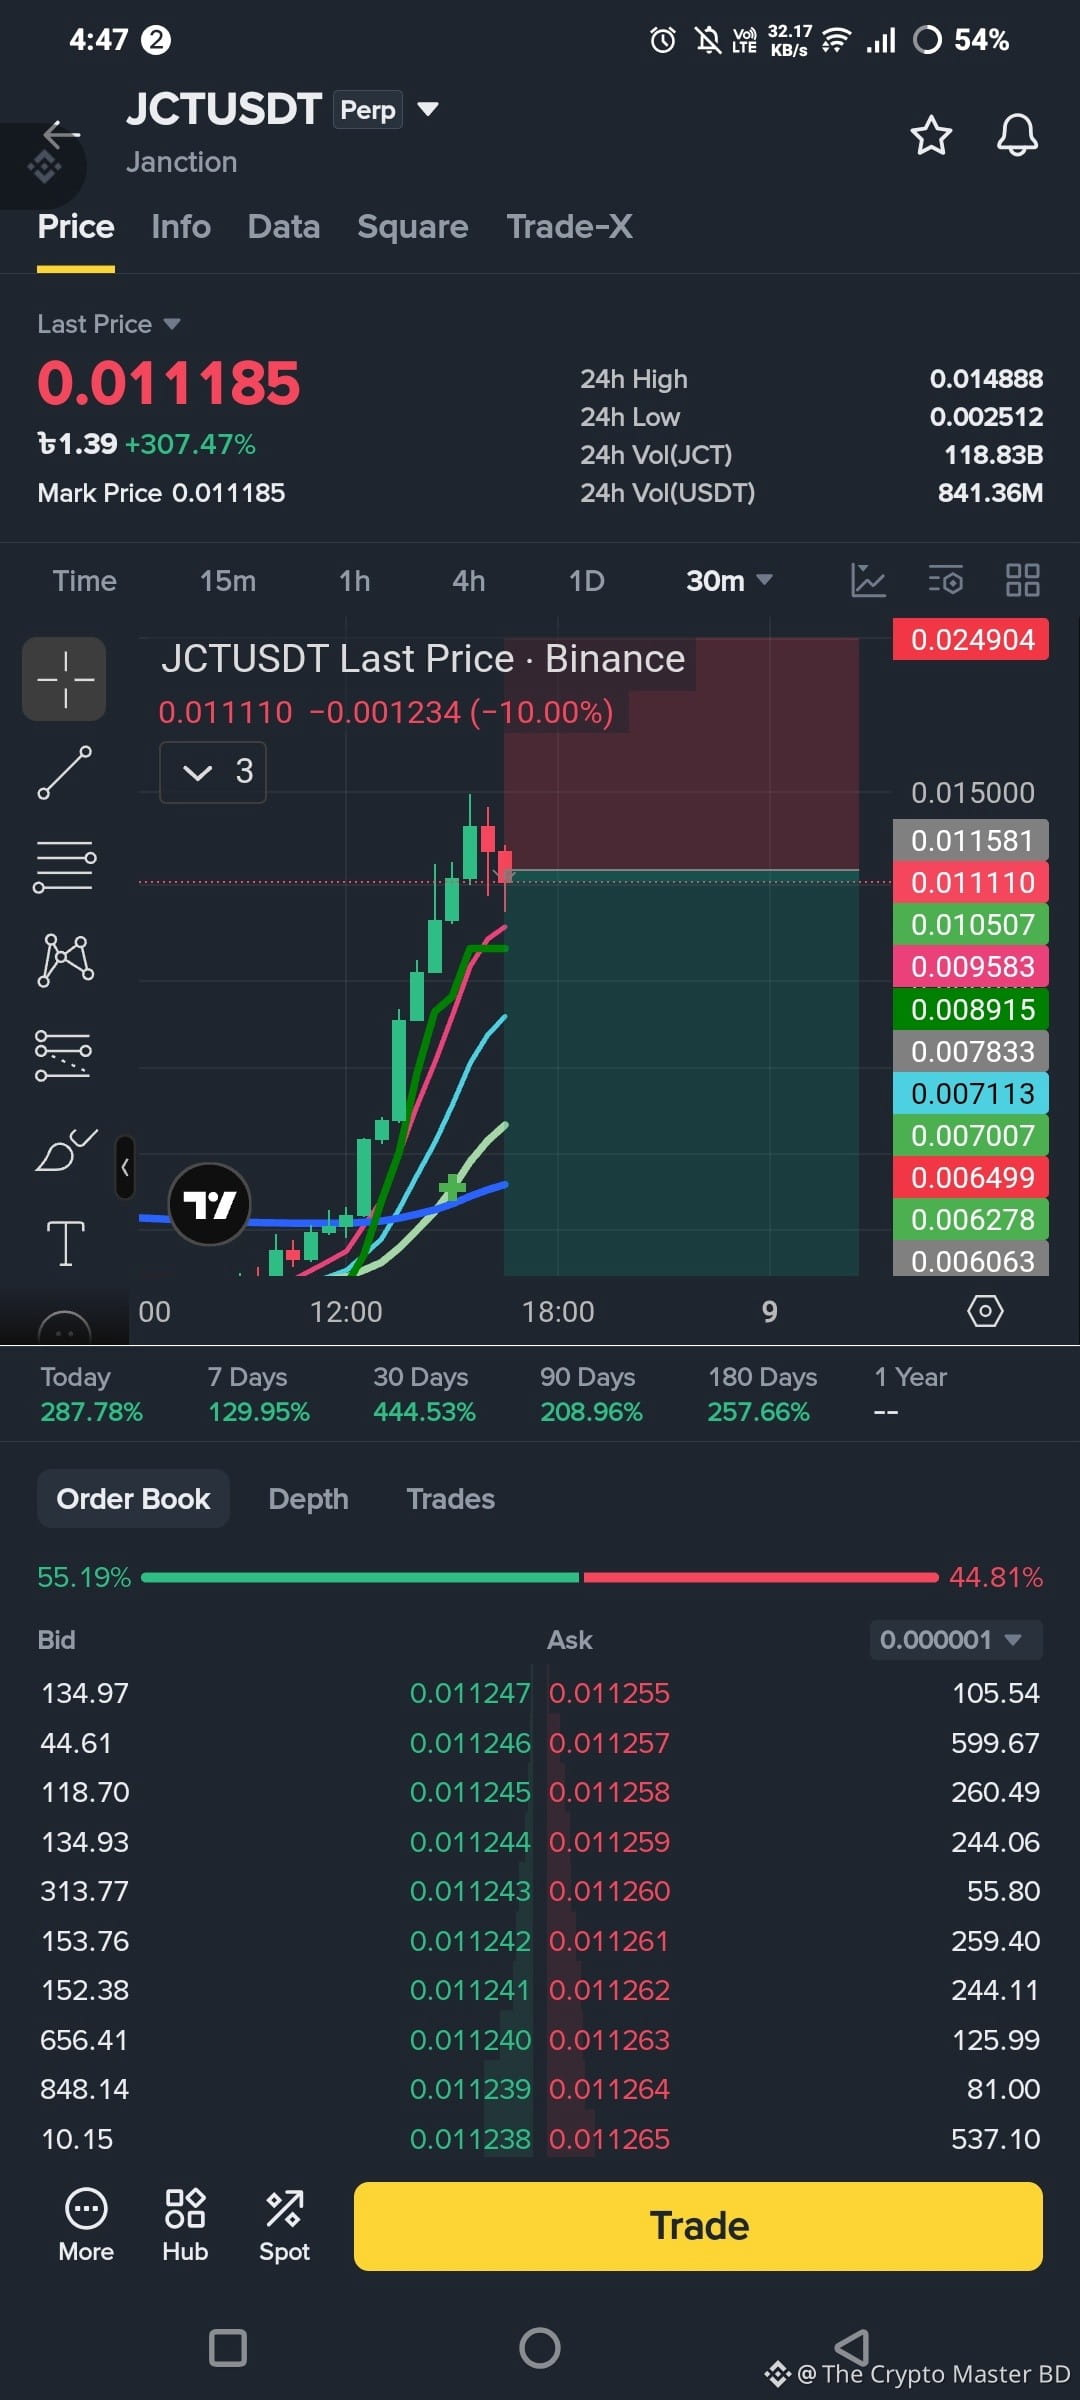
📌 Entry → $0.011600
🎯 TP1 → $0.009000 (-22.4%)
🎯 TP2 → $0.006000 (-48.2%)
✅ Final Target → $0.002000 (-82.7%)
⛔ SL → $0.020000 (+63.7%)
🙇 Plan: Once TP1 hits, close 50% of your position and move the Stop Loss straight to entry. The rest runs risk-free!
💪 Why I'm taking this: Look at the chart. JCT went absolutely parabolic, pumping over 300% to hit $0.014888. But the music has stopped. The 30m chart just printed a massive red rejection candle, dropping 10% instantly. When a low-cap coin pumps this hard, it's a classic liquidity trap. Retail gets greedy, and smart money dumps on them. The order book is already showing weakness, and the path of least resistance is now down.
⚠️ One thing to respect: Shorting a freshly pumped coin is extremely dangerous. The volatility is insane. If the bulls somehow push it back above $0.019000, the bears are dead. Use strict risk management and ALWAYS respect the stop loss!
$JCT #CryptoTrading #tradesetup
{future}(JCTUSDT)
A 300% pump in 24 hours? Gravity always wins, and the trap is set on $JCT ! 🐻
Do not buy this top. Here is my exact Short setup to ride the inevitable bloodbath. 👇
🔴 Short Setup
📌 Entry → $0.011600
🎯 TP1 → $0.009000 (-22.4%)
🎯 TP2 → $0.006000 (-48.2%)
✅ Final Target → $0.002000 (-82.7%)
⛔ SL → $0.020000 (+63.7%)
🙇 Plan: Once TP1 hits, close 50% of your position and move the Stop Loss straight to entry. The rest runs risk-free!
💪 Why I'm taking this: Look at the chart. JCT went absolutely parabolic, pumping over 300% to hit $0.014888. But the music has stopped. The 30m chart just printed a massive red rejection candle, dropping 10% instantly. When a low-cap coin pumps this hard, it's a classic liquidity trap. Retail gets greedy, and smart money dumps on them. The order book is already showing weakness, and the path of least resistance is now down.
⚠️ One thing to respect: Shorting a freshly pumped coin is extremely dangerous. The volatility is insane. If the bulls somehow push it back above $0.019000, the bears are dead. Use strict risk management and ALWAYS respect the stop loss!
$JCT #CryptoTrading #tradesetup
Do not buy this top. Here is my exact Short setup to ride the inevitable bloodbath. 👇
🔴 Short Setup
📌 Entry → $0.011600
🎯 TP1 → $0.009000 (-22.4%)
🎯 TP2 → $0.006000 (-48.2%)
✅ Final Target → $0.002000 (-82.7%)
⛔ SL → $0.020000 (+63.7%)
🙇 Plan: Once TP1 hits, close 50% of your position and move the Stop Loss straight to entry. The rest runs risk-free!
💪 Why I'm taking this: Look at the chart. JCT went absolutely parabolic, pumping over 300% to hit $0.014888. But the music has stopped. The 30m chart just printed a massive red rejection candle, dropping 10% instantly. When a low-cap coin pumps this hard, it's a classic liquidity trap. Retail gets greedy, and smart money dumps on them. The order book is already showing weakness, and the path of least resistance is now down.
⚠️ One thing to respect: Shorting a freshly pumped coin is extremely dangerous. The volatility is insane. If the bulls somehow push it back above $0.019000, the bears are dead. Use strict risk management and ALWAYS respect the stop loss!
$JCT #CryptoTrading #tradesetup
CreepTo_Tiger:
Ojala nadie haya puesto ese SL…
10
1
1
1.4k

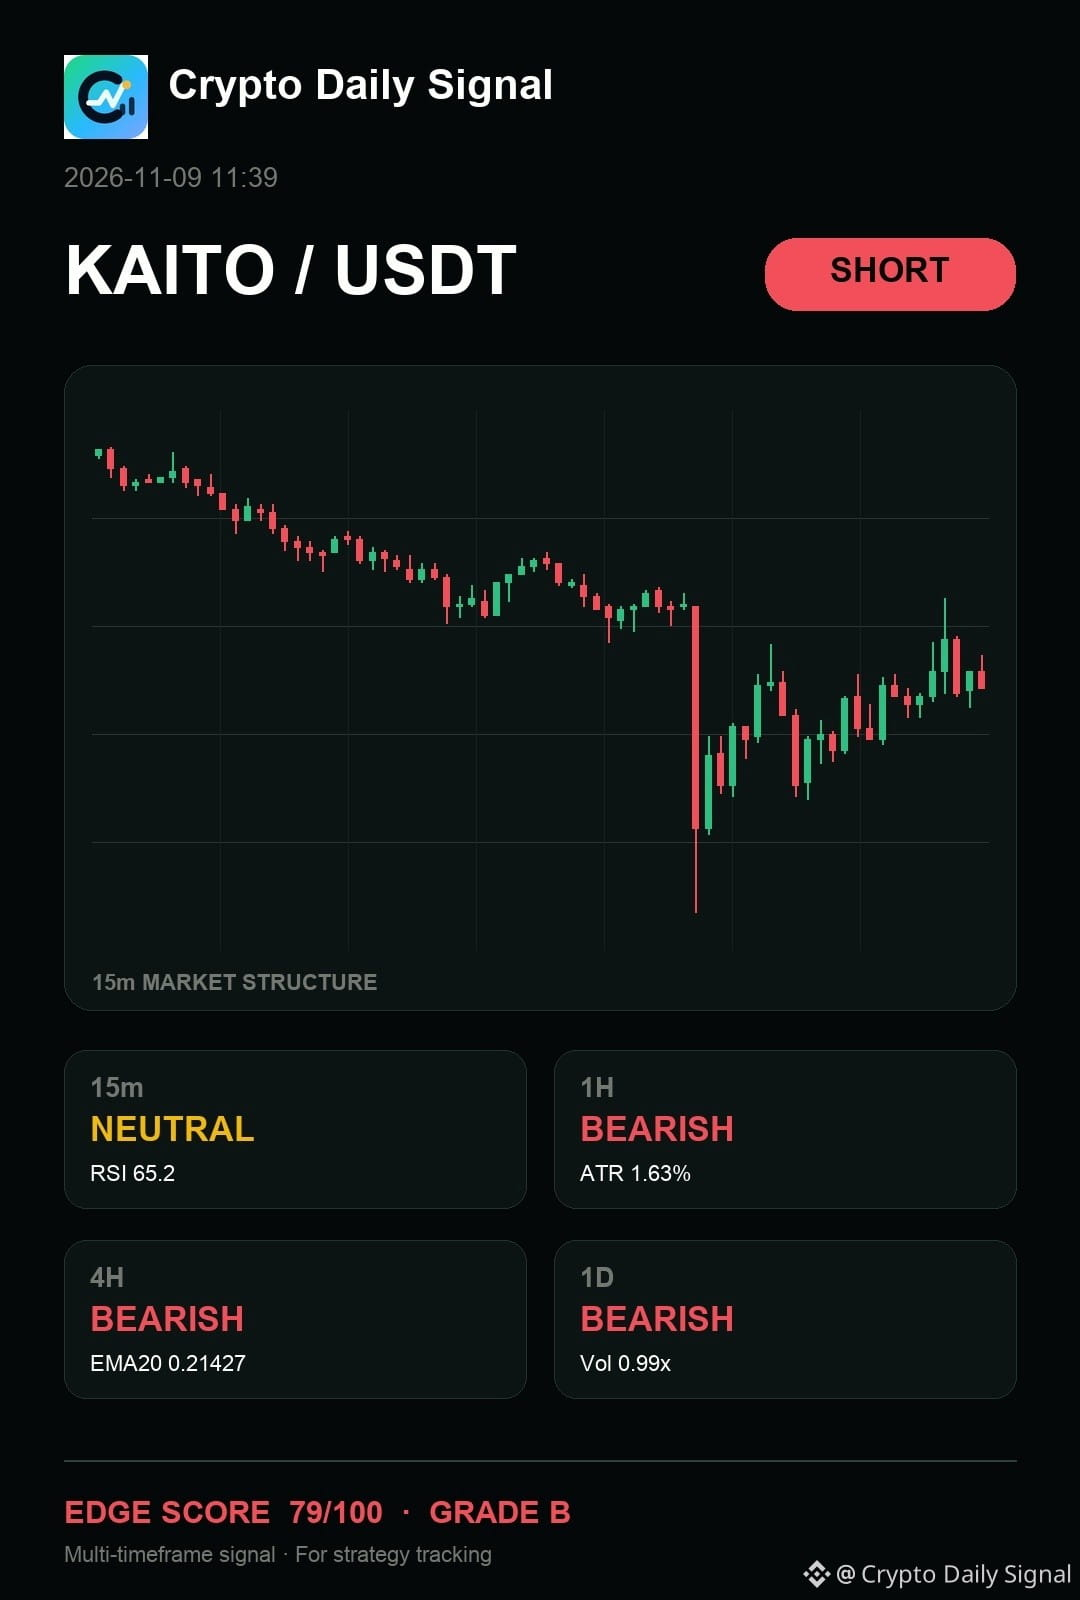
$KAITO — for me, the core read is that it remains a short watch for me because the recent price action paints a clear bearish picture on the higher timeframes. The candles are forming lower highs, which suggests selling pressure is currently in control below the descending trendline. A break below immediate support would confirm the downside move, though a strong rally above the recent swing high would signal a shift.
Levels — KAITOUSDT
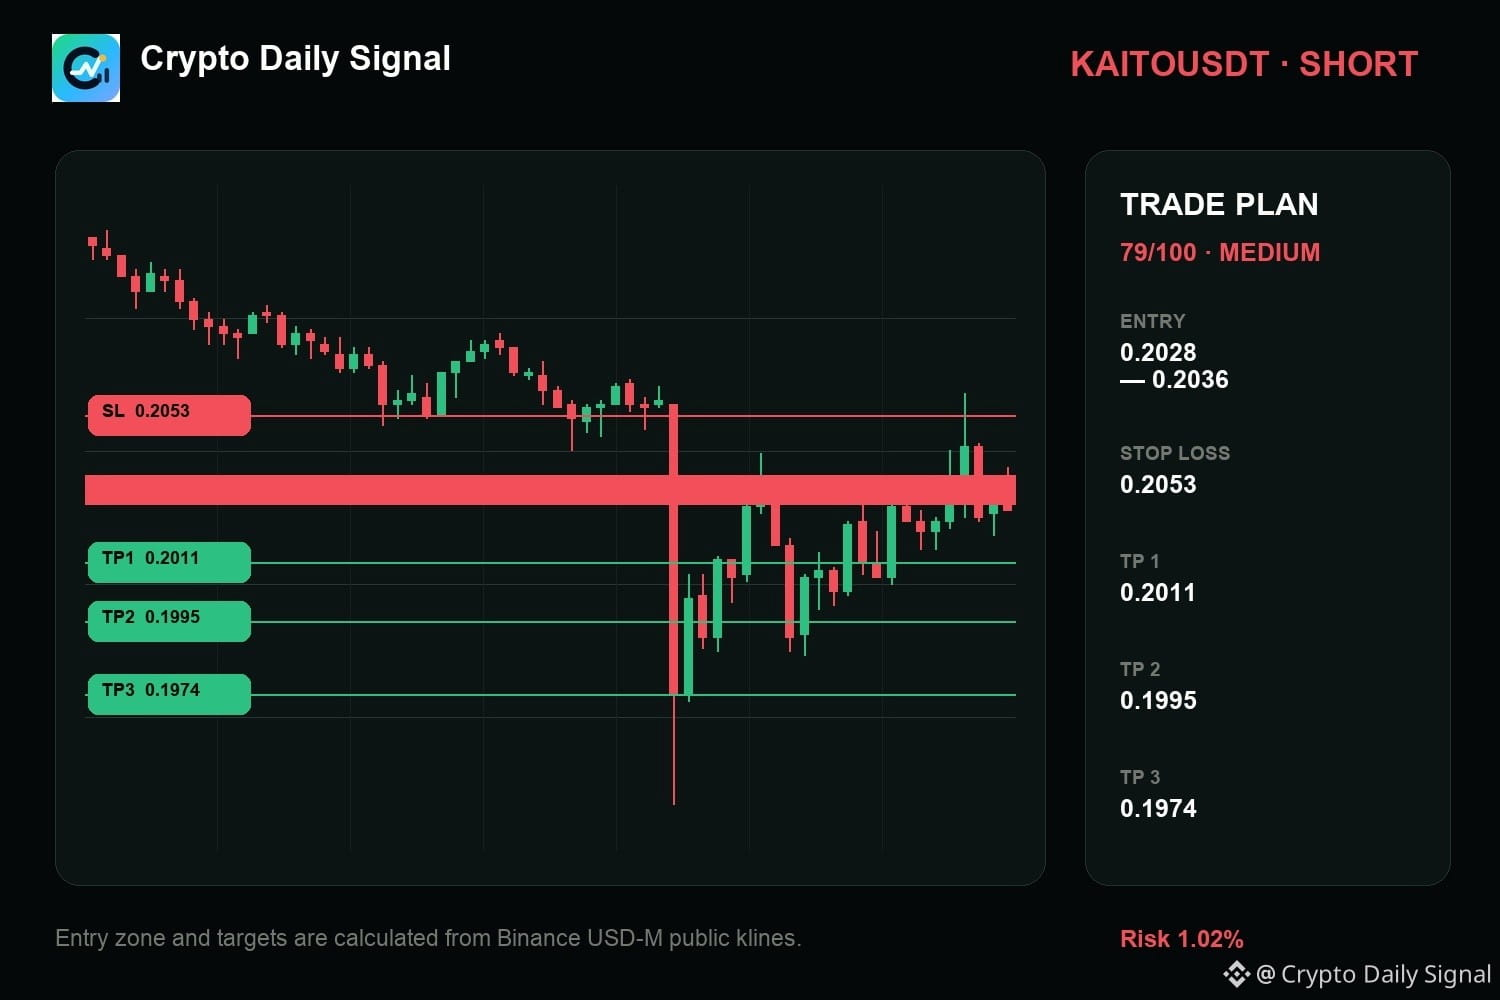
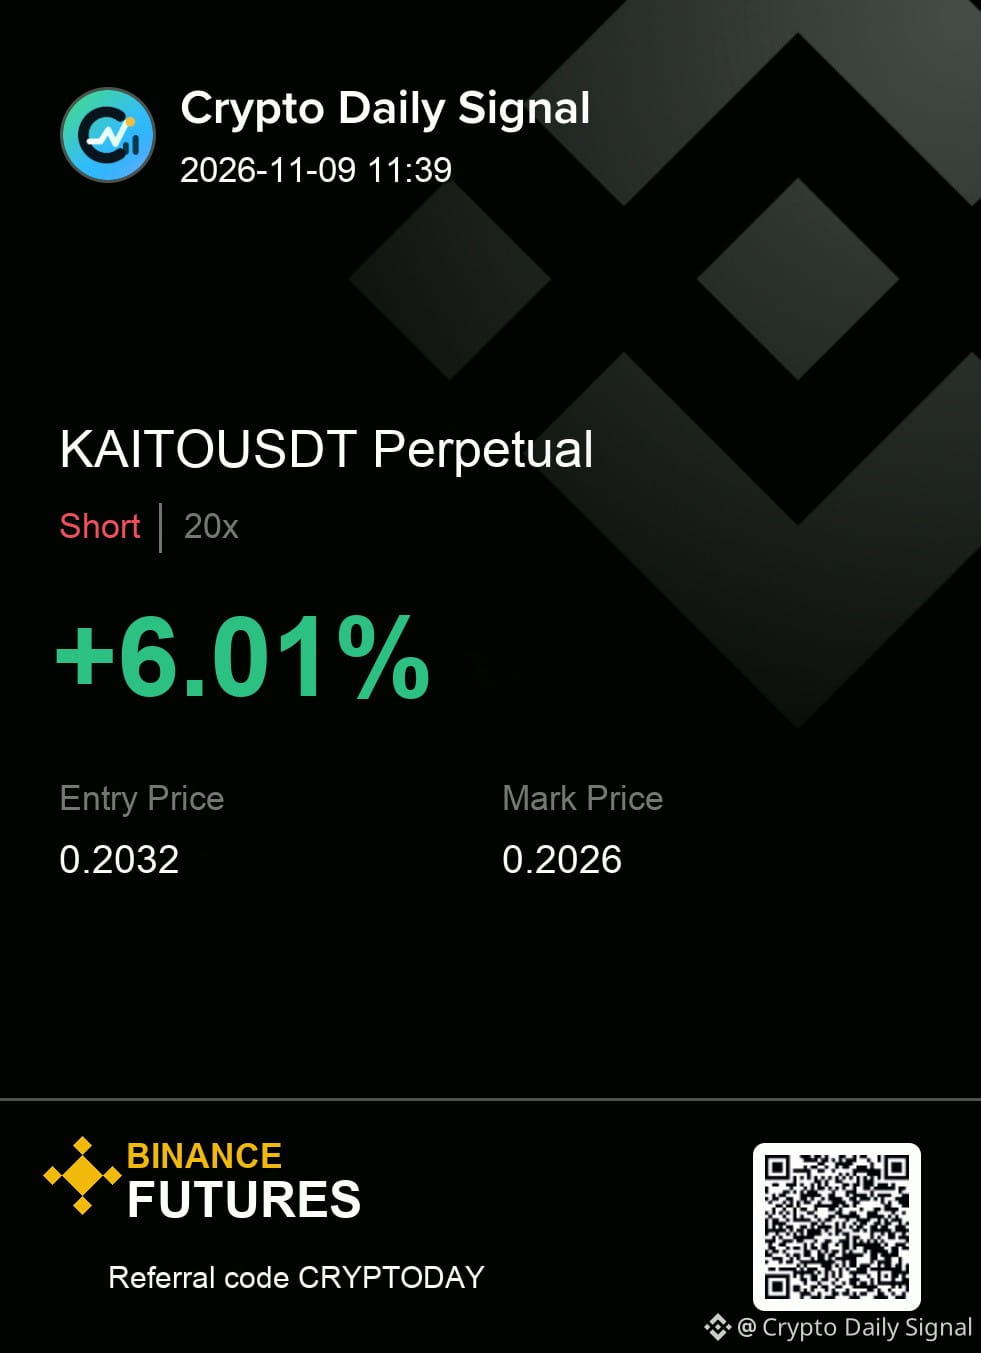
Zone: 0.2028 - 0.2036
Cut: 0.2053
Scale: 0.2011 | 0.1995 | 0.1974
Would you take it here, or wait for one more confirmation candle?
#TradeSetup
{future}(KAITOUSDT)
$KAITO — for me, the core read is that it remains a short watch for me because the recent price action paints a clear bearish picture on the higher timeframes. The candles are forming lower highs, which suggests selling pressure is currently in control below the descending trendline. A break below immediate support would confirm the downside move, though a strong rally above the recent swing high would signal a shift.
Levels — KAITOUSDT
Zone: 0.2028 - 0.2036
Cut: 0.2053
Scale: 0.2011 | 0.1995 | 0.1974
Would you take it here, or wait for one more confirmation candle?
#TradeSetup
Levels — KAITOUSDT
Zone: 0.2028 - 0.2036
Cut: 0.2053
Scale: 0.2011 | 0.1995 | 0.1974
Would you take it here, or wait for one more confirmation candle?
#TradeSetup
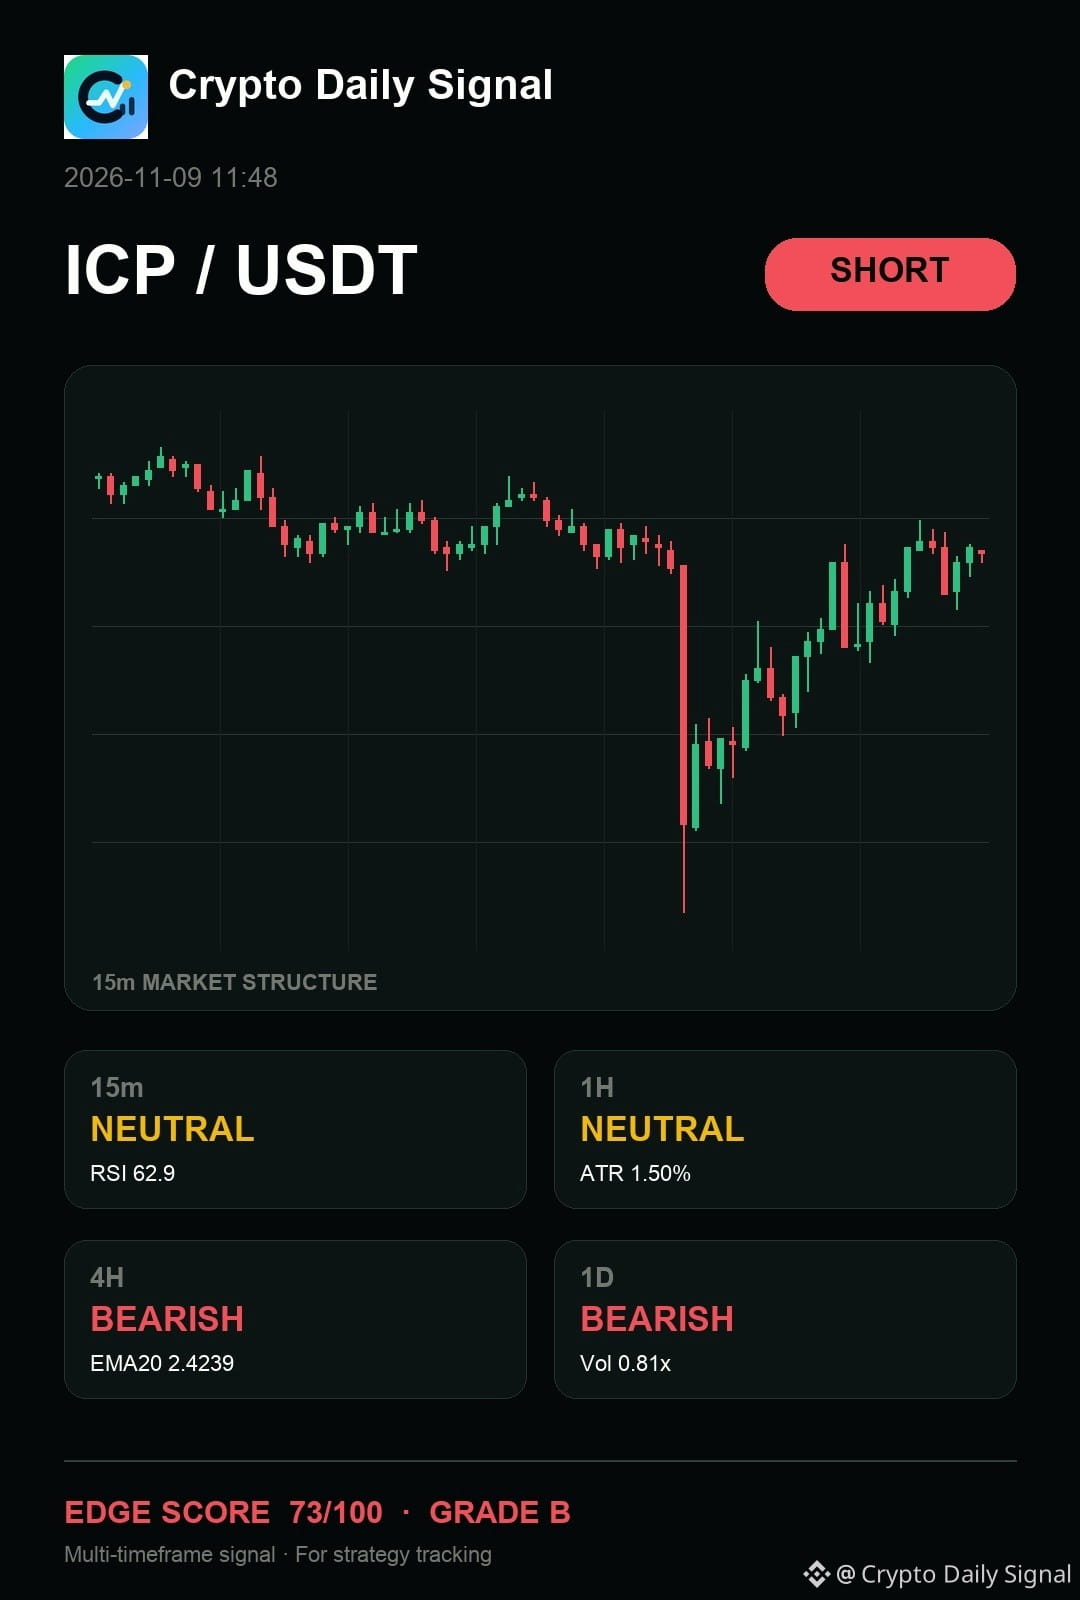
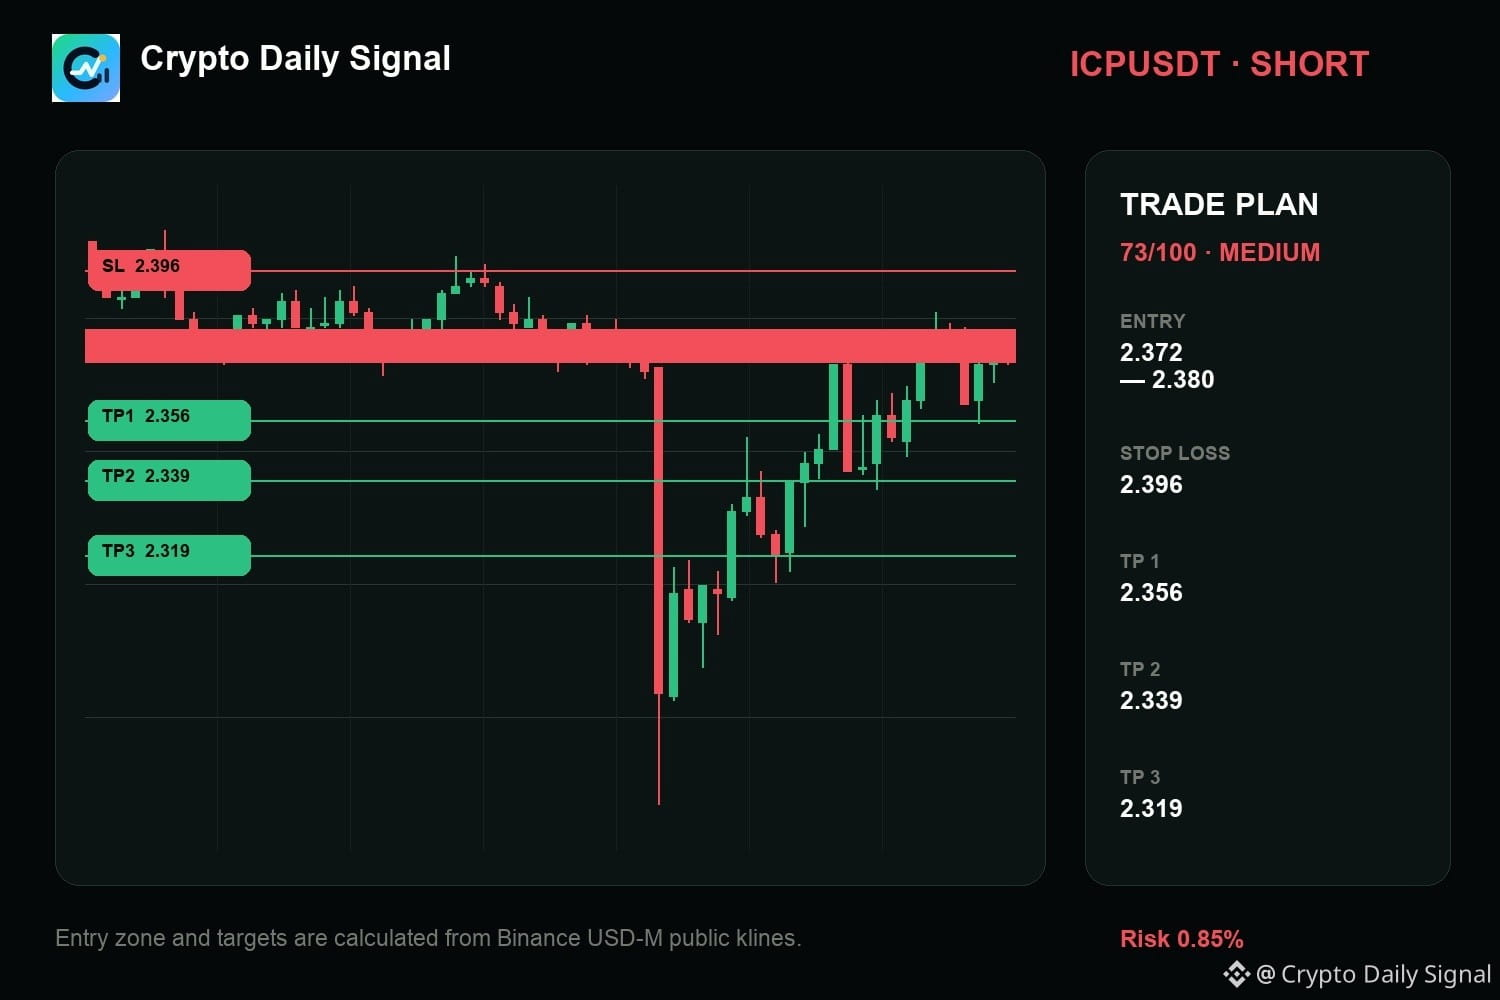
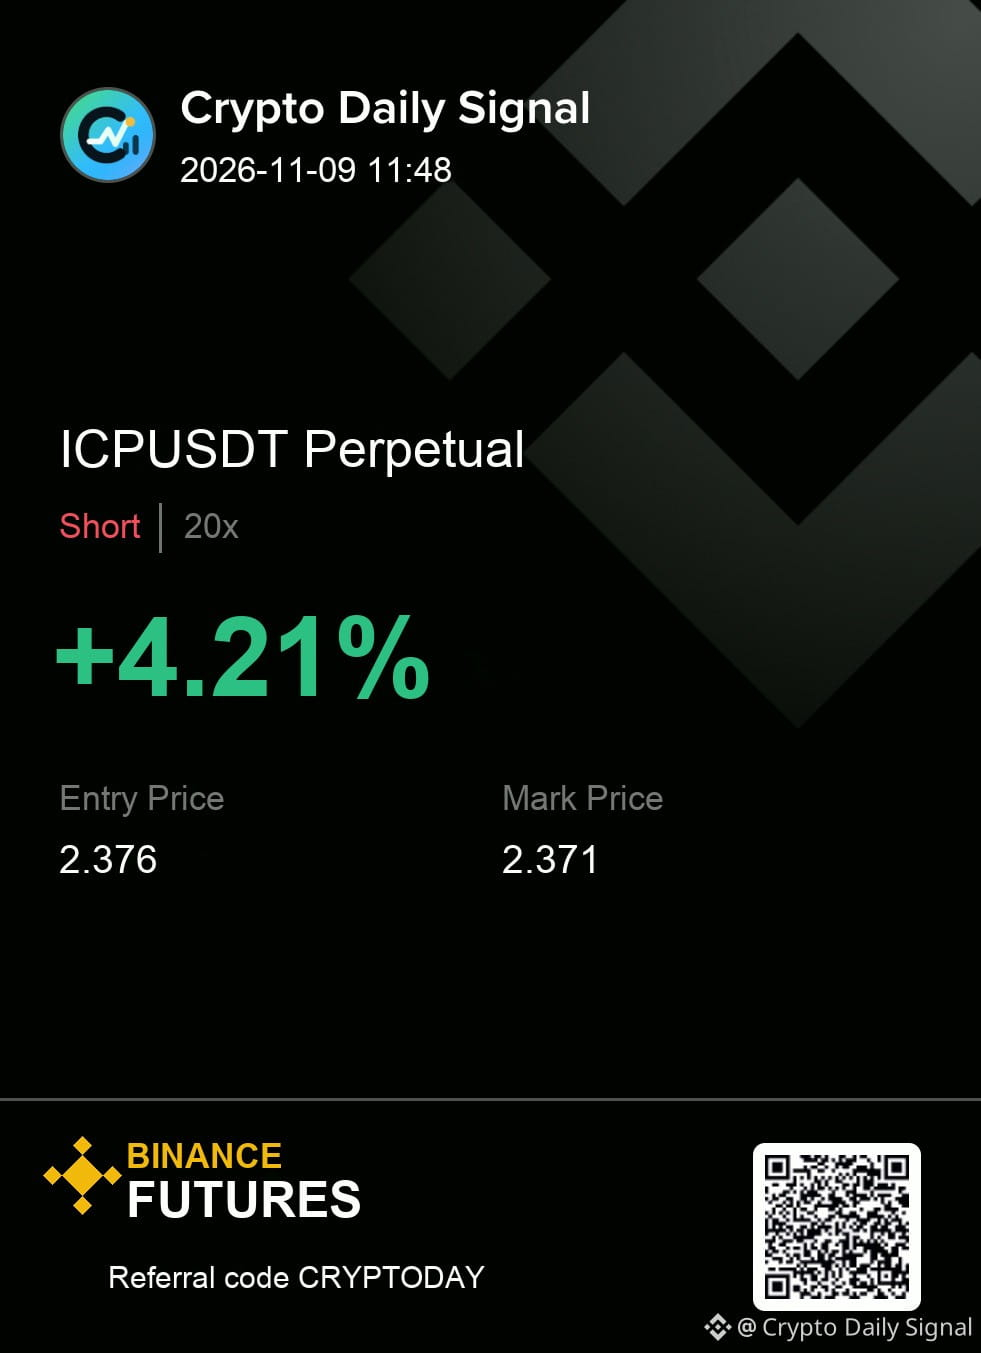
$ICP — ngl, the cleanest read is that it still gives sellers the cleaner argument as the current price stays near the bottom of its recent range. Bearish signals are showing up on the daily and four-hour charts, even though the short-term movement lacks real force. For this downside to play out, we need a clear break below that range floor.
The levels matter more than the prediction. Size it accordingly.
ICPUSDT SHORT
IN 2.372 - 2.380
OUT 2.396
TP 2.356 · 2.339 · 2.319
#TradeSetup
{future}(ICPUSDT)
$ICP — ngl, the cleanest read is that it still gives sellers the cleaner argument as the current price stays near the bottom of its recent range. Bearish signals are showing up on the daily and four-hour charts, even though the short-term movement lacks real force. For this downside to play out, we need a clear break below that range floor.
The levels matter more than the prediction. Size it accordingly.
ICPUSDT SHORT
IN 2.372 - 2.380
OUT 2.396
TP 2.356 · 2.339 · 2.319
#TradeSetup
The levels matter more than the prediction. Size it accordingly.
ICPUSDT SHORT
IN 2.372 - 2.380
OUT 2.396
TP 2.356 · 2.339 · 2.319
#TradeSetup
4
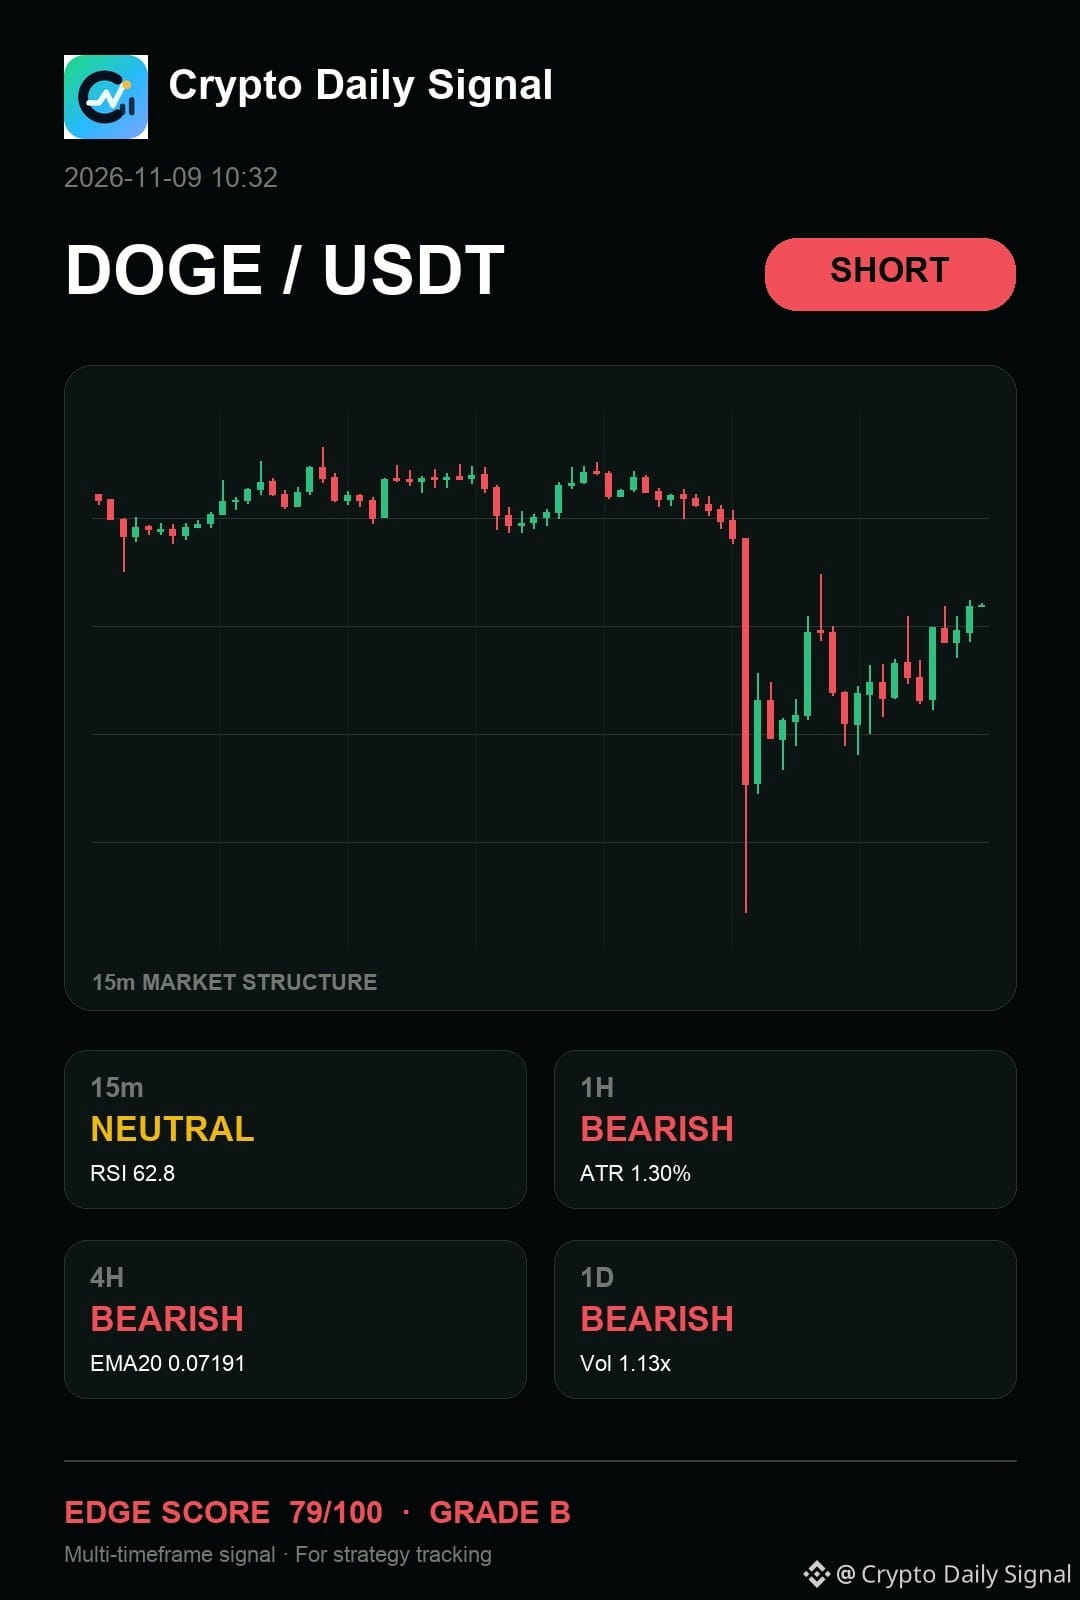
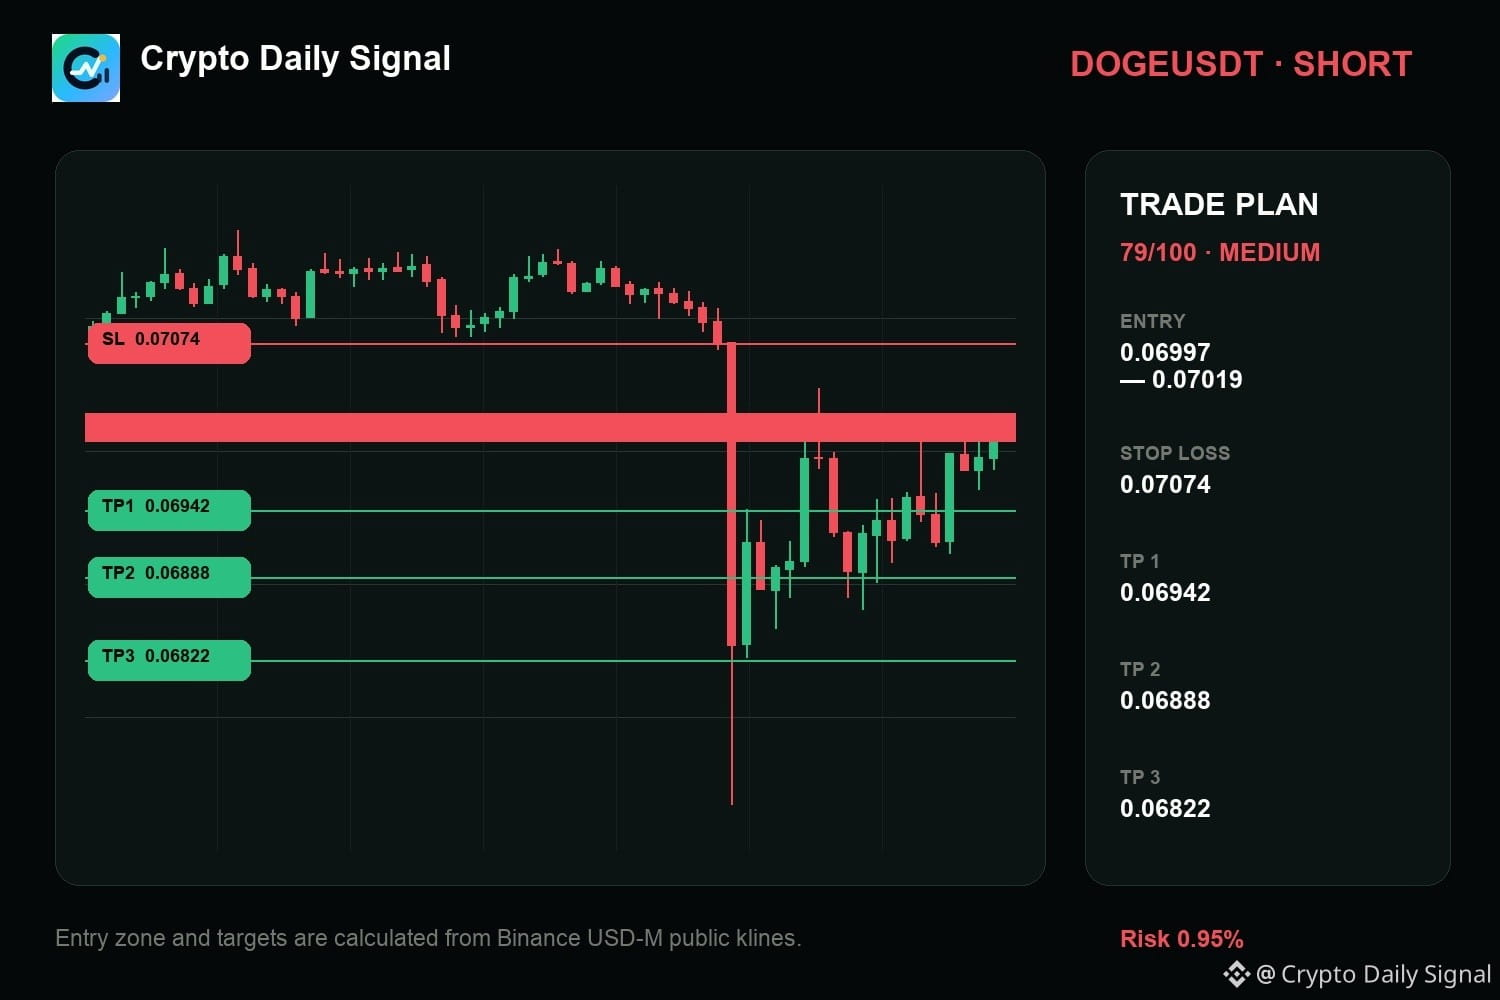
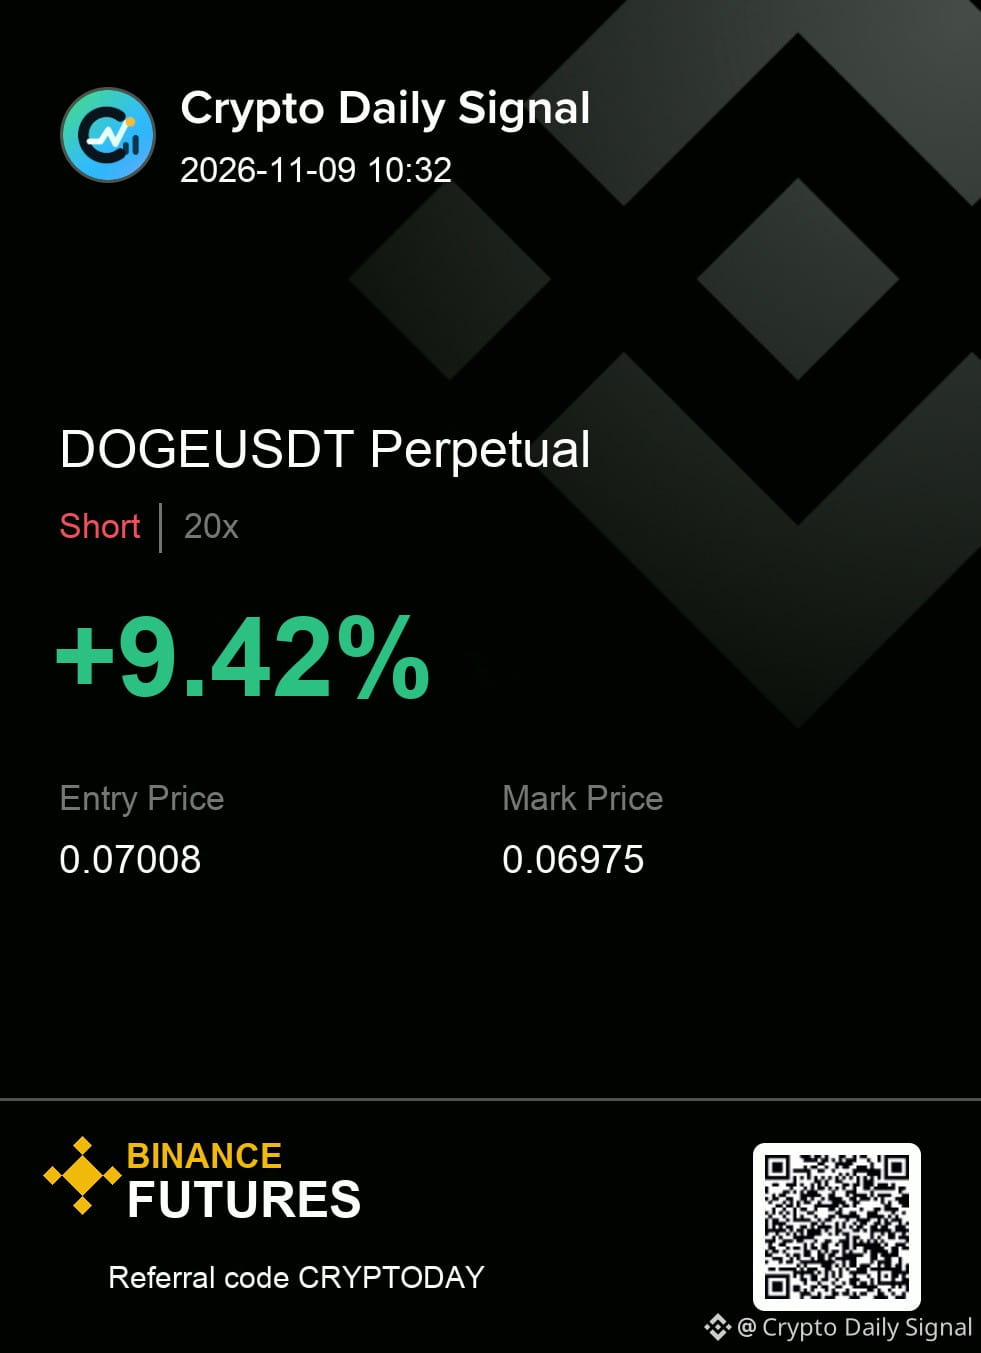
$DOGE is one rejection away from a cleaner short. Trying to catch movement now is premature since the action is below the recent consolidation floor and the higher timeframes suggest selling bias. We need a definitive close below that short-term support level to make the short thesis strong. If it manages to close back above that floor, the immediate setup is voided.
The map is useful only while the invalidation remains intact.
Trade Plan — DOGEUSDT SHORT
Entry: 0.06997 - 0.07019
Stop Loss: 0.07074
TP1: 0.06942 | TP2: 0.06888 | TP3: 0.06822
#TradeSetup
{future}(DOGEUSDT)
$DOGE is one rejection away from a cleaner short. Trying to catch movement now is premature since the action is below the recent consolidation floor and the higher timeframes suggest selling bias. We need a definitive close below that short-term support level to make the short thesis strong. If it manages to close back above that floor, the immediate setup is voided.
The map is useful only while the invalidation remains intact.
Trade Plan — DOGEUSDT SHORT
Entry: 0.06997 - 0.07019
Stop Loss: 0.07074
TP1: 0.06942 | TP2: 0.06888 | TP3: 0.06822
#TradeSetup
The map is useful only while the invalidation remains intact.
Trade Plan — DOGEUSDT SHORT
Entry: 0.06997 - 0.07019
Stop Loss: 0.07074
TP1: 0.06942 | TP2: 0.06888 | TP3: 0.06822
#TradeSetup
7
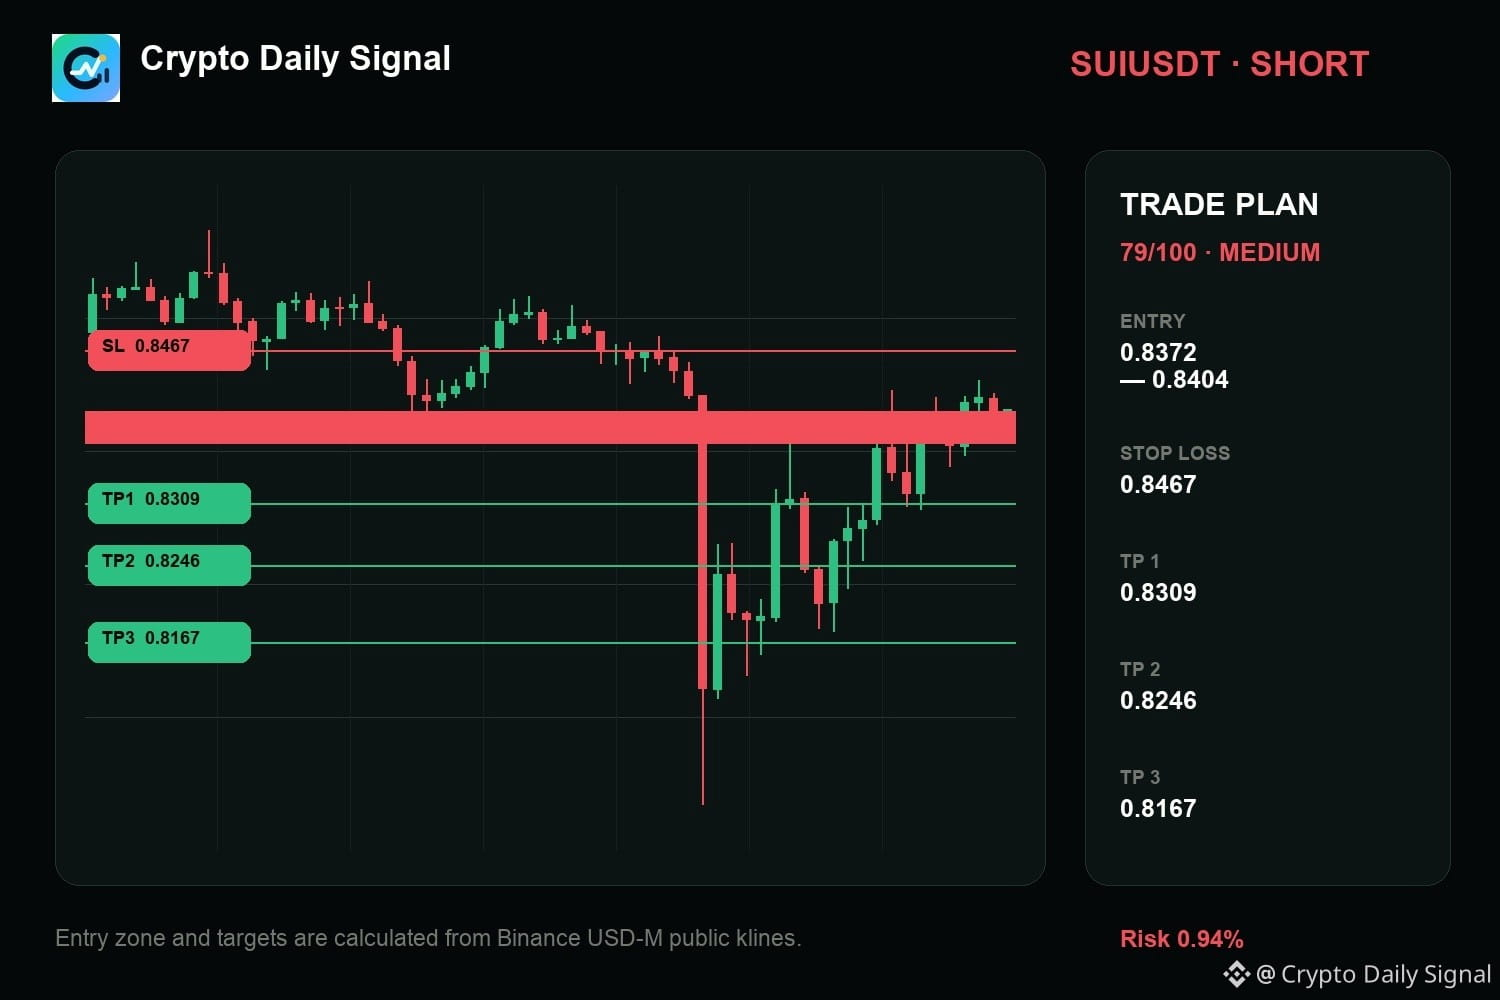
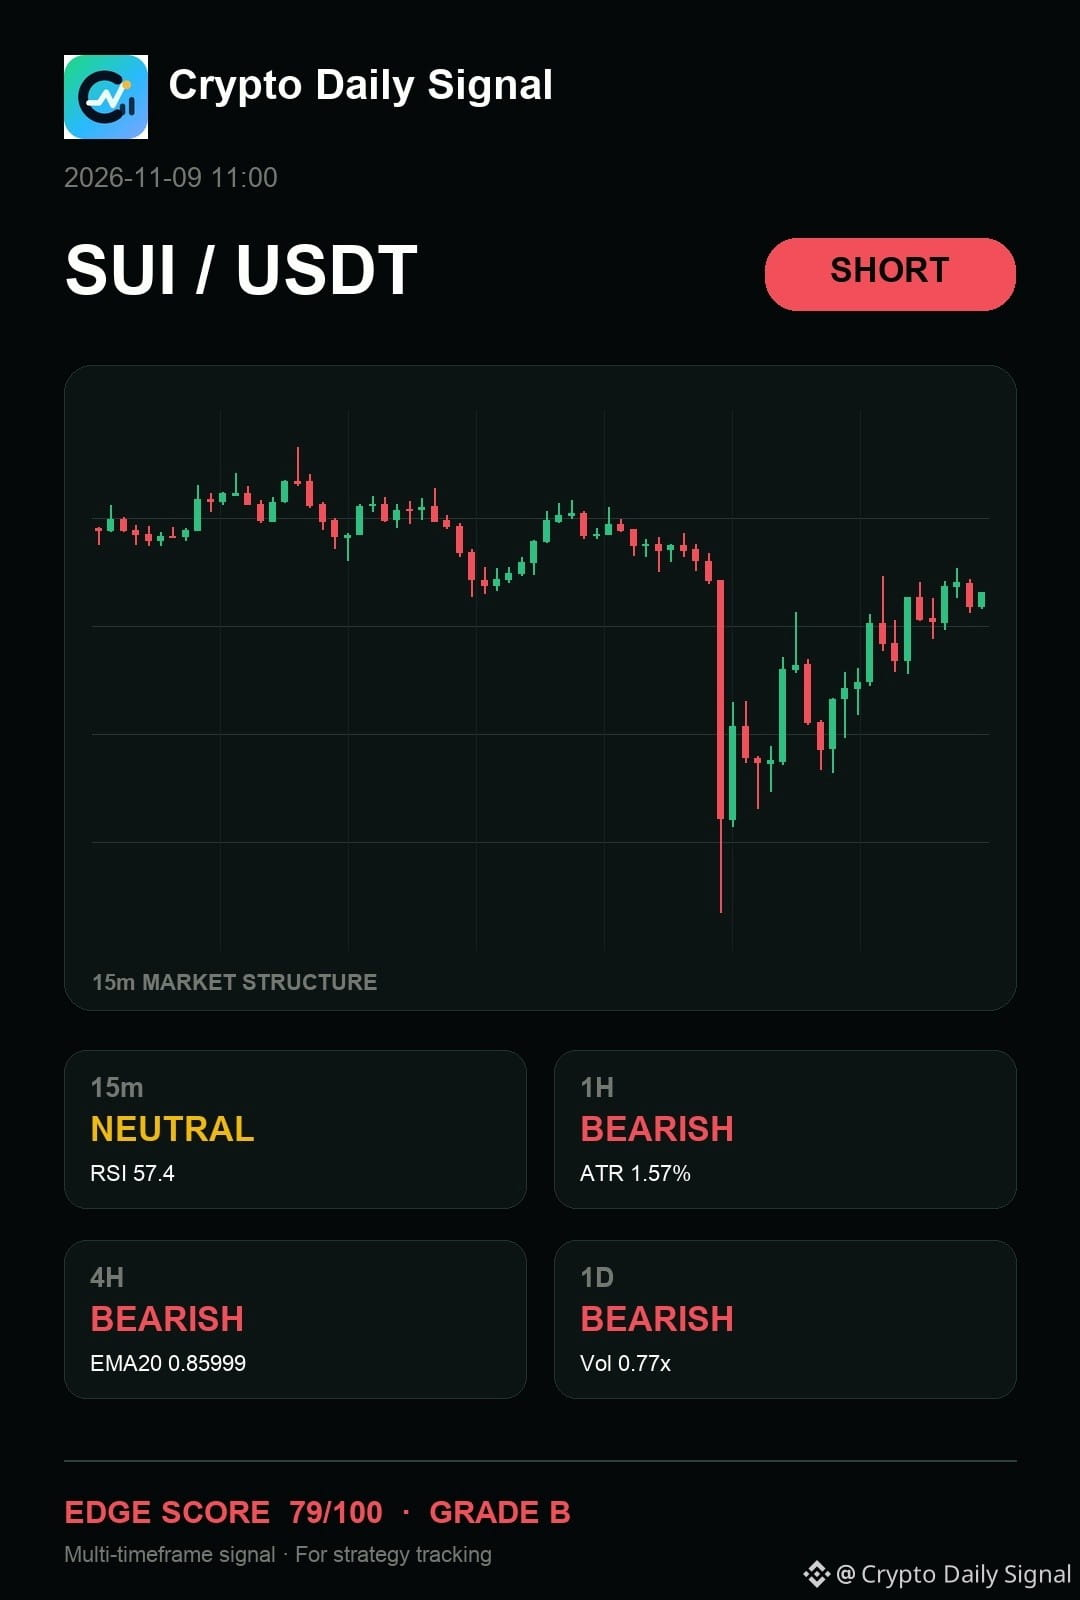
$SUI — one thing is clear to me: it has not invalidated the short case because the price is staying clearly under that major descending trendline. The rejection at higher levels shows selling is in control, and the failure to establish higher lows confirms the overall bearish shape visible across the higher timeframes. For this short to hold, we need to see continued downward acceptance below that trendline.
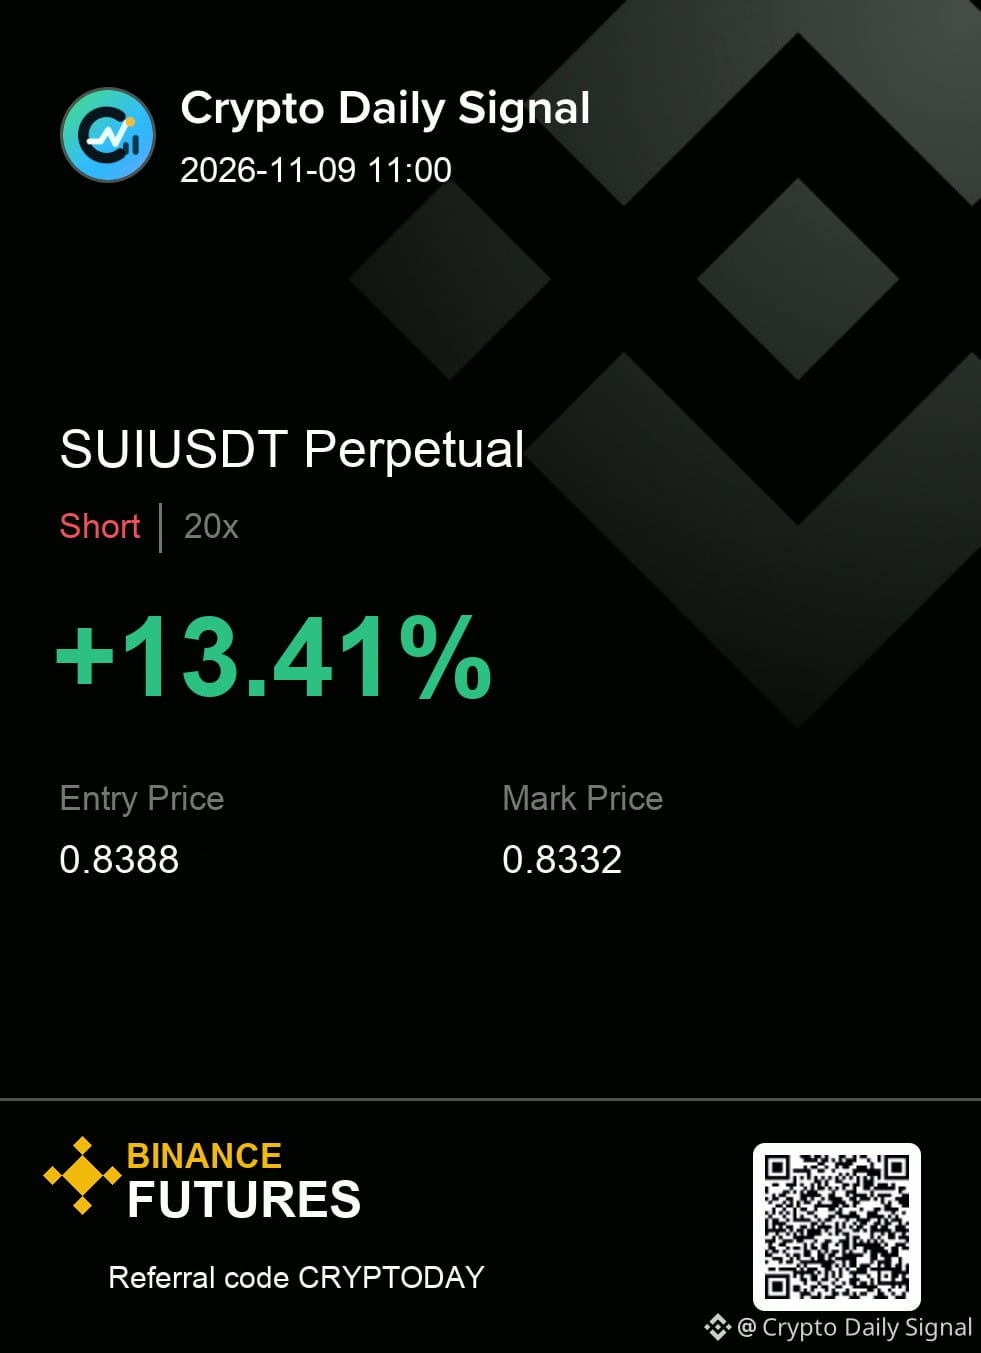
SUIUSDT | SHORT
Entry 0.8372 - 0.8404
Invalidation 0.8467
Targets 0.8309 / 0.8246 / 0.8167
#TradeSetup
{future}(SUIUSDT)
$SUI — one thing is clear to me: it has not invalidated the short case because the price is staying clearly under that major descending trendline. The rejection at higher levels shows selling is in control, and the failure to establish higher lows confirms the overall bearish shape visible across the higher timeframes. For this short to hold, we need to see continued downward acceptance below that trendline.
SUIUSDT | SHORT
Entry 0.8372 - 0.8404
Invalidation 0.8467
Targets 0.8309 / 0.8246 / 0.8167
#TradeSetup
SUIUSDT | SHORT
Entry 0.8372 - 0.8404
Invalidation 0.8467
Targets 0.8309 / 0.8246 / 0.8167
#TradeSetup
11
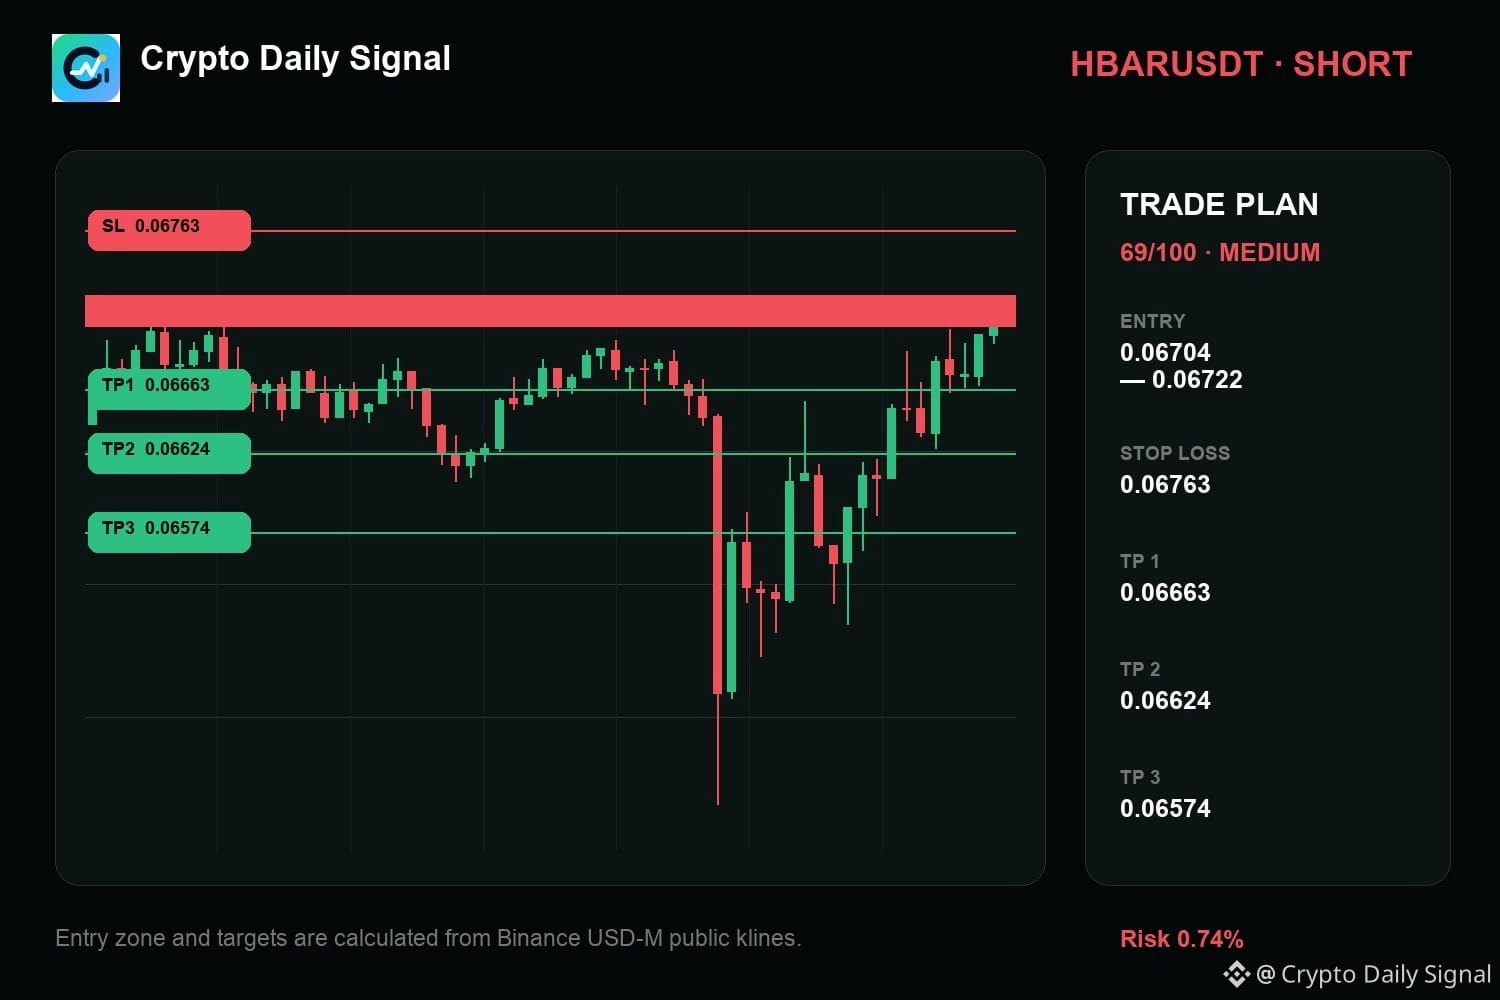
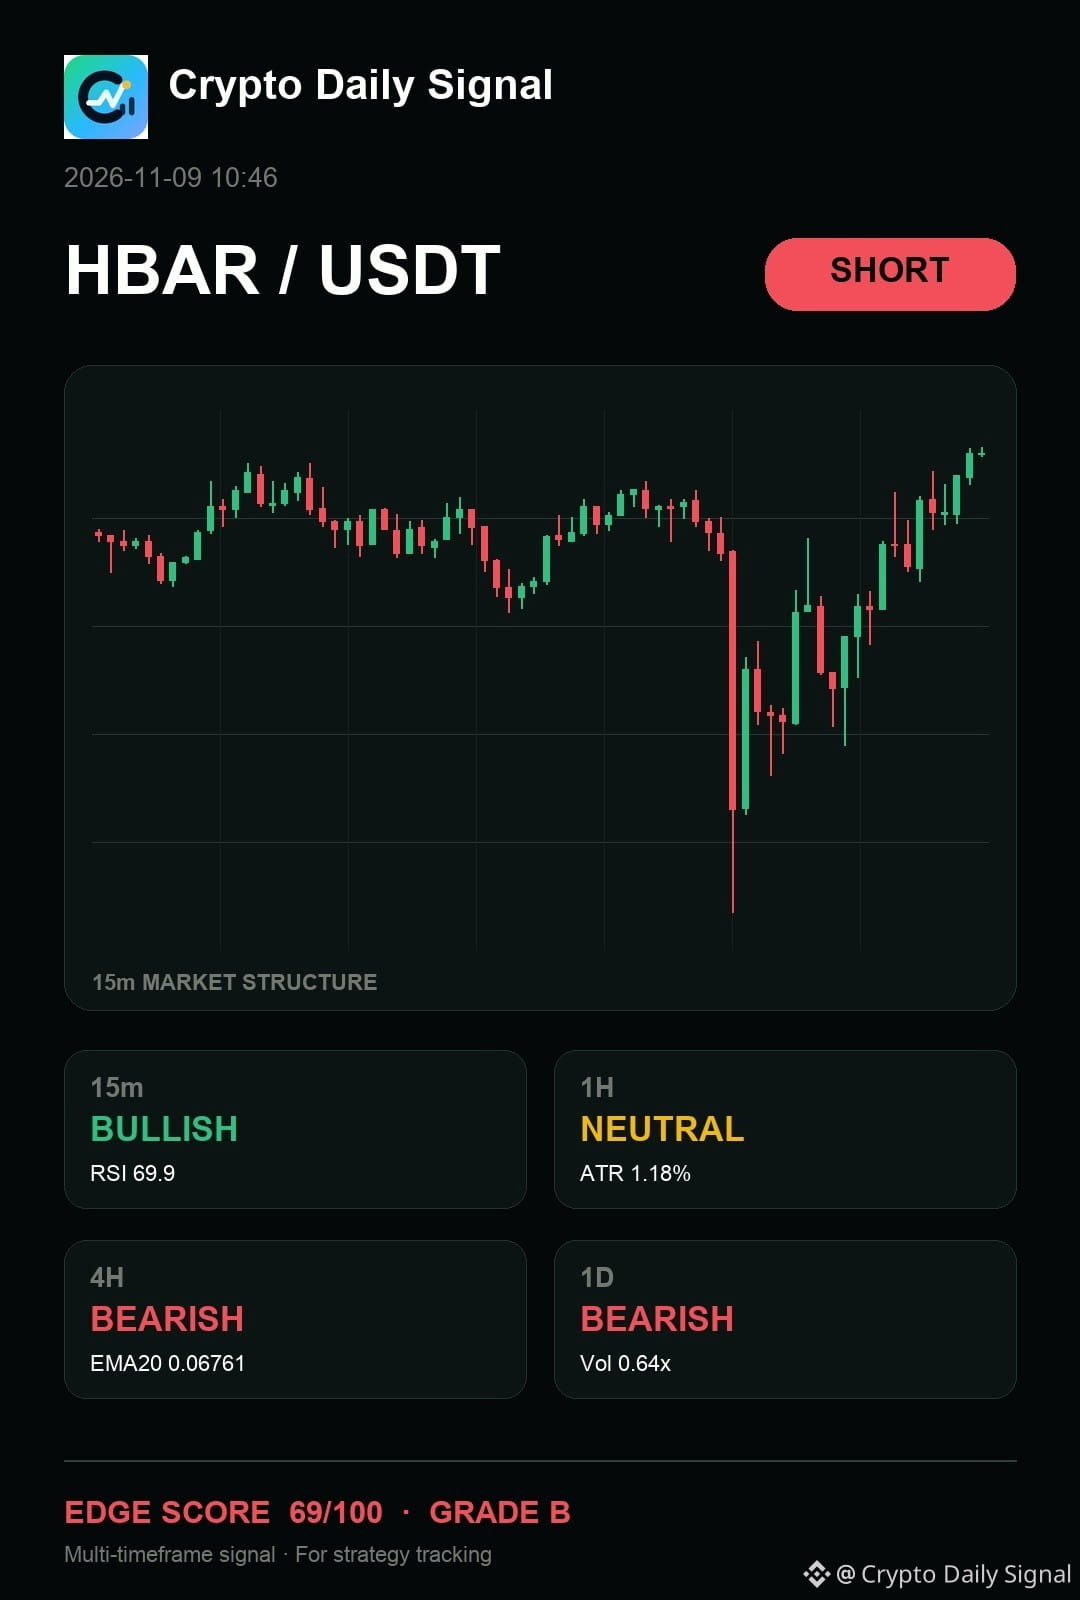
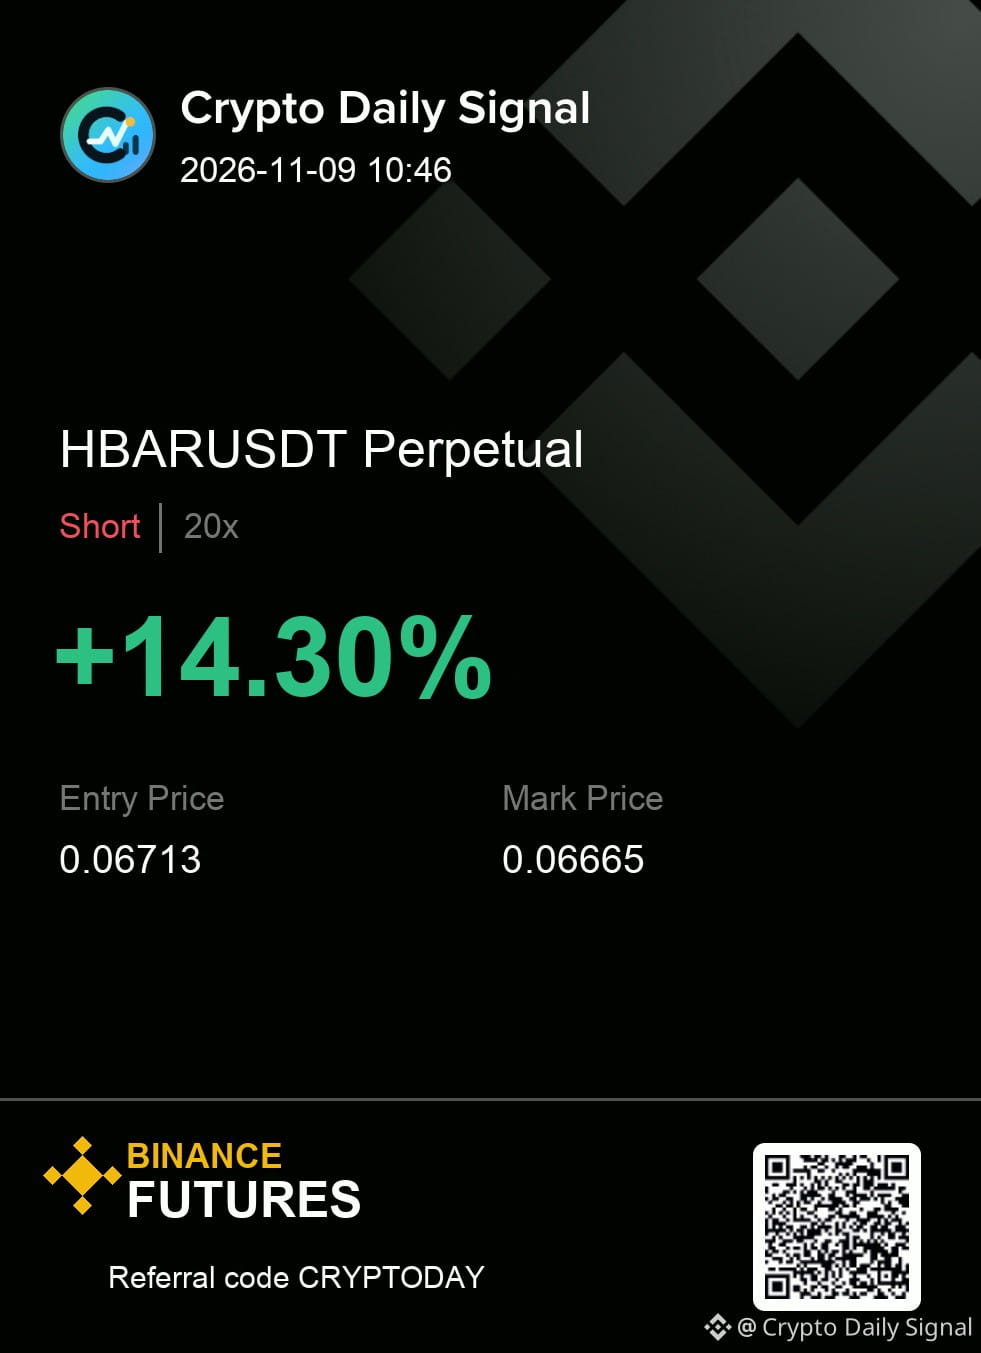
$HBAR remains a short watch for me as the price stays trapped in a contained range despite some recent buying. The overarching bias on the daily and four-hour charts leans down, which is what keeps this trade active. A break above the recent local high would change my view entirely.
HBARUSDT | SHORT
Entry 0.06704 - 0.06722
Invalidation 0.06763
Targets 0.06663 / 0.06624 / 0.06574
Clean enough to execute, or still too early for you?
#TradeSetup
{future}(HBARUSDT)
$HBAR remains a short watch for me as the price stays trapped in a contained range despite some recent buying. The overarching bias on the daily and four-hour charts leans down, which is what keeps this trade active. A break above the recent local high would change my view entirely.
HBARUSDT | SHORT
Entry 0.06704 - 0.06722
Invalidation 0.06763
Targets 0.06663 / 0.06624 / 0.06574
Clean enough to execute, or still too early for you?
#TradeSetup
HBARUSDT | SHORT
Entry 0.06704 - 0.06722
Invalidation 0.06763
Targets 0.06663 / 0.06624 / 0.06574
Clean enough to execute, or still too early for you?
#TradeSetup
6
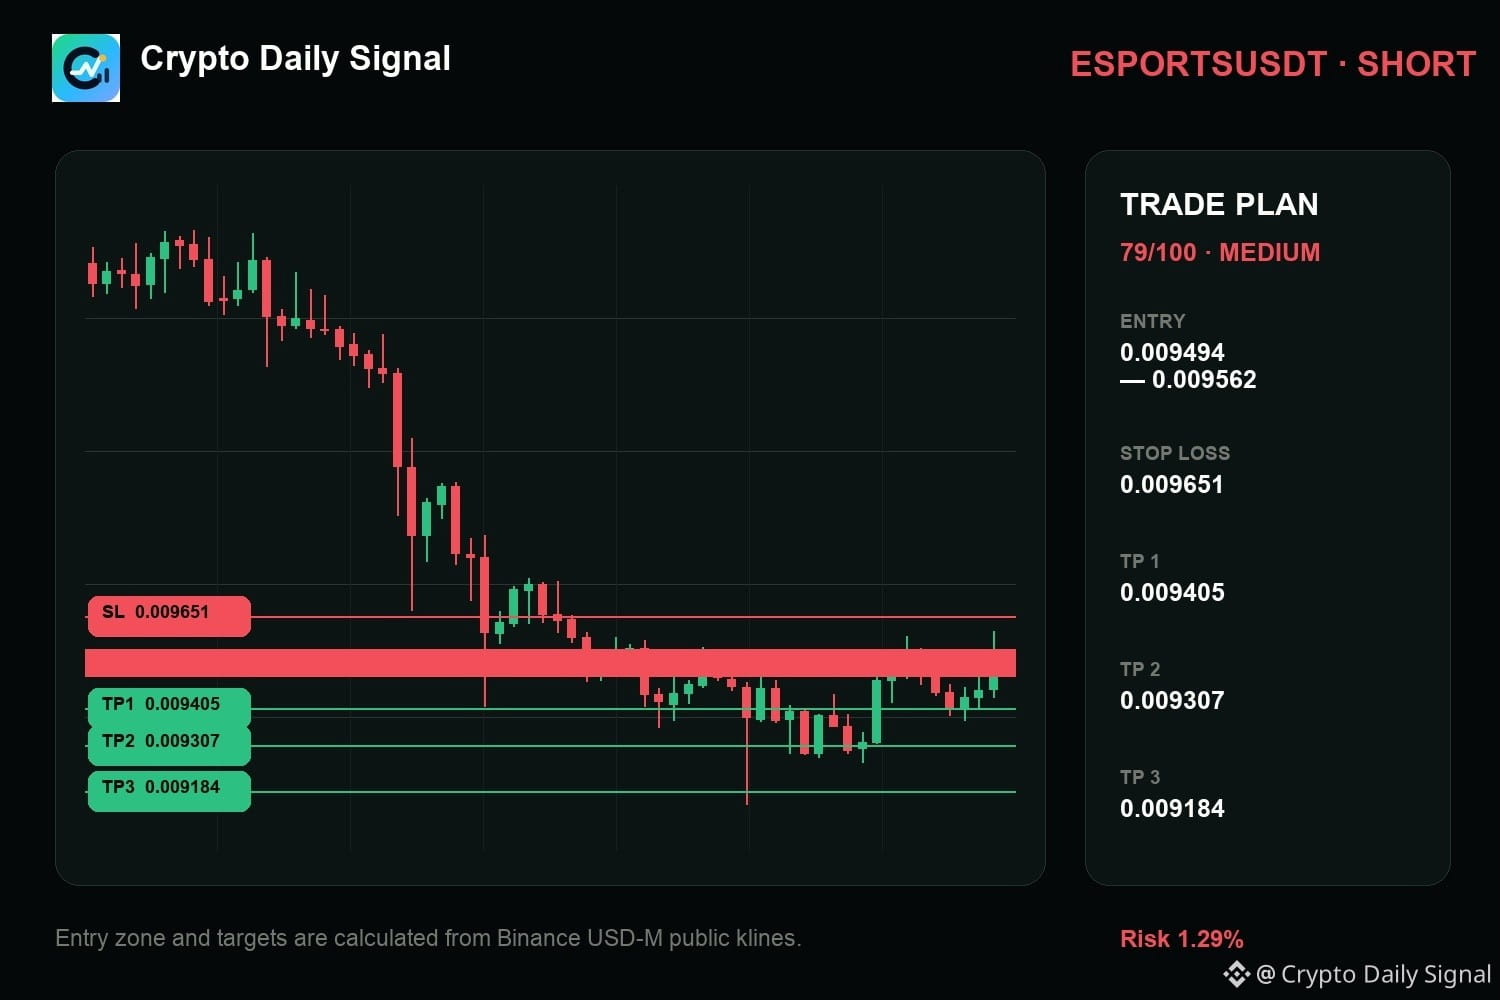
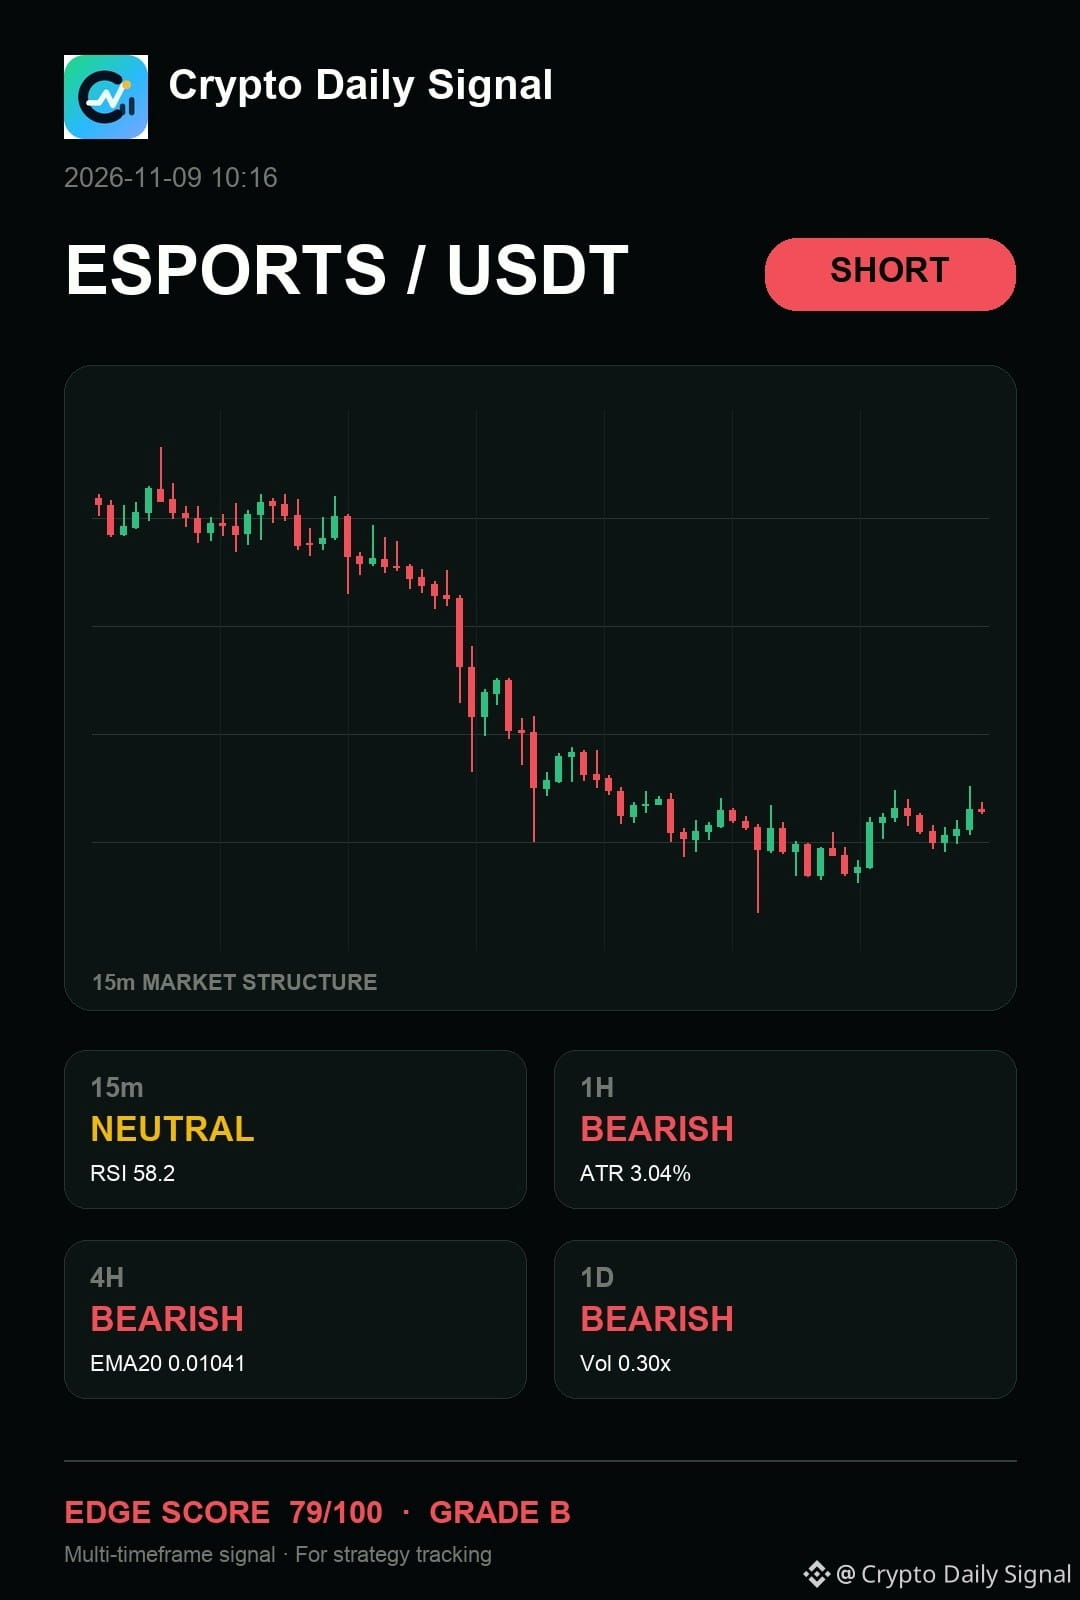
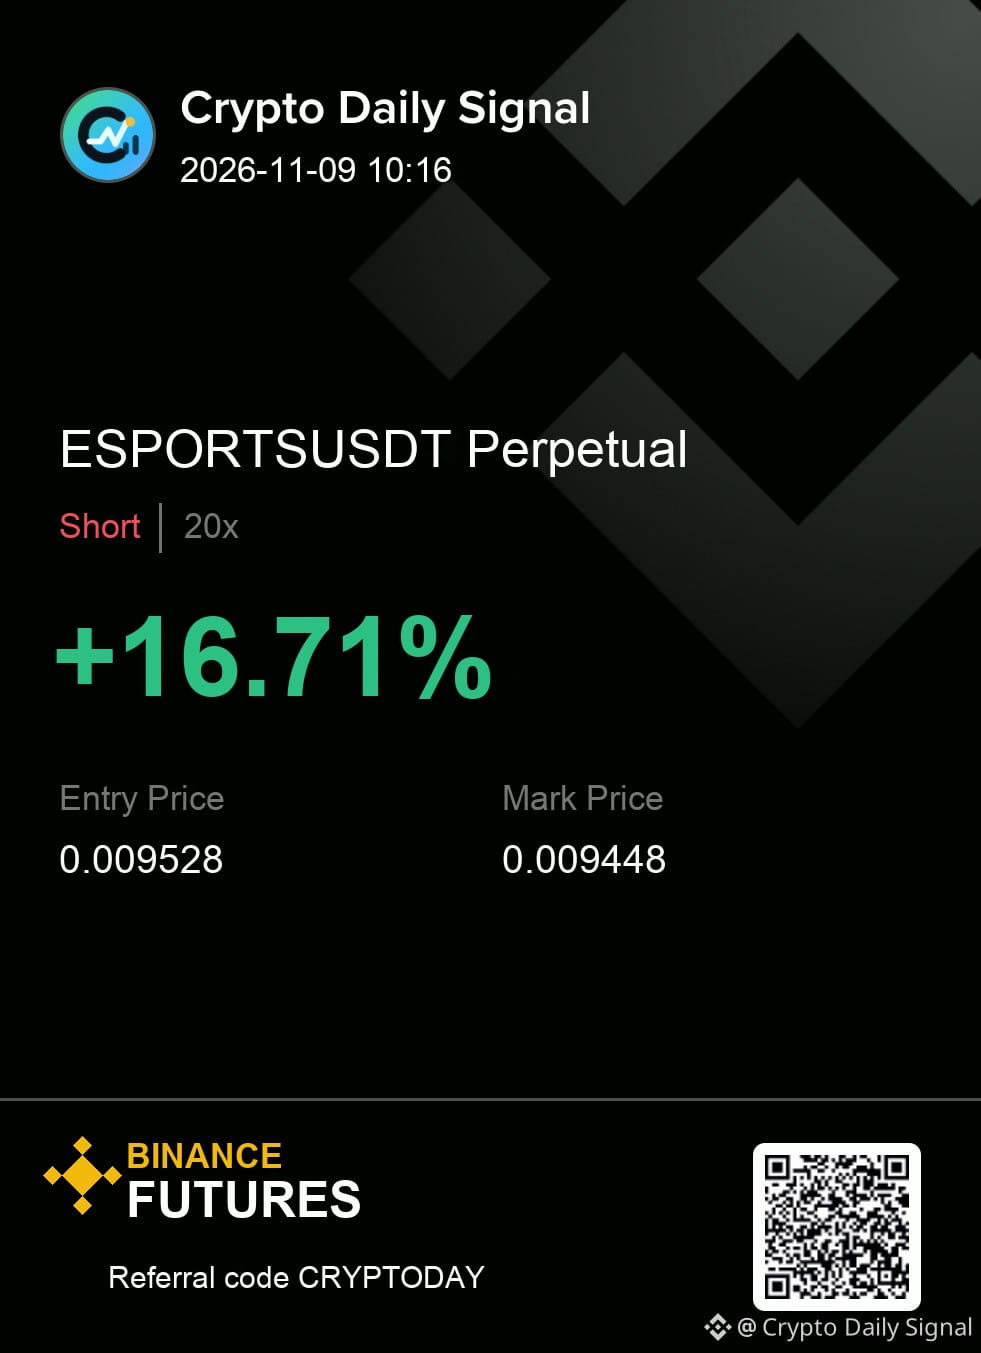
$ESPORTS — for me, the core read is that it is one rejection away from a cleaner short. We are watching the lower highs forming against bearish signals on the hourly and four-hour views. A break below the recent local low on a down candle would validate the view, but a rally reclaiming that high stops the trade.
Levels — ESPORTSUSDT
Zone: 0.009494 - 0.009562
Cut: 0.009651
Scale: 0.009405 | 0.009307 | 0.009184
Would you take it here, or wait for one more confirmation candle?
#TradeSetup
{future}(ESPORTSUSDT)
$ESPORTS — for me, the core read is that it is one rejection away from a cleaner short. We are watching the lower highs forming against bearish signals on the hourly and four-hour views. A break below the recent local low on a down candle would validate the view, but a rally reclaiming that high stops the trade.
Levels — ESPORTSUSDT
Zone: 0.009494 - 0.009562
Cut: 0.009651
Scale: 0.009405 | 0.009307 | 0.009184
Would you take it here, or wait for one more confirmation candle?
#TradeSetup
Levels — ESPORTSUSDT
Zone: 0.009494 - 0.009562
Cut: 0.009651
Scale: 0.009405 | 0.009307 | 0.009184
Would you take it here, or wait for one more confirmation candle?
#TradeSetup
9
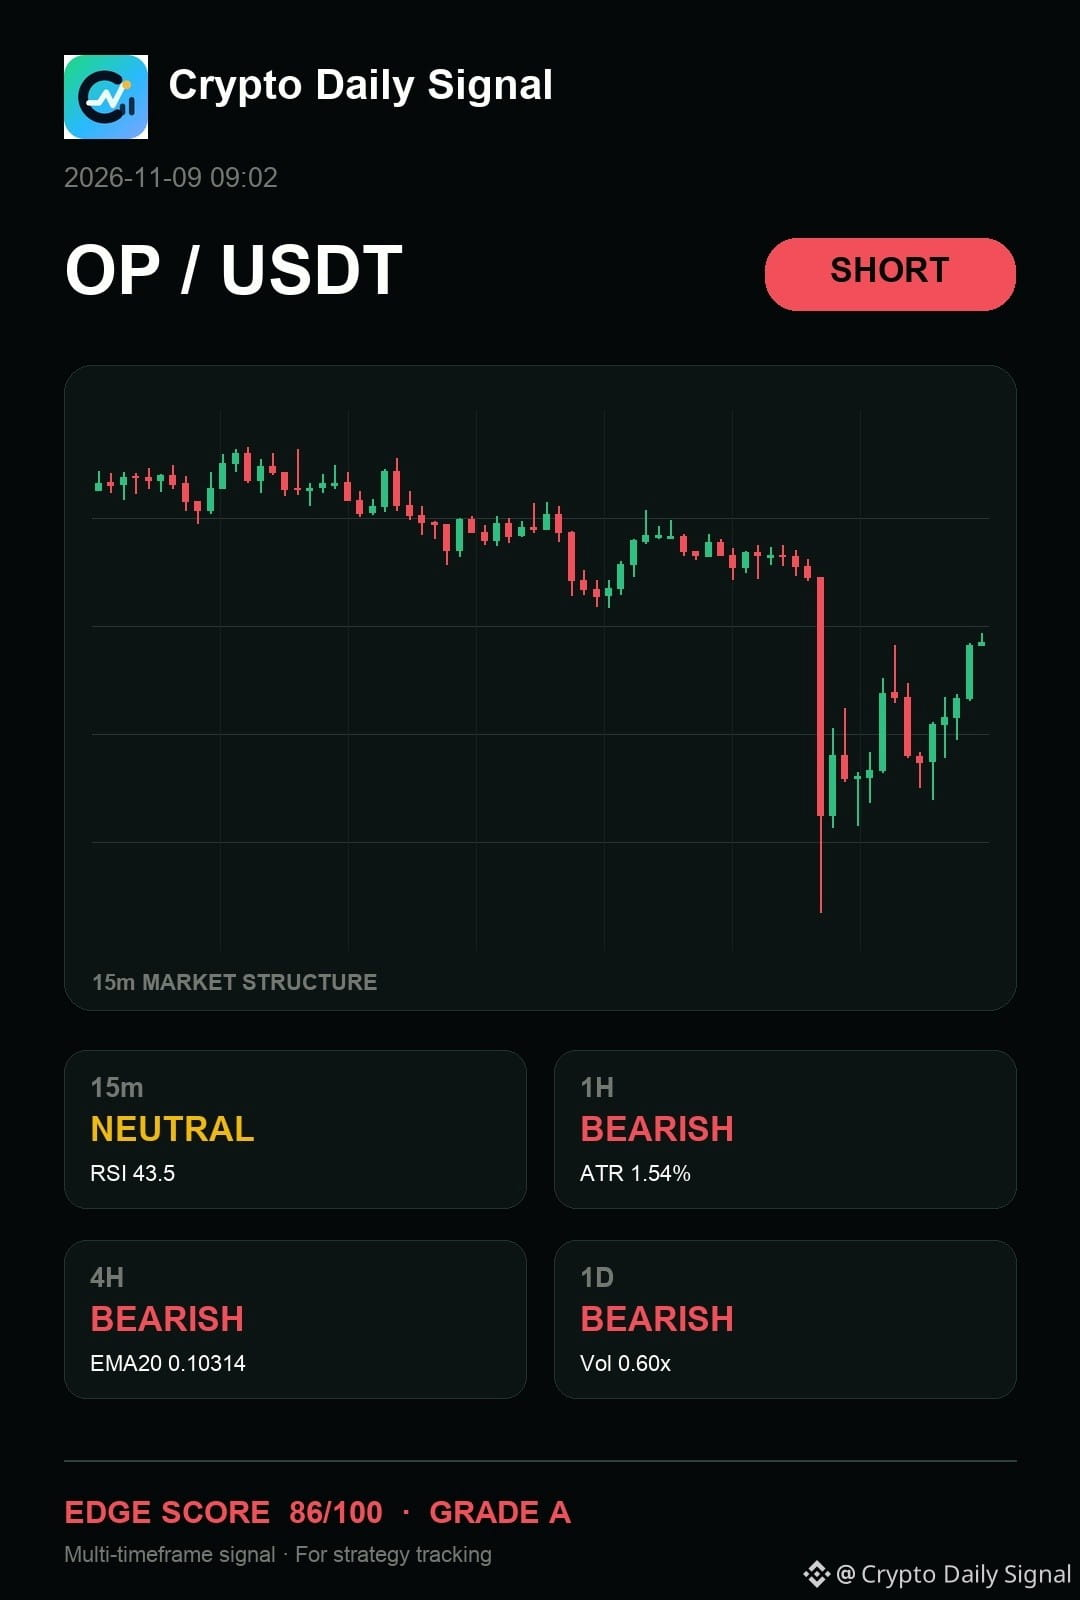
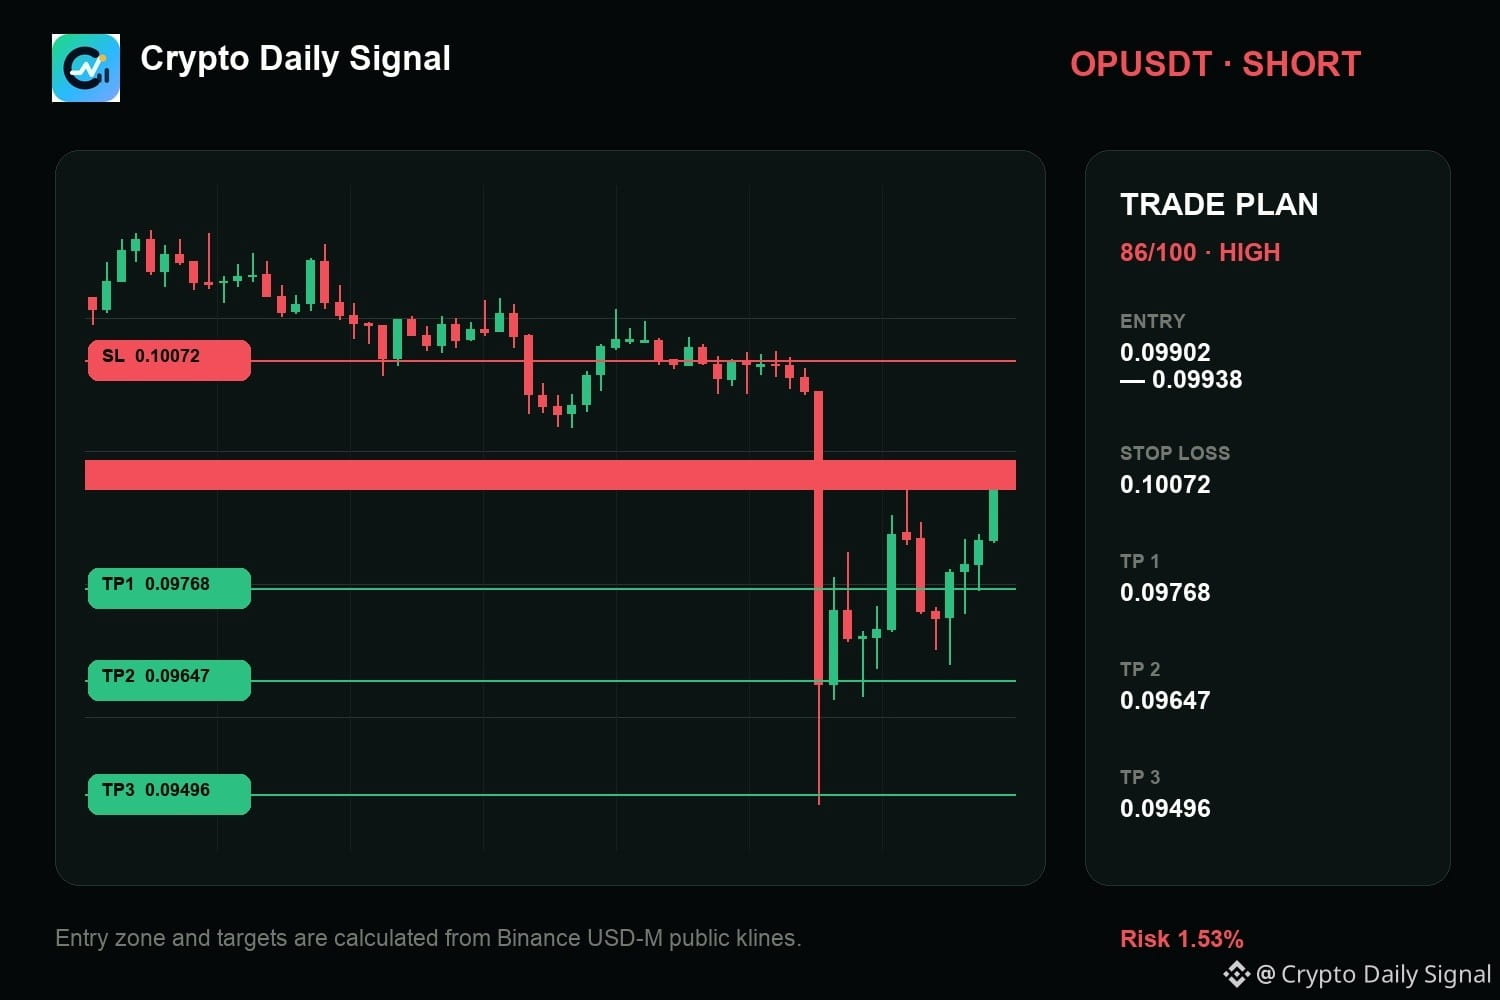
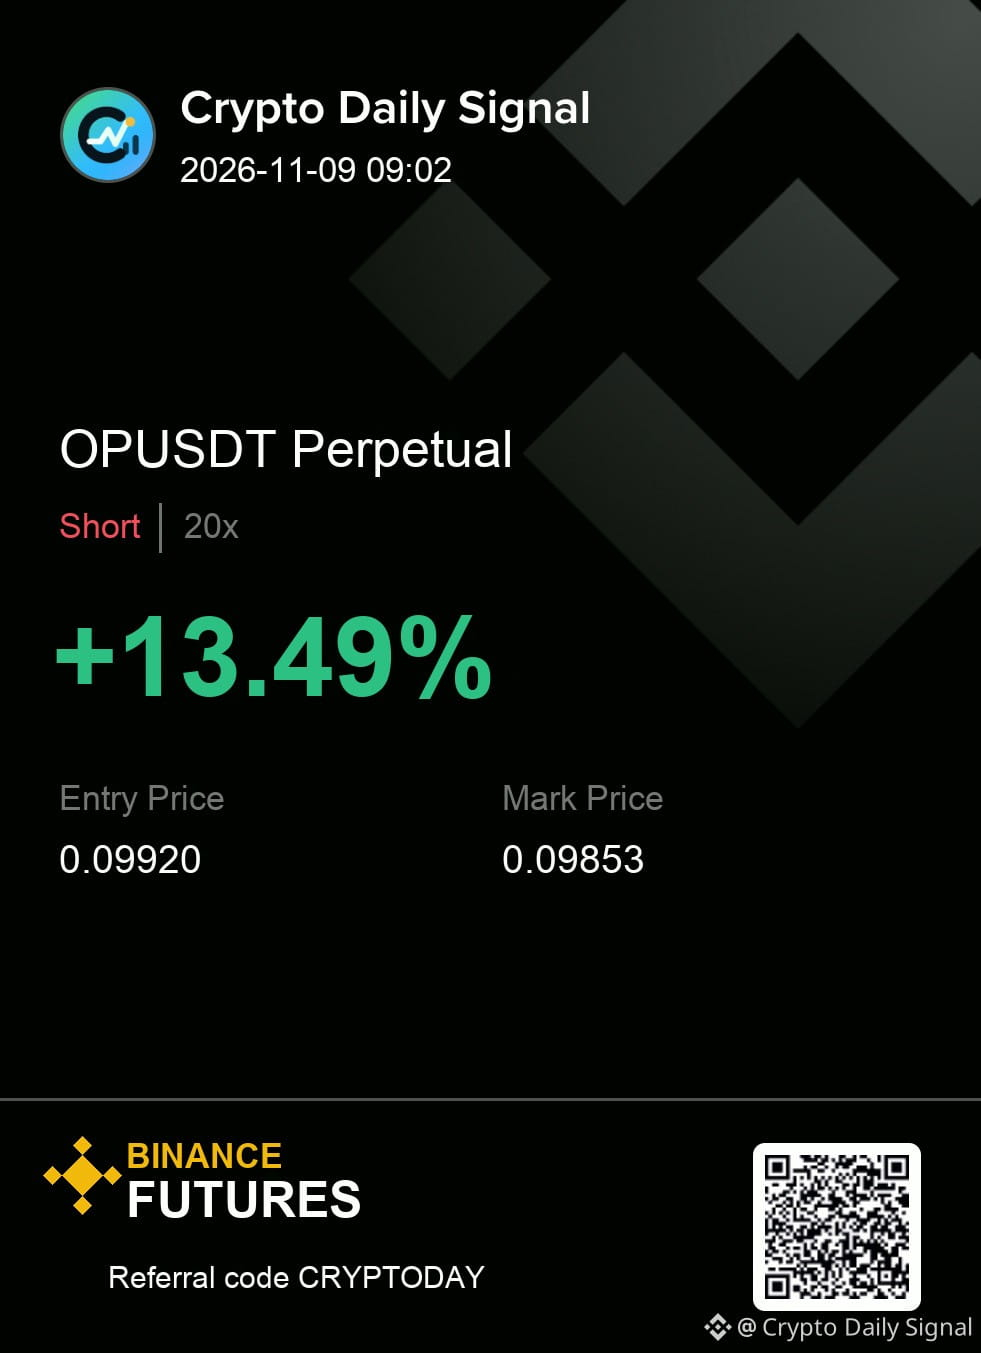
$OP is a patience trade on the short side because the price is currently locked inside a clear, downward sloping channel. We are seeing consistent upper wick activity against the upper edge of this range, and the broader sentiment across the daily view remains firmly bearish. For the bearish view to gain strength, we need a definitive close below that descending trendline.
Execution is simple here: respect the zone and respect the cut.
OPUSDT SHORT map
Entry → 0.09902 - 0.09938
SL → 0.10072
TP → 0.09768 · 0.09647 · 0.09496
#TradeSetup
{future}(OPUSDT)
$OP is a patience trade on the short side because the price is currently locked inside a clear, downward sloping channel. We are seeing consistent upper wick activity against the upper edge of this range, and the broader sentiment across the daily view remains firmly bearish. For the bearish view to gain strength, we need a definitive close below that descending trendline.
Execution is simple here: respect the zone and respect the cut.
OPUSDT SHORT map
Entry → 0.09902 - 0.09938
SL → 0.10072
TP → 0.09768 · 0.09647 · 0.09496
#TradeSetup
Execution is simple here: respect the zone and respect the cut.
OPUSDT SHORT map
Entry → 0.09902 - 0.09938
SL → 0.10072
TP → 0.09768 · 0.09647 · 0.09496
#TradeSetup
4
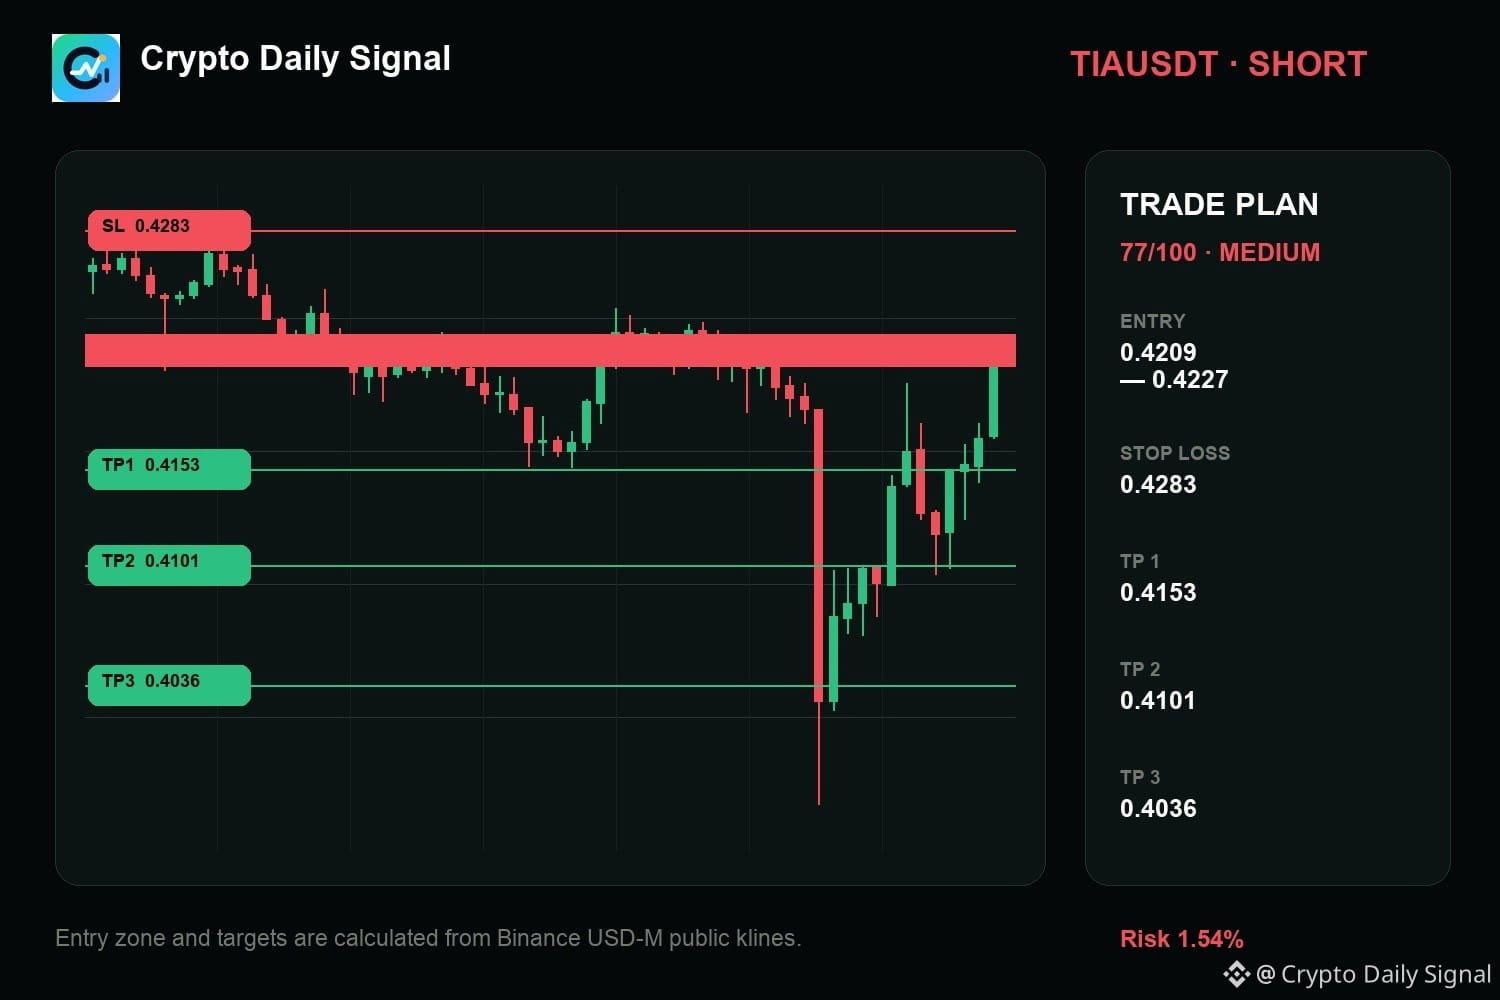
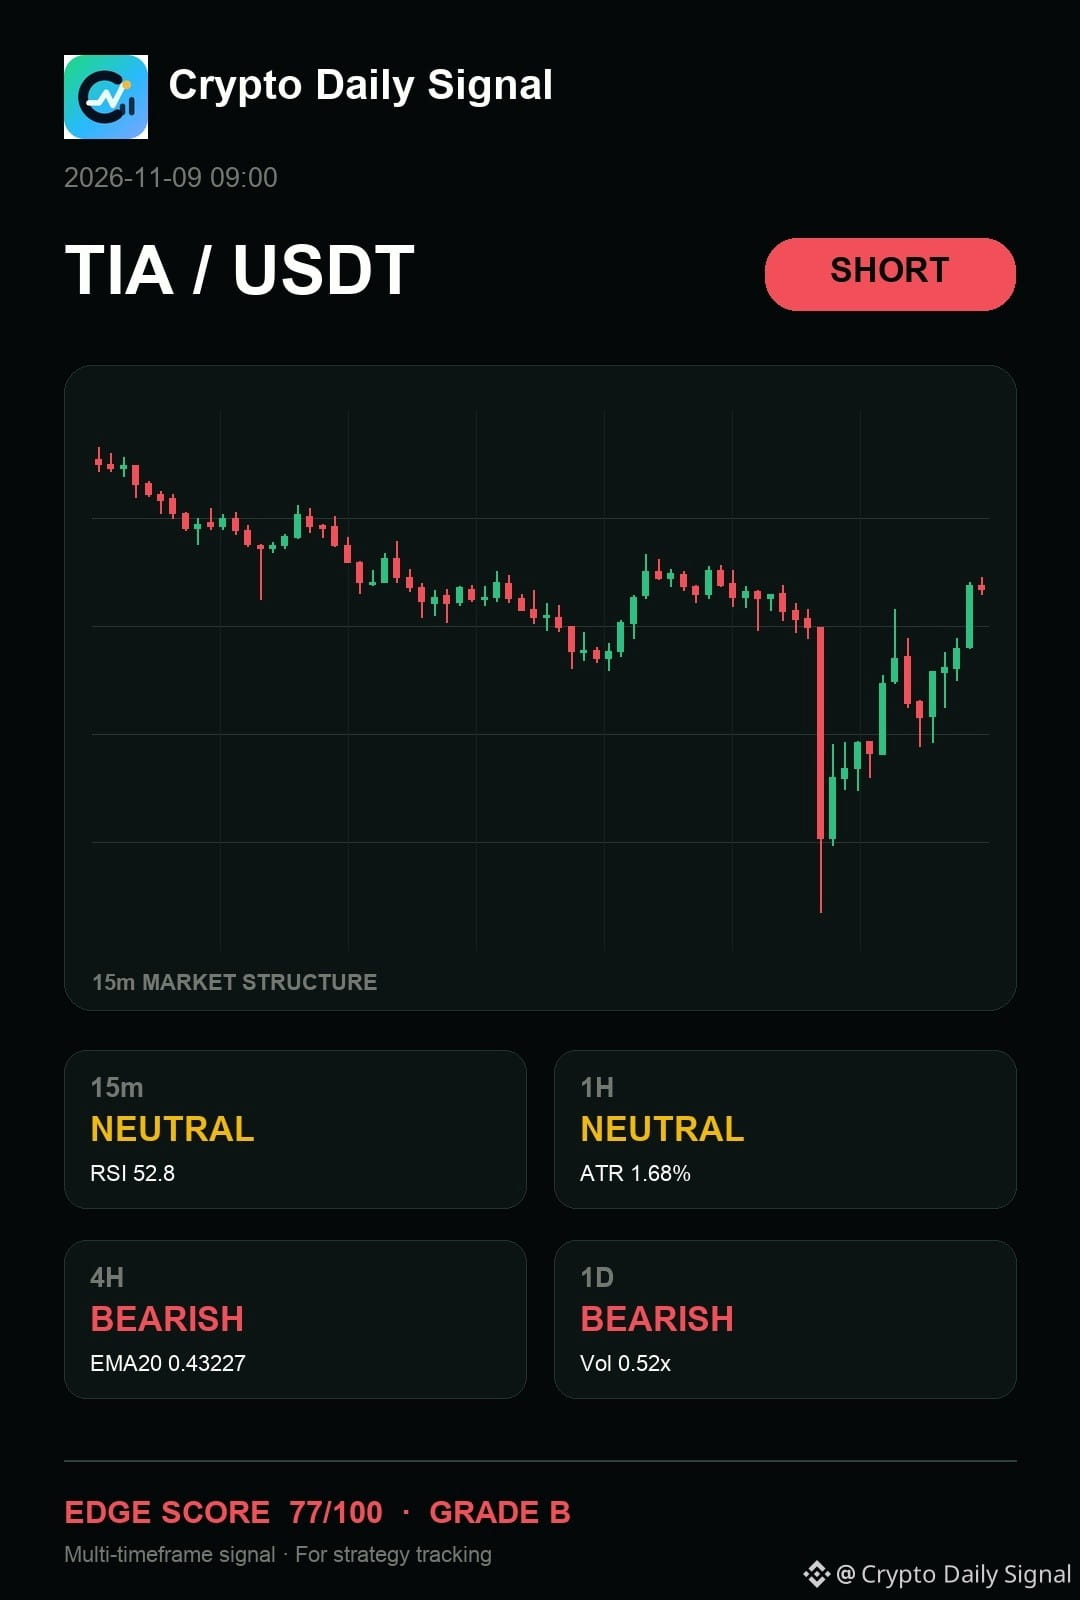
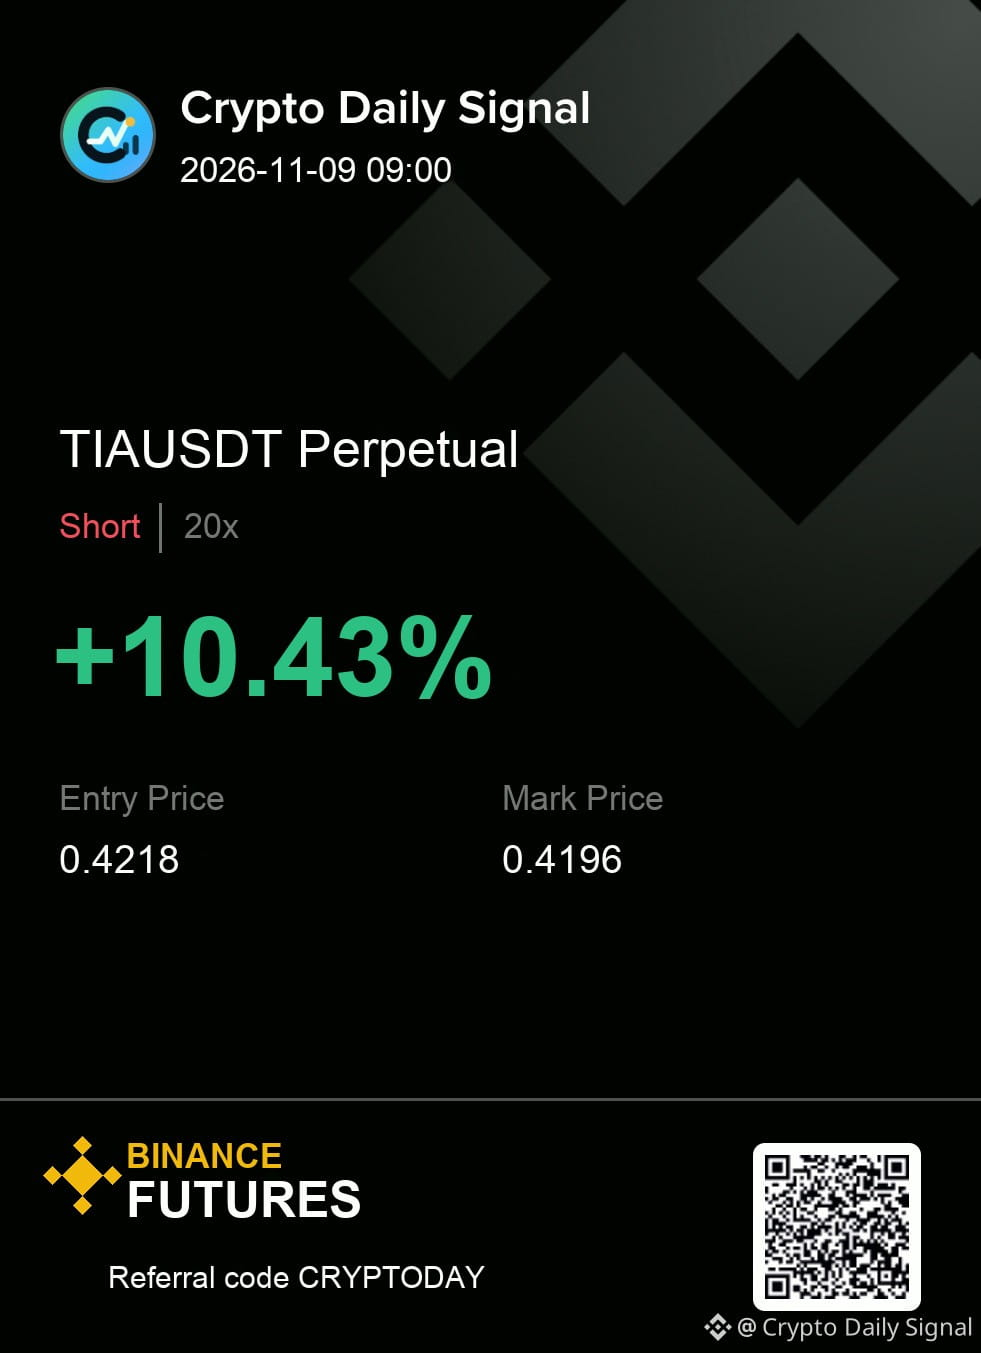
$TIA — tbh, I keep coming back to how it needs the sell-side reaction to confirm the bearish narrative. The shorter term movements are challenging to build higher lows against, aligning with the bearish tone on the daily and four-hour charts. A drop below the established floor area would provide a clearer setup, while a strong push past the last swing high would immediately negate the idea.
Execution plan (TIAUSDT — SHORT)
Entry: 0.4209 - 0.4227 | SL: 0.4283
Take profit: 0.4153 → 0.4101 → 0.4036
#TradeSetup
{future}(TIAUSDT)
$TIA — tbh, I keep coming back to how it needs the sell-side reaction to confirm the bearish narrative. The shorter term movements are challenging to build higher lows against, aligning with the bearish tone on the daily and four-hour charts. A drop below the established floor area would provide a clearer setup, while a strong push past the last swing high would immediately negate the idea.
Execution plan (TIAUSDT — SHORT)
Entry: 0.4209 - 0.4227 | SL: 0.4283
Take profit: 0.4153 → 0.4101 → 0.4036
#TradeSetup
Execution plan (TIAUSDT — SHORT)
Entry: 0.4209 - 0.4227 | SL: 0.4283
Take profit: 0.4153 → 0.4101 → 0.4036
#TradeSetup
4
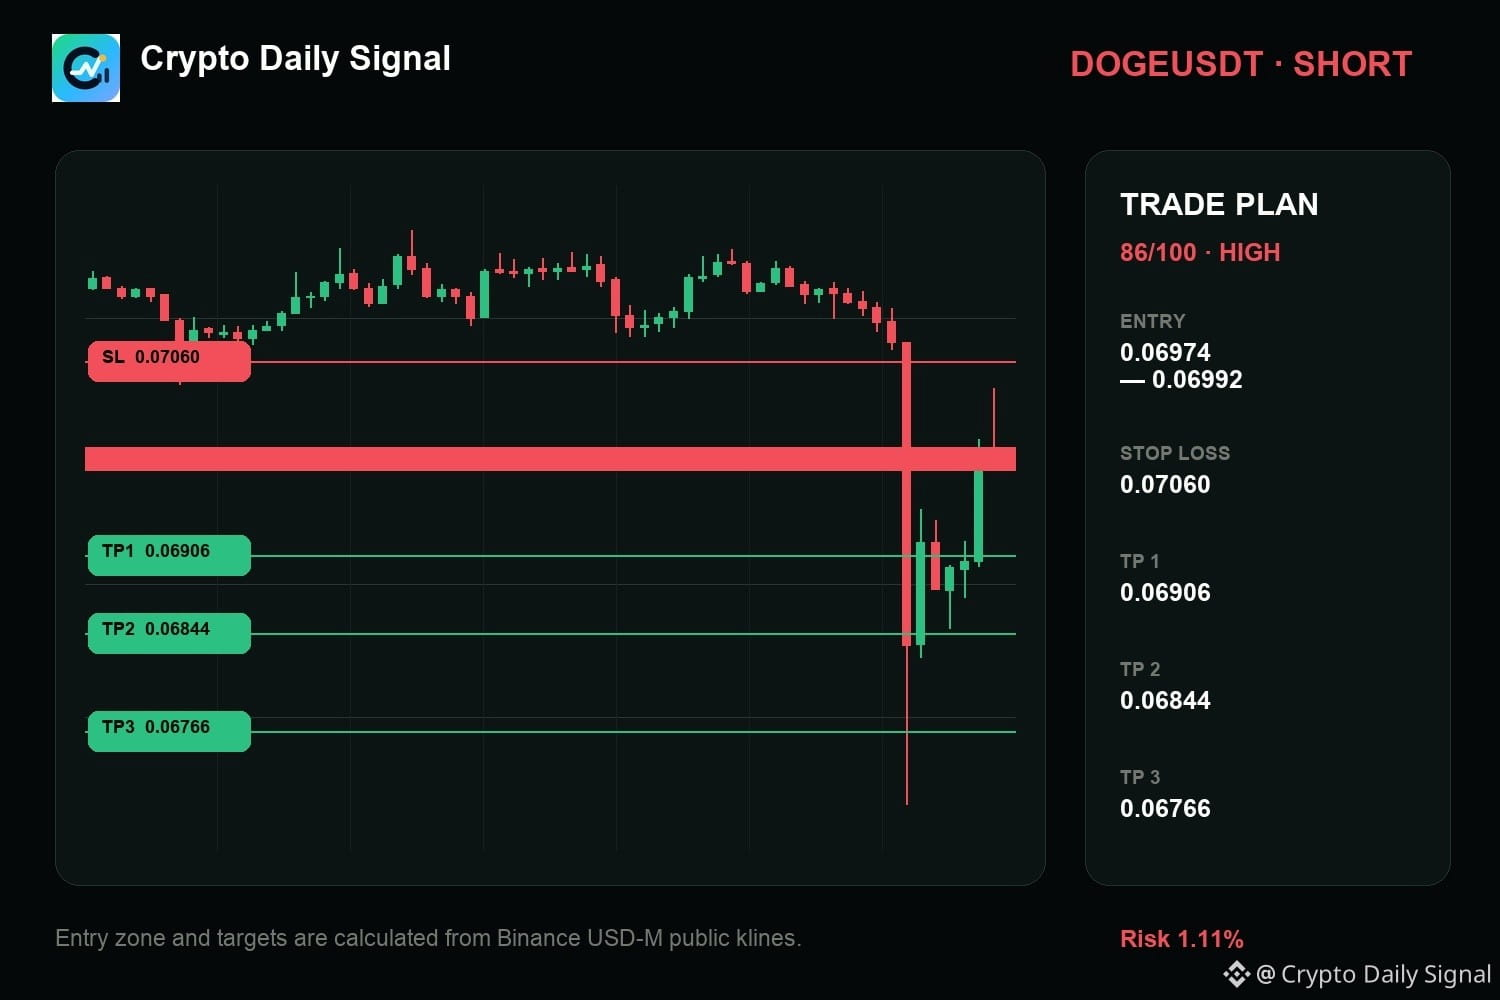
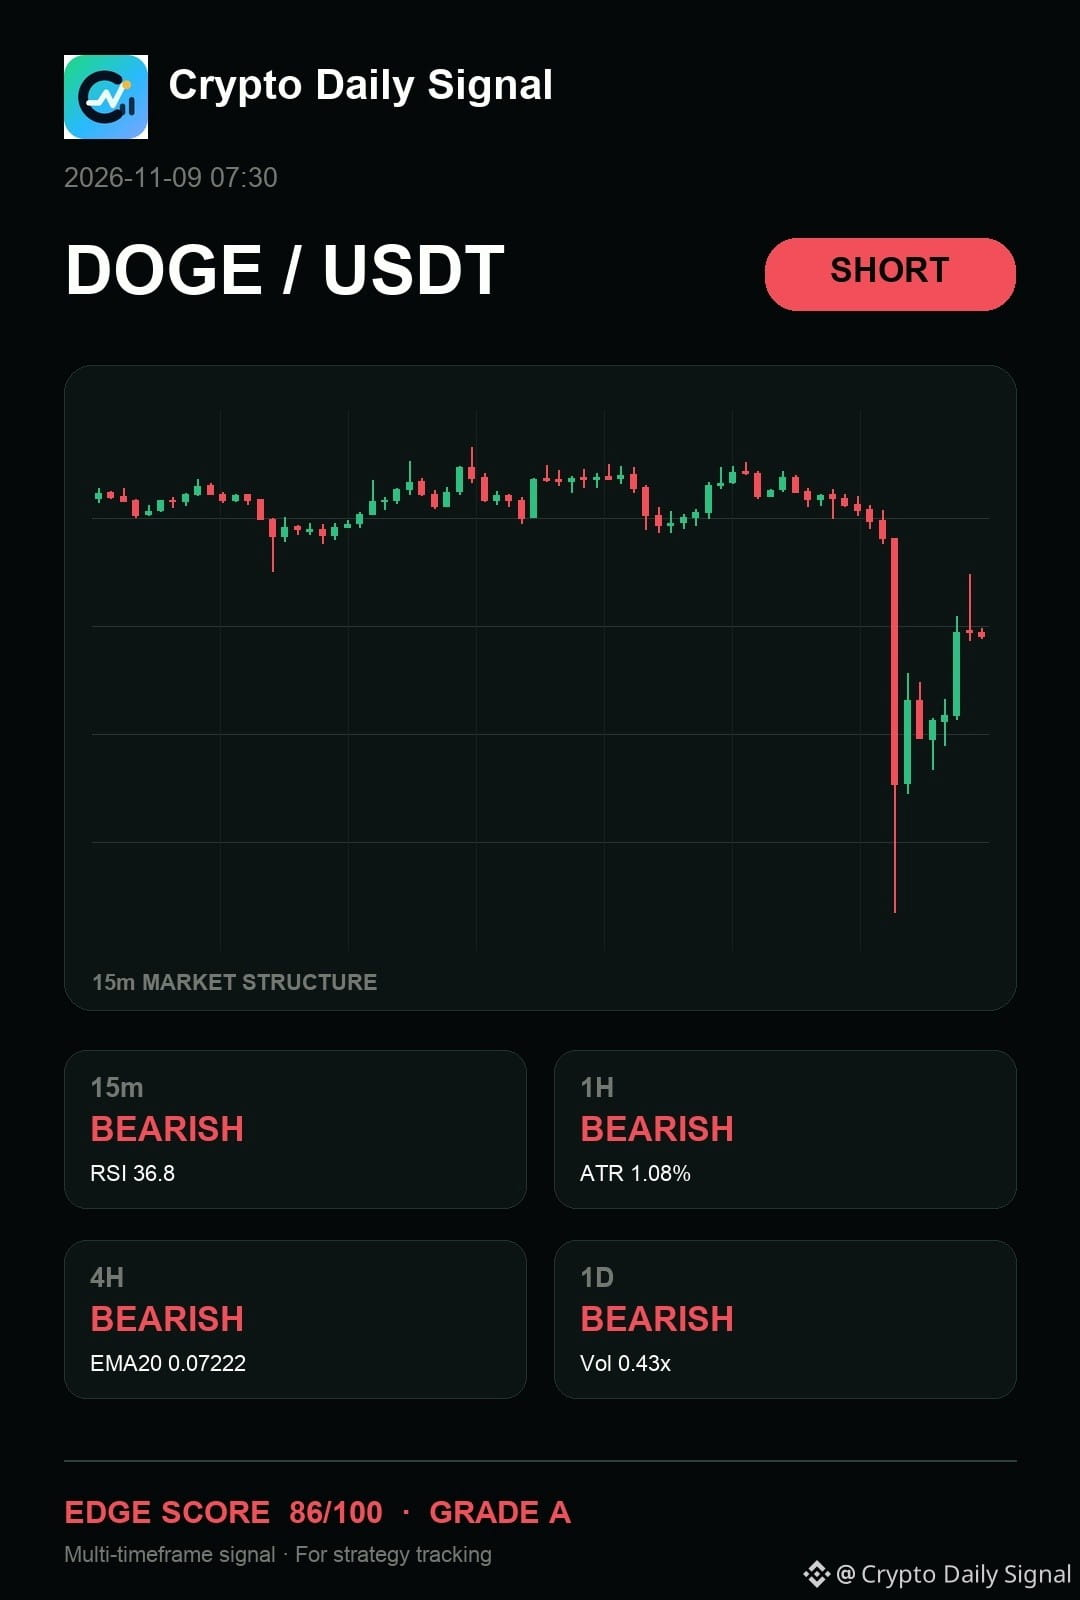
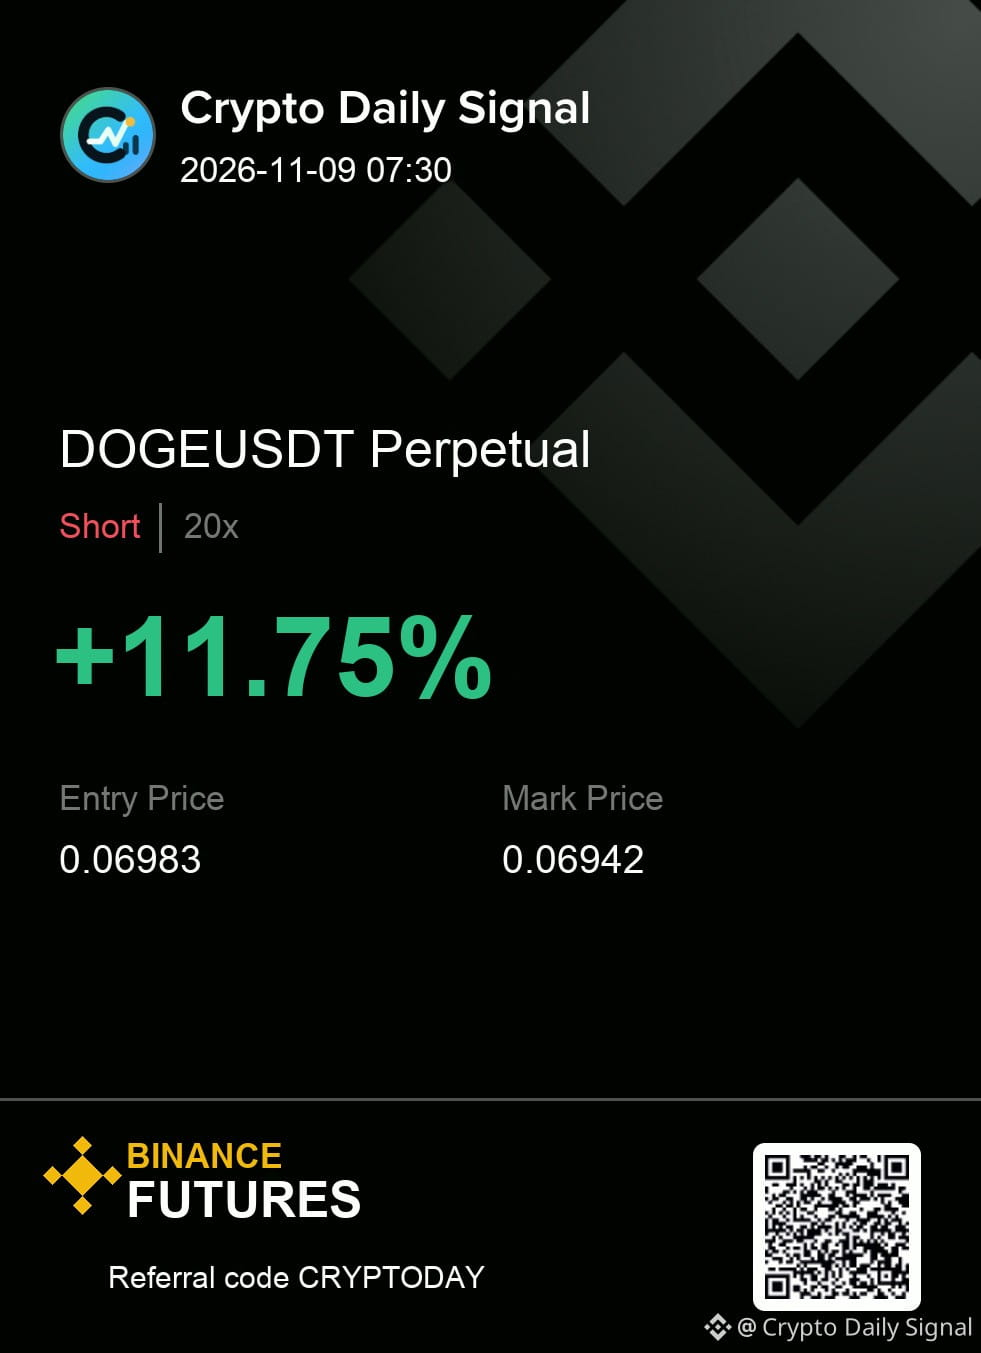
$DOGE keeps me focused on the downside response as the price fails to break decisively above the recent high on the fifteen-minute chart. The setup is being held in place by bearish context across the higher timeframes. For this bearish view to get stronger, I need a definitive dip below the current floor, otherwise, a move over that last swing high cancels the bias.
Execution plan (DOGEUSDT — SHORT)
Entry: 0.06974 - 0.06992 | SL: 0.07060
Take profit: 0.06906 → 0.06844 → 0.06766
Worth tracking from here, or does the range still need more time?
#TradeSetup
{future}(DOGEUSDT)
$DOGE keeps me focused on the downside response as the price fails to break decisively above the recent high on the fifteen-minute chart. The setup is being held in place by bearish context across the higher timeframes. For this bearish view to get stronger, I need a definitive dip below the current floor, otherwise, a move over that last swing high cancels the bias.
Execution plan (DOGEUSDT — SHORT)
Entry: 0.06974 - 0.06992 | SL: 0.07060
Take profit: 0.06906 → 0.06844 → 0.06766
Worth tracking from here, or does the range still need more time?
#TradeSetup
Execution plan (DOGEUSDT — SHORT)
Entry: 0.06974 - 0.06992 | SL: 0.07060
Take profit: 0.06906 → 0.06844 → 0.06766
Worth tracking from here, or does the range still need more time?
#TradeSetup
3
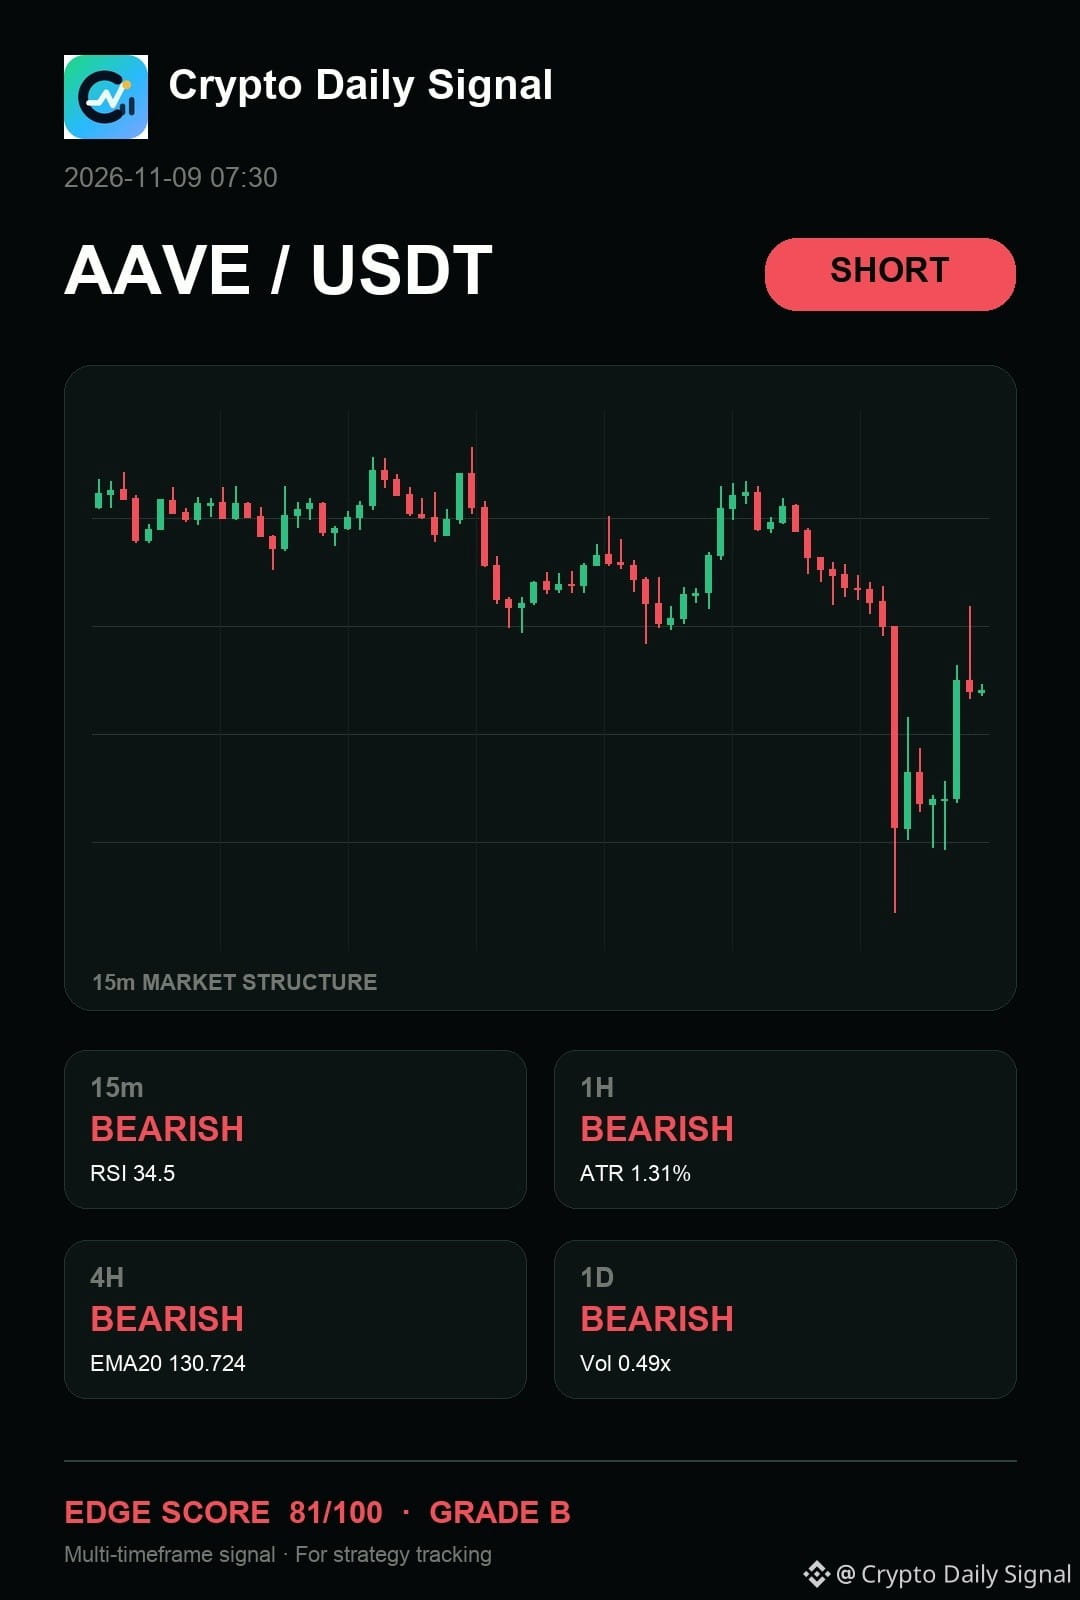
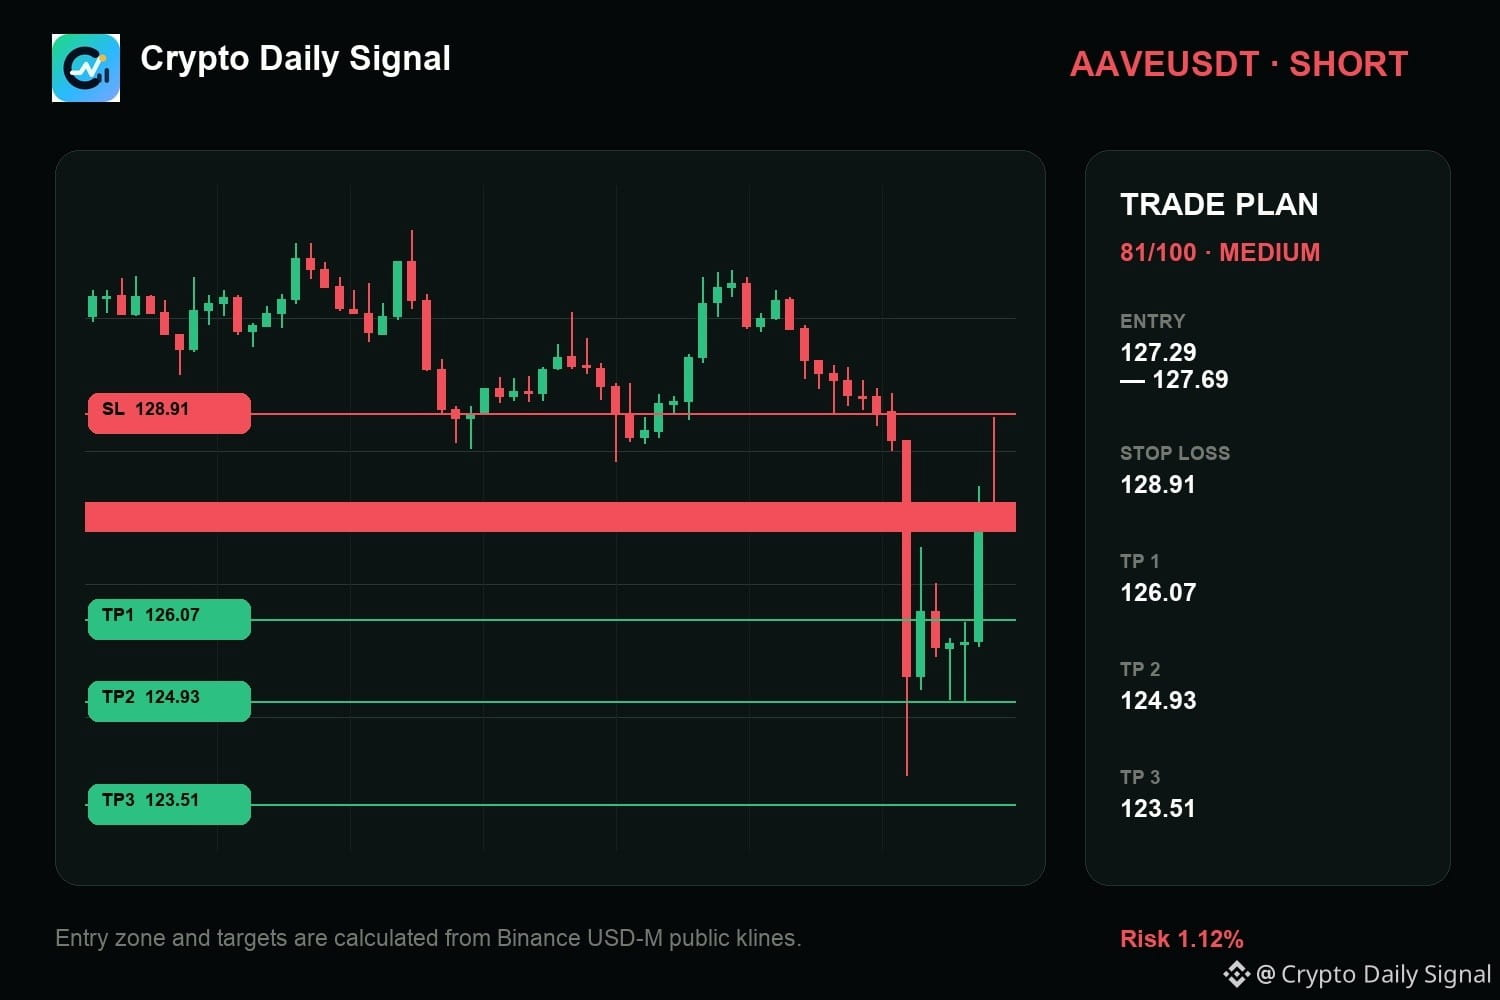
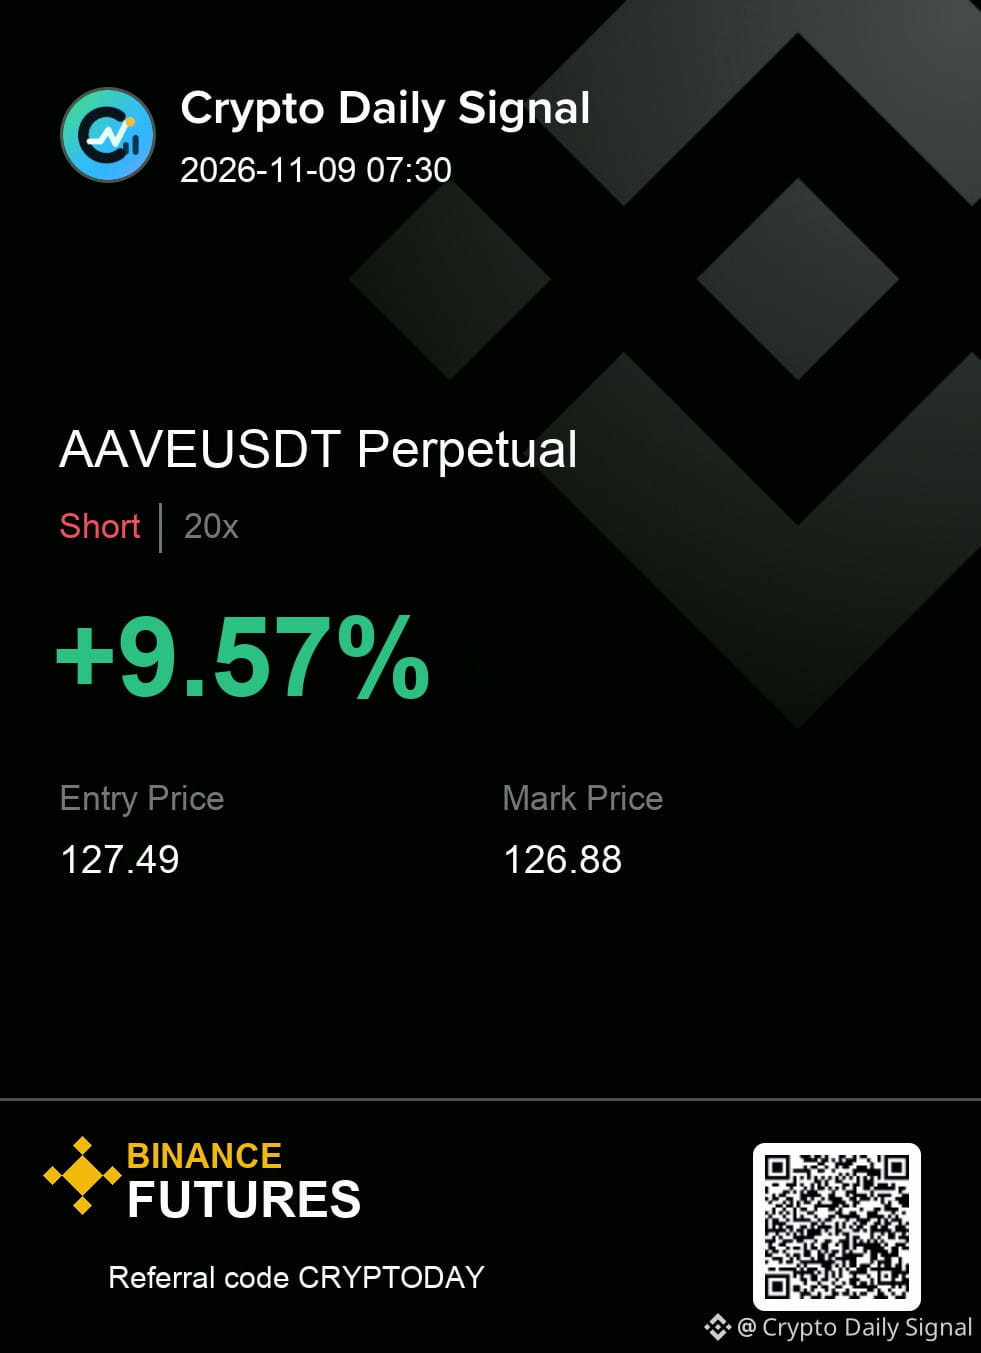
$AAVE — honestly, the chart still says it is a patience trade on the short side, showing clear lower highs and lower lows within its trading band. The price is currently testing that bottom boundary, and the overall bias looks negative across the shorter and longer timeframes. A real close under that range floor would be the signal to take the position, though a strong move back above the last peak negates the setup.
Clean enough to execute, or still too early for you?
SHORT plan for AAVEUSDT
127.29 - 127.69 entry | 128.91 stop
126.07 → 124.93 → 123.51
#TradeSetup
{future}(AAVEUSDT)
$AAVE — honestly, the chart still says it is a patience trade on the short side, showing clear lower highs and lower lows within its trading band. The price is currently testing that bottom boundary, and the overall bias looks negative across the shorter and longer timeframes. A real close under that range floor would be the signal to take the position, though a strong move back above the last peak negates the setup.
Clean enough to execute, or still too early for you?
SHORT plan for AAVEUSDT
127.29 - 127.69 entry | 128.91 stop
126.07 → 124.93 → 123.51
#TradeSetup
Clean enough to execute, or still too early for you?
SHORT plan for AAVEUSDT
127.29 - 127.69 entry | 128.91 stop
126.07 → 124.93 → 123.51
#TradeSetup
7
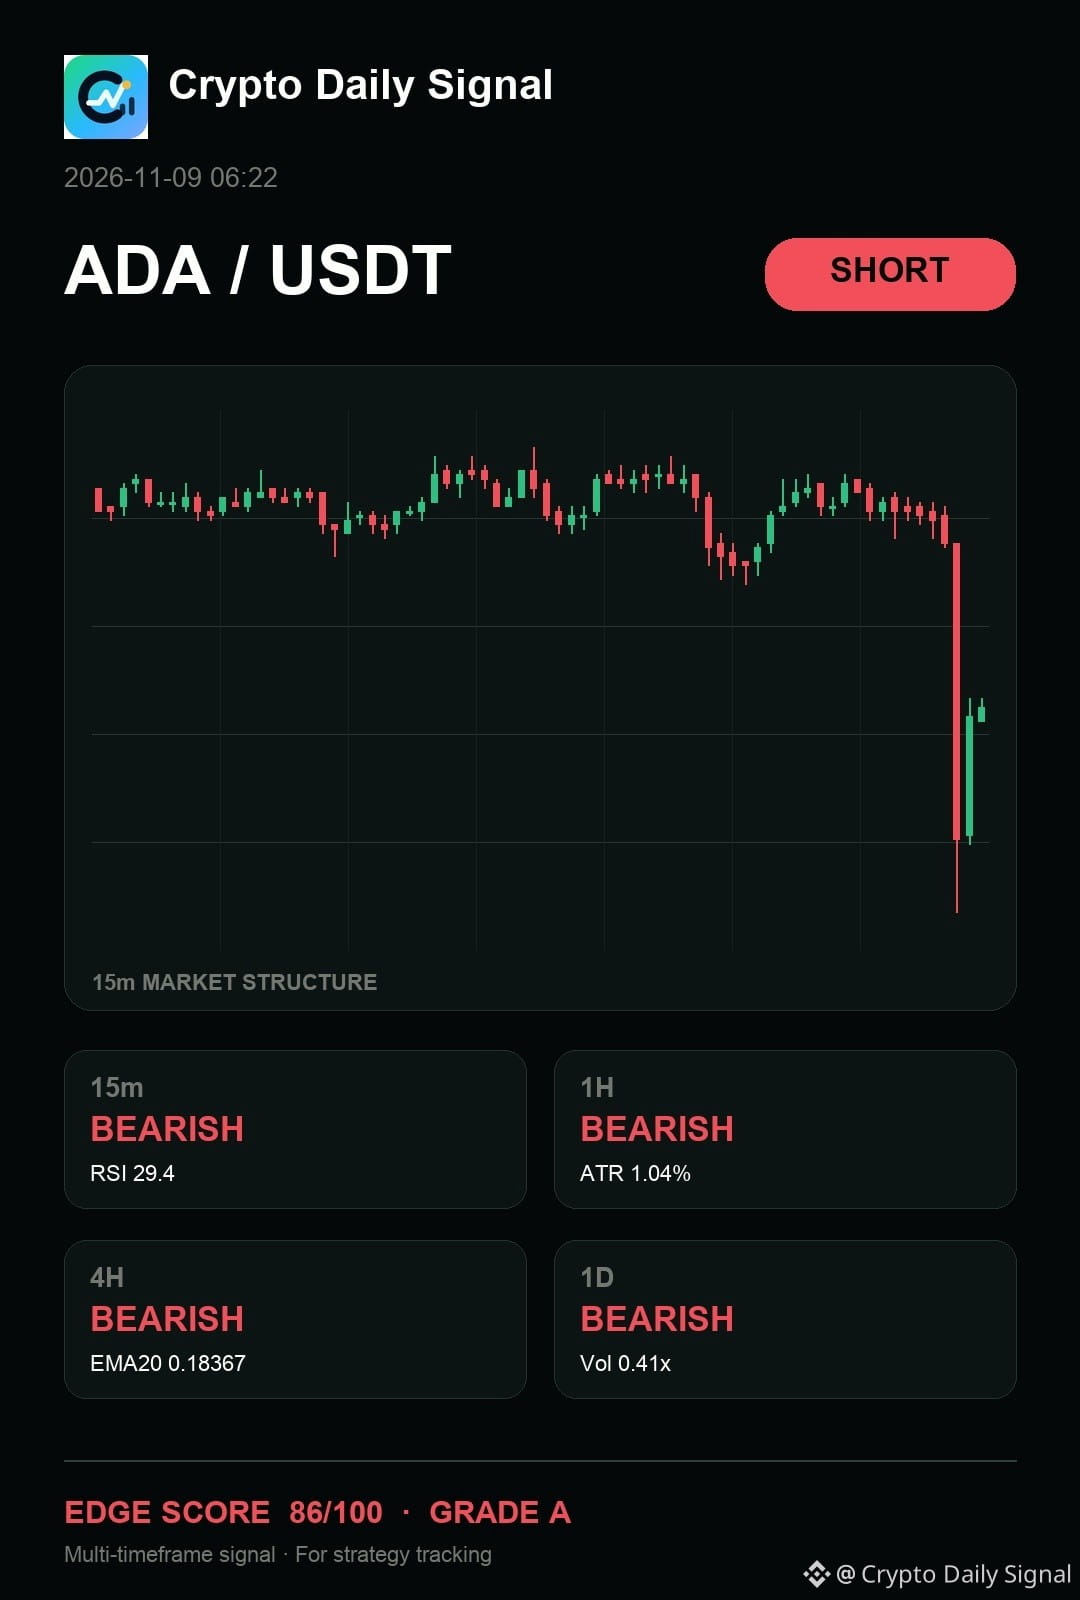
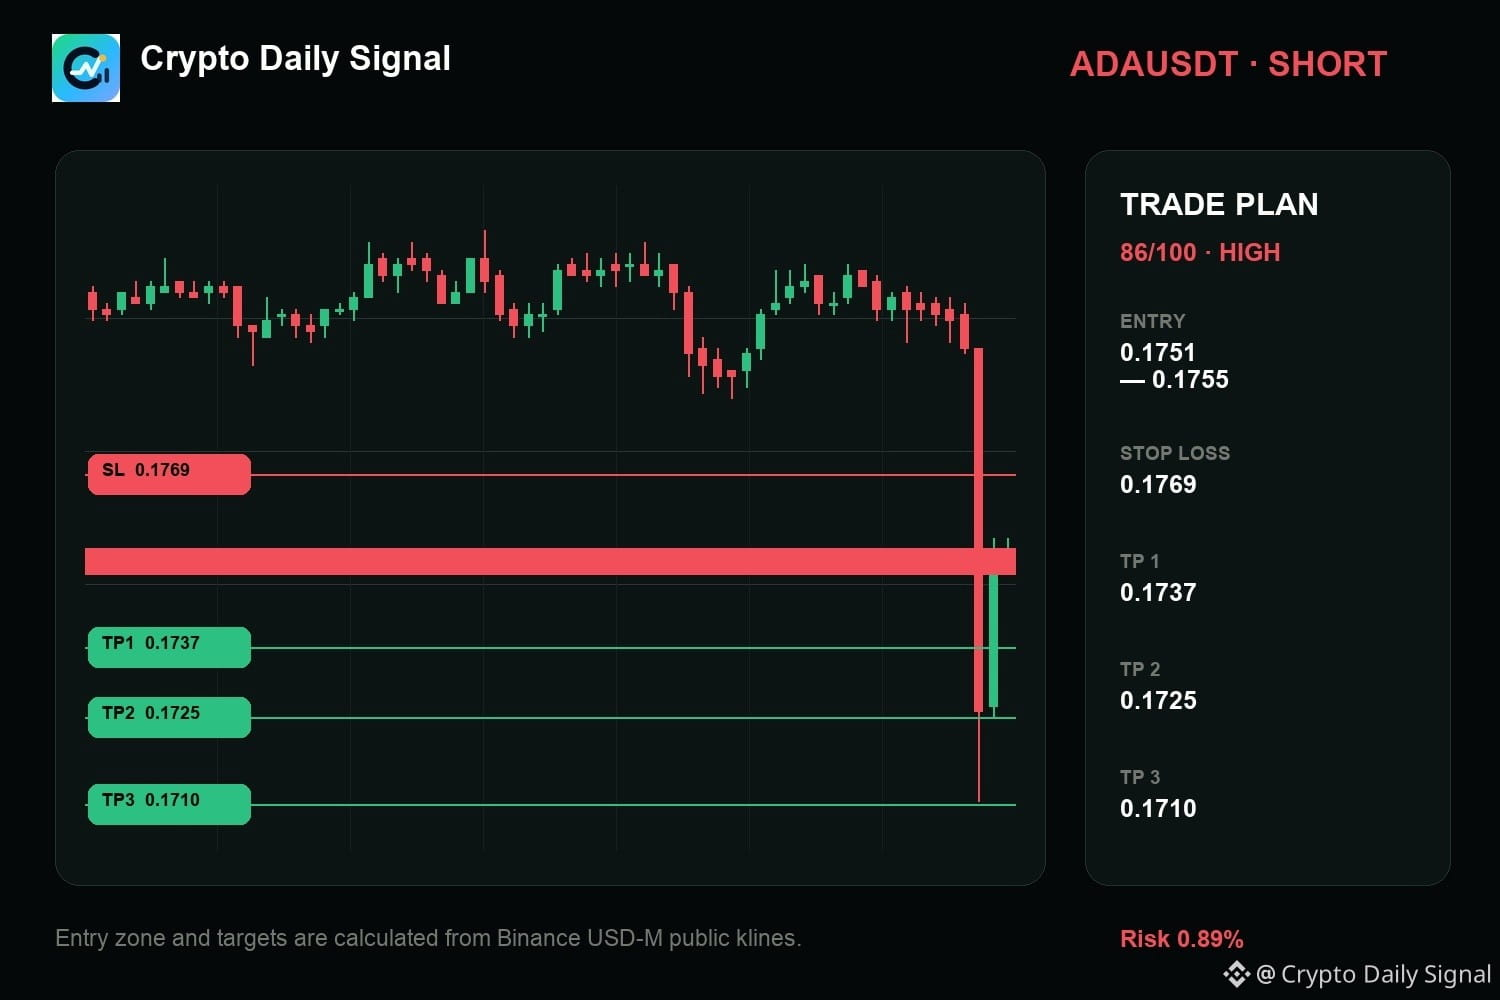
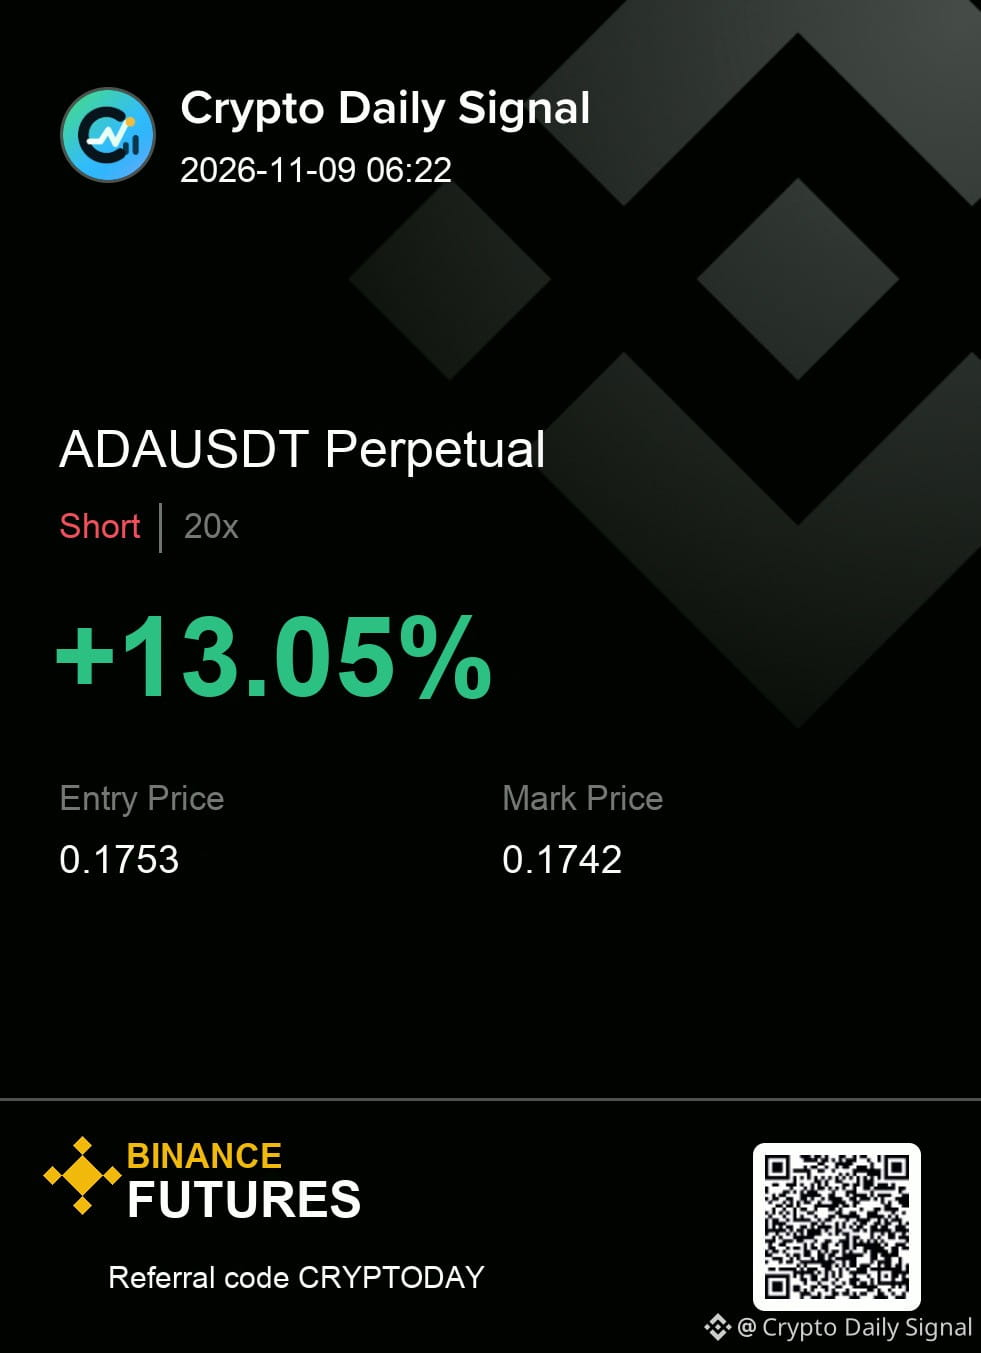
$ADA — the way I see this move, it keeps me focused on the downside response despite some talk of it holding at recent resistance. The clear pattern here is multiple lower highs forming as the short-term momentum stays bearish across lower timeframes. The general bearish bias holds up because the daily trend supports this pattern, and a decisive breach below that immediate low would solidify the move.
ADAUSDT SHORT map
Entry → 0.1751 - 0.1755
SL → 0.1769
TP → 0.1737 · 0.1725 · 0.1710
#TradeSetup
{future}(ADAUSDT)
$ADA — the way I see this move, it keeps me focused on the downside response despite some talk of it holding at recent resistance. The clear pattern here is multiple lower highs forming as the short-term momentum stays bearish across lower timeframes. The general bearish bias holds up because the daily trend supports this pattern, and a decisive breach below that immediate low would solidify the move.
ADAUSDT SHORT map
Entry → 0.1751 - 0.1755
SL → 0.1769
TP → 0.1737 · 0.1725 · 0.1710
#TradeSetup
ADAUSDT SHORT map
Entry → 0.1751 - 0.1755
SL → 0.1769
TP → 0.1737 · 0.1725 · 0.1710
#TradeSetup
3
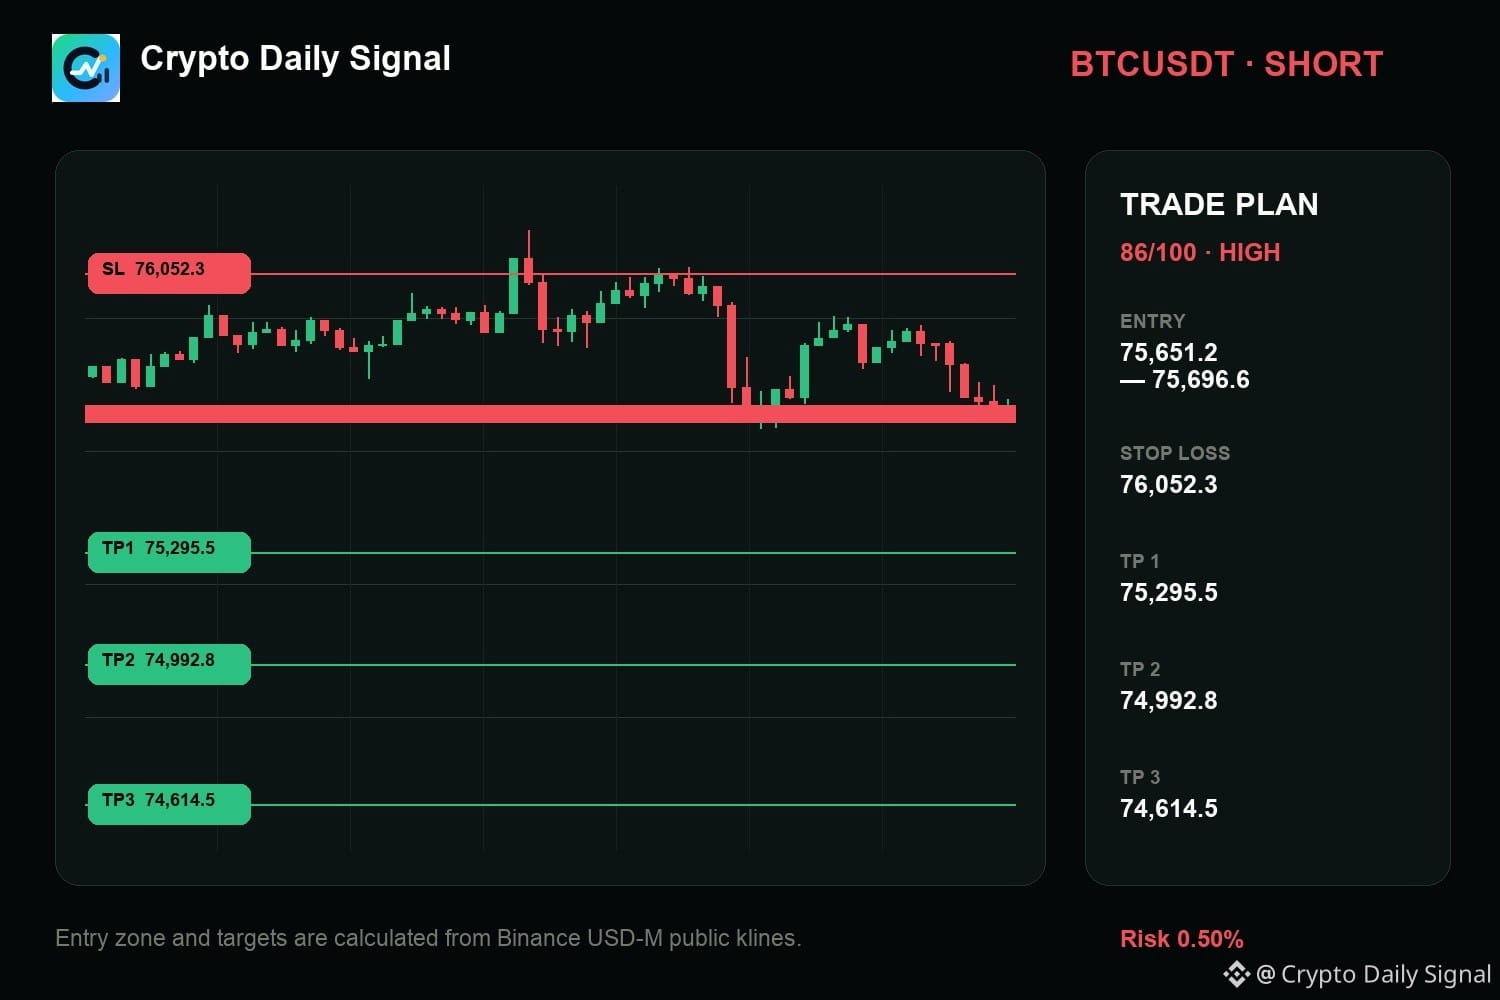
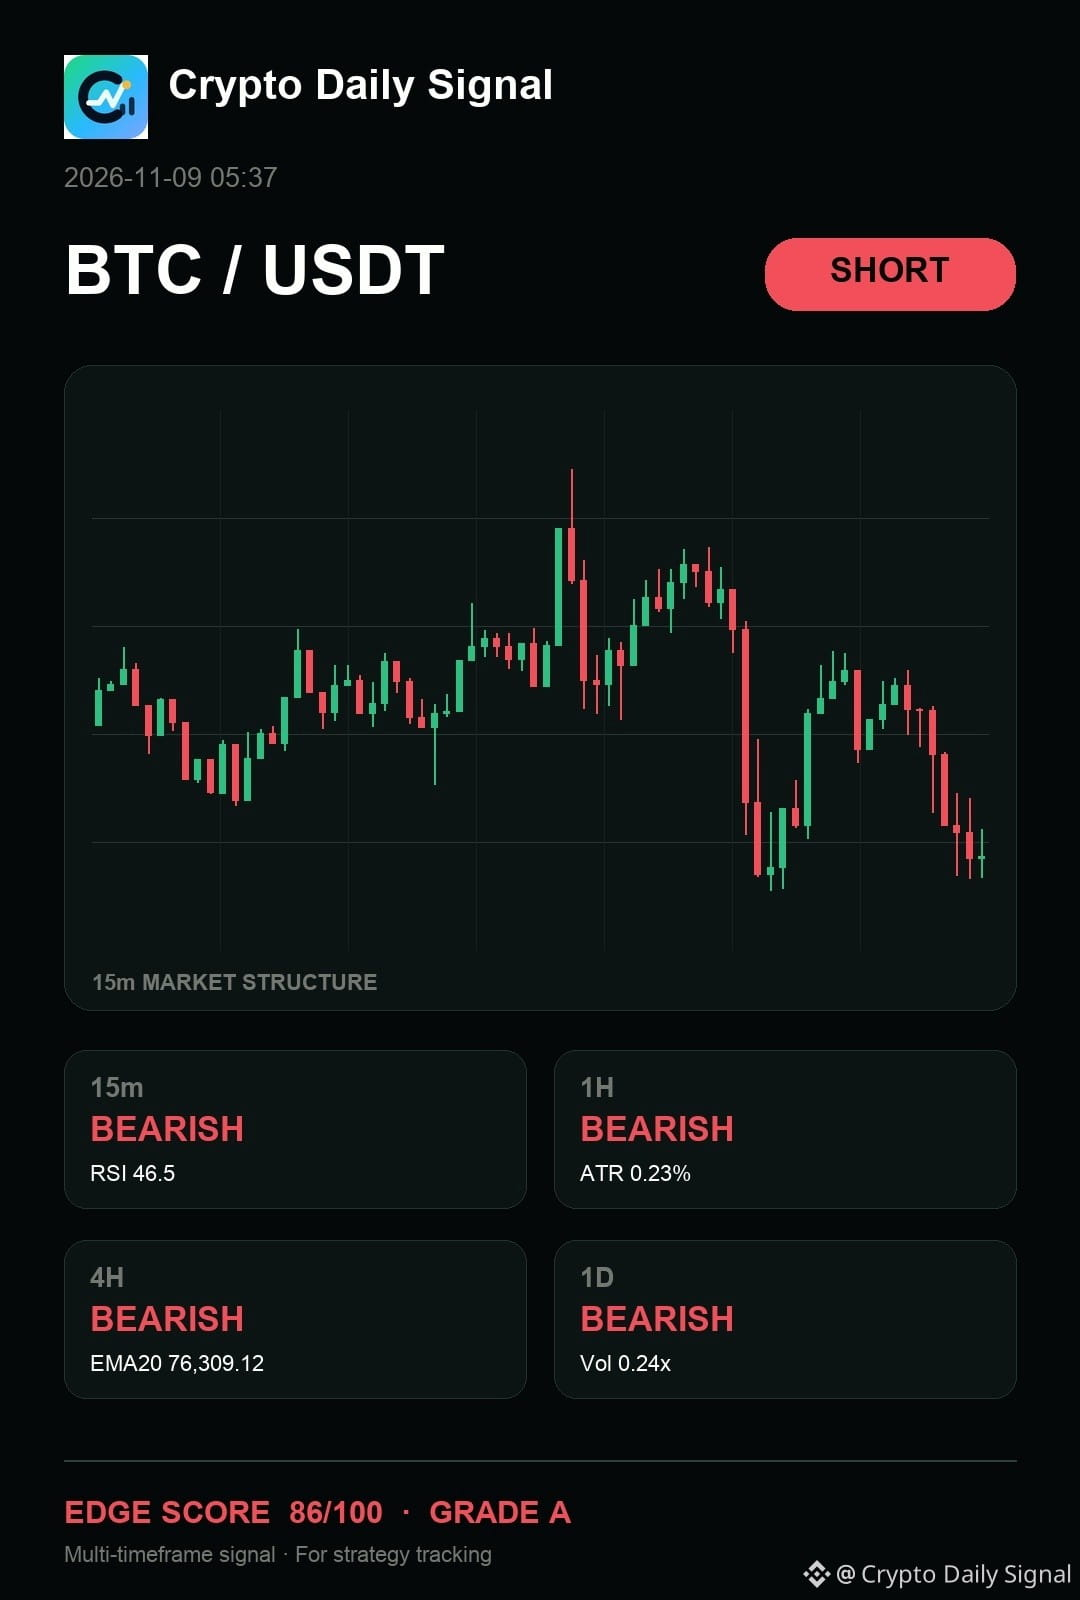
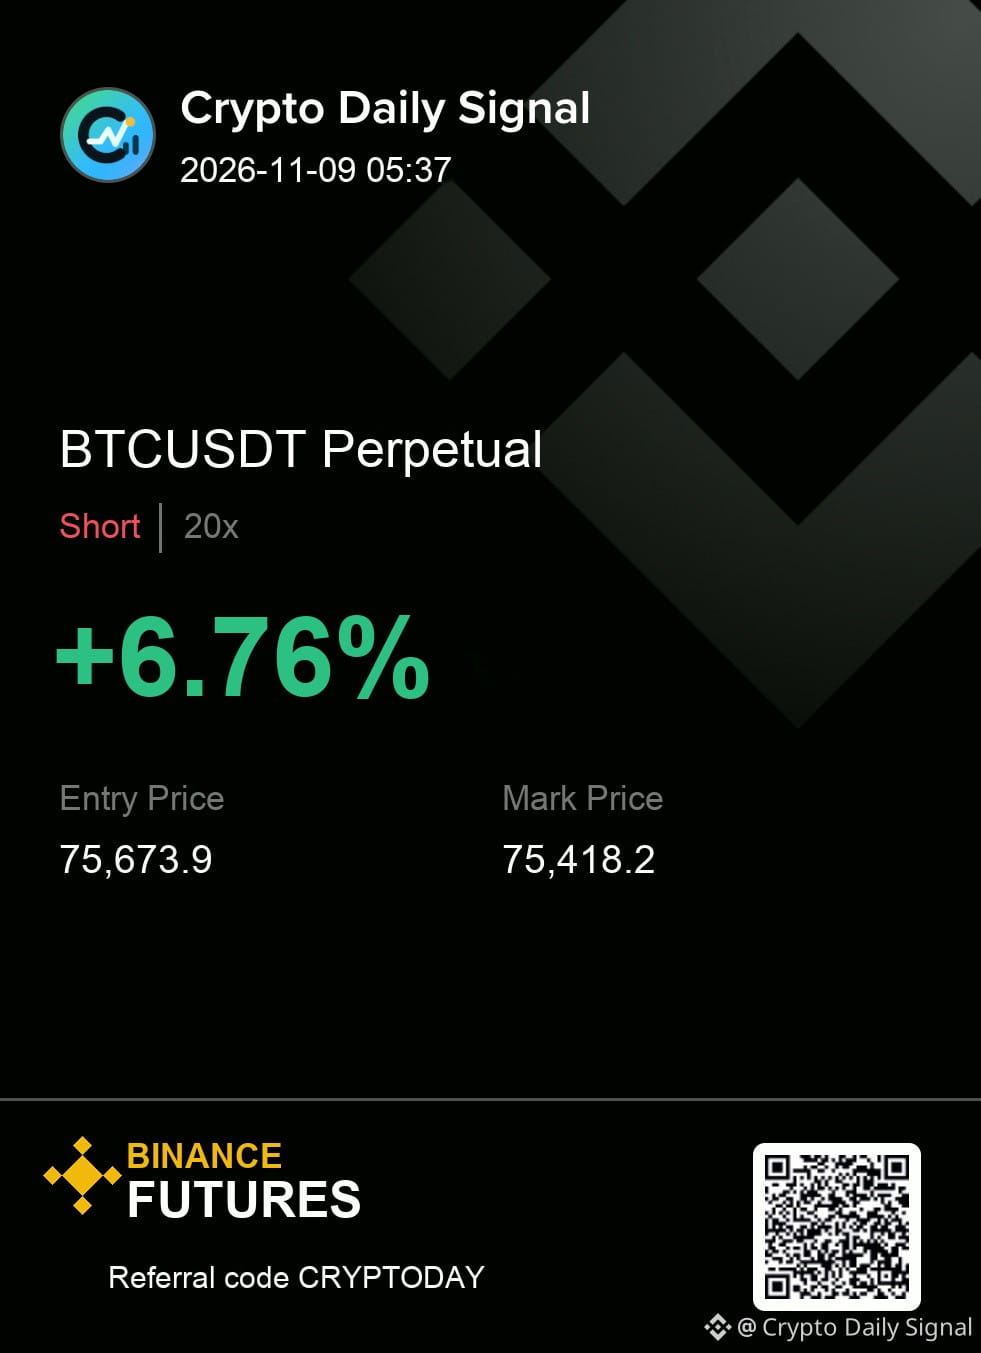
$BTC is still tilted toward sellers as it hovers within a clear trading band. The short-term momentum suggests caution, though the bigger picture across the daily and four-hour charts maintains a bearish slant. A break below the low of this recent range would signal selling pressure is in charge. Anything pushing the price solidly above that upper boundary complicates the bearish argument.
The map is useful only while the invalidation remains intact.
BTCUSDT SHORT
IN 75,651.2 - 75,696.6
OUT 76,052.3
TP 75,295.5 · 74,992.8 · 74,614.5
#TradeSetup
{future}(BTCUSDT)
$BTC is still tilted toward sellers as it hovers within a clear trading band. The short-term momentum suggests caution, though the bigger picture across the daily and four-hour charts maintains a bearish slant. A break below the low of this recent range would signal selling pressure is in charge. Anything pushing the price solidly above that upper boundary complicates the bearish argument.
The map is useful only while the invalidation remains intact.
BTCUSDT SHORT
IN 75,651.2 - 75,696.6
OUT 76,052.3
TP 75,295.5 · 74,992.8 · 74,614.5
#TradeSetup
The map is useful only while the invalidation remains intact.
BTCUSDT SHORT
IN 75,651.2 - 75,696.6
OUT 76,052.3
TP 75,295.5 · 74,992.8 · 74,614.5
#TradeSetup
4
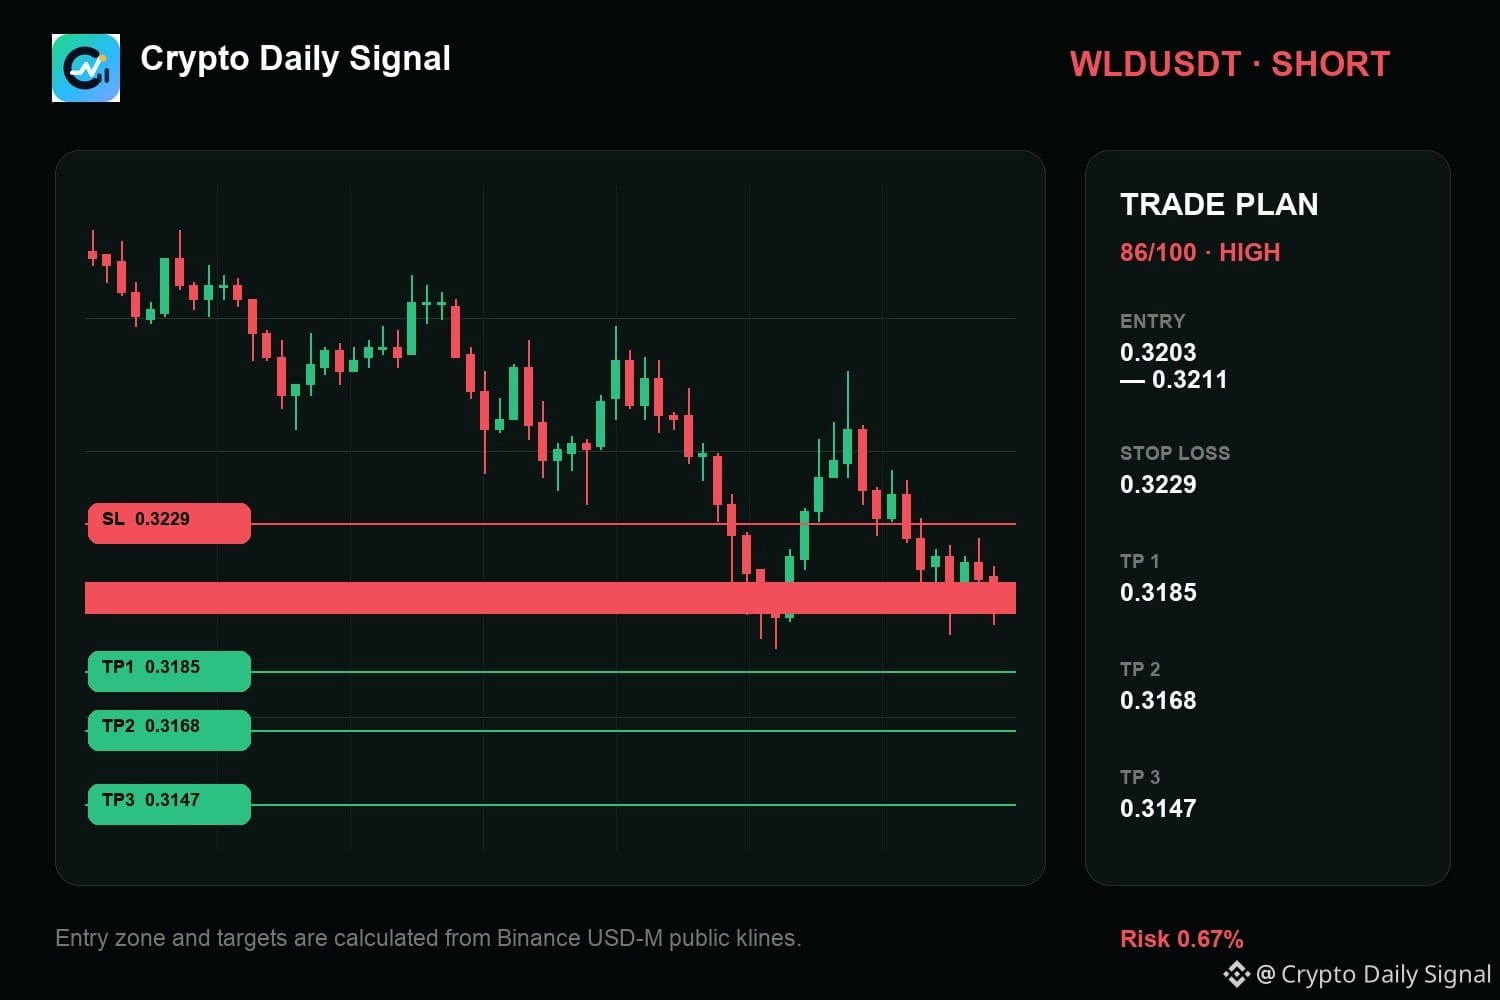
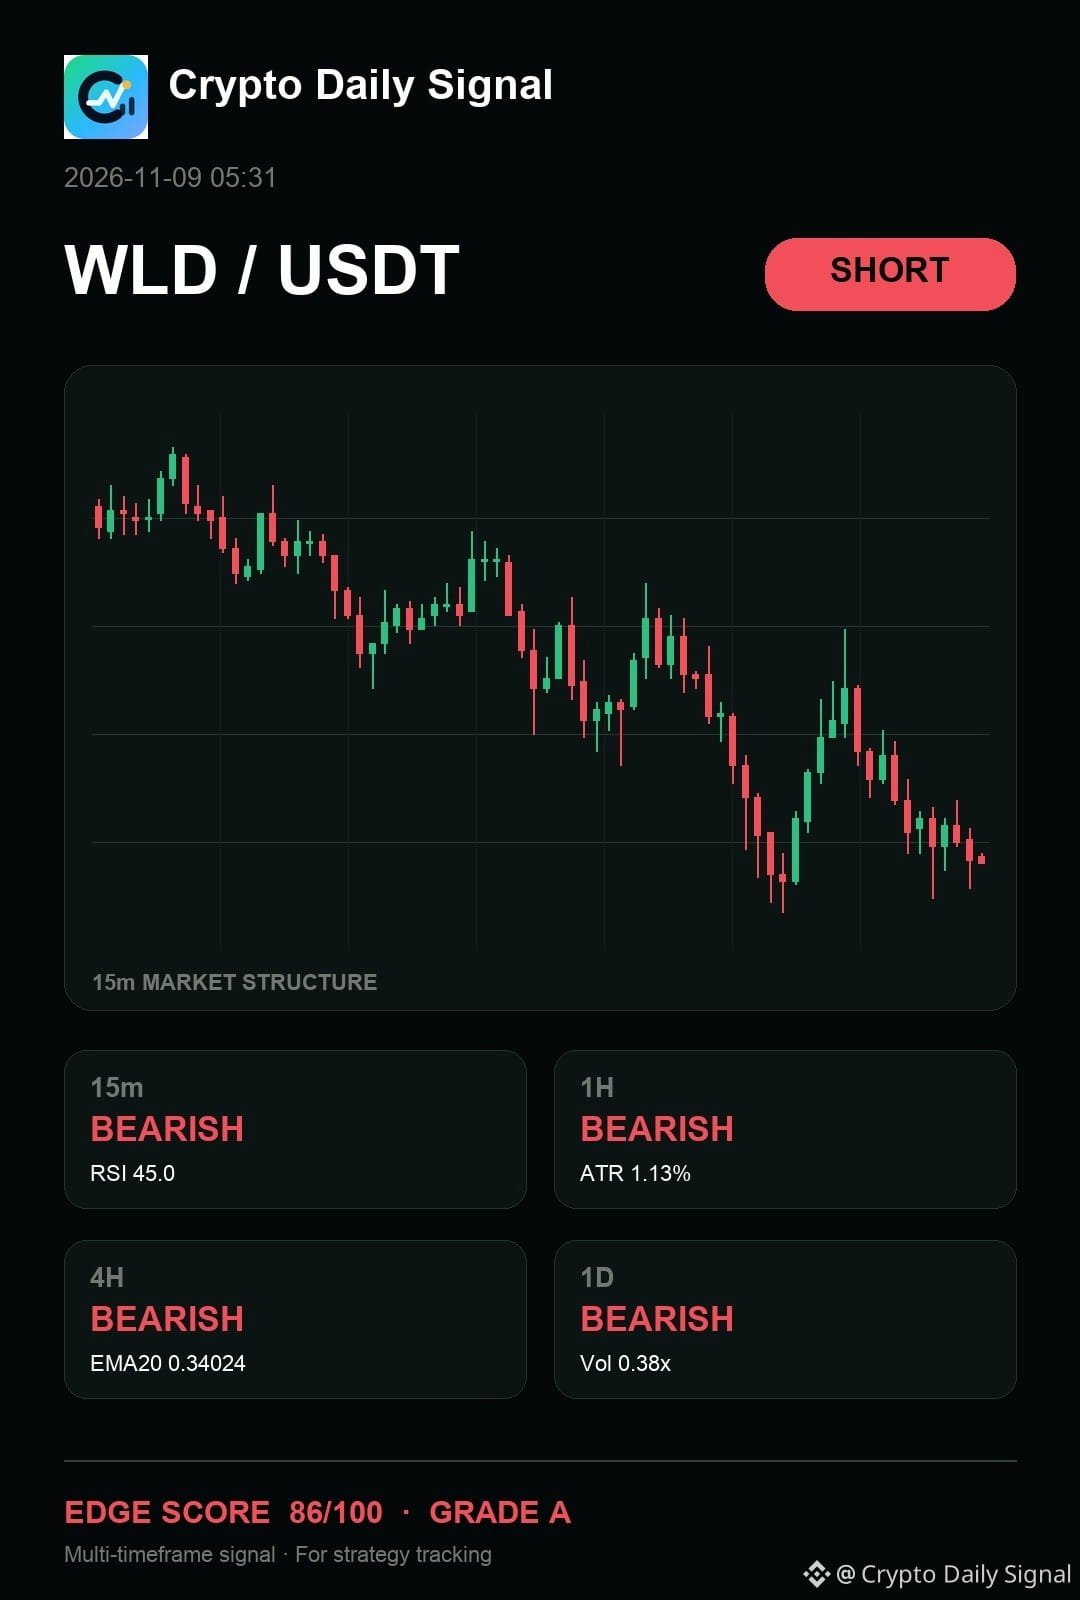
$WLD — quick take, I still think it needs confirmation before I press the short. The price is respecting the top of the recent trading range while lower highs keep appearing on the short-term chart. A break below the immediate low would cement this bearish direction.
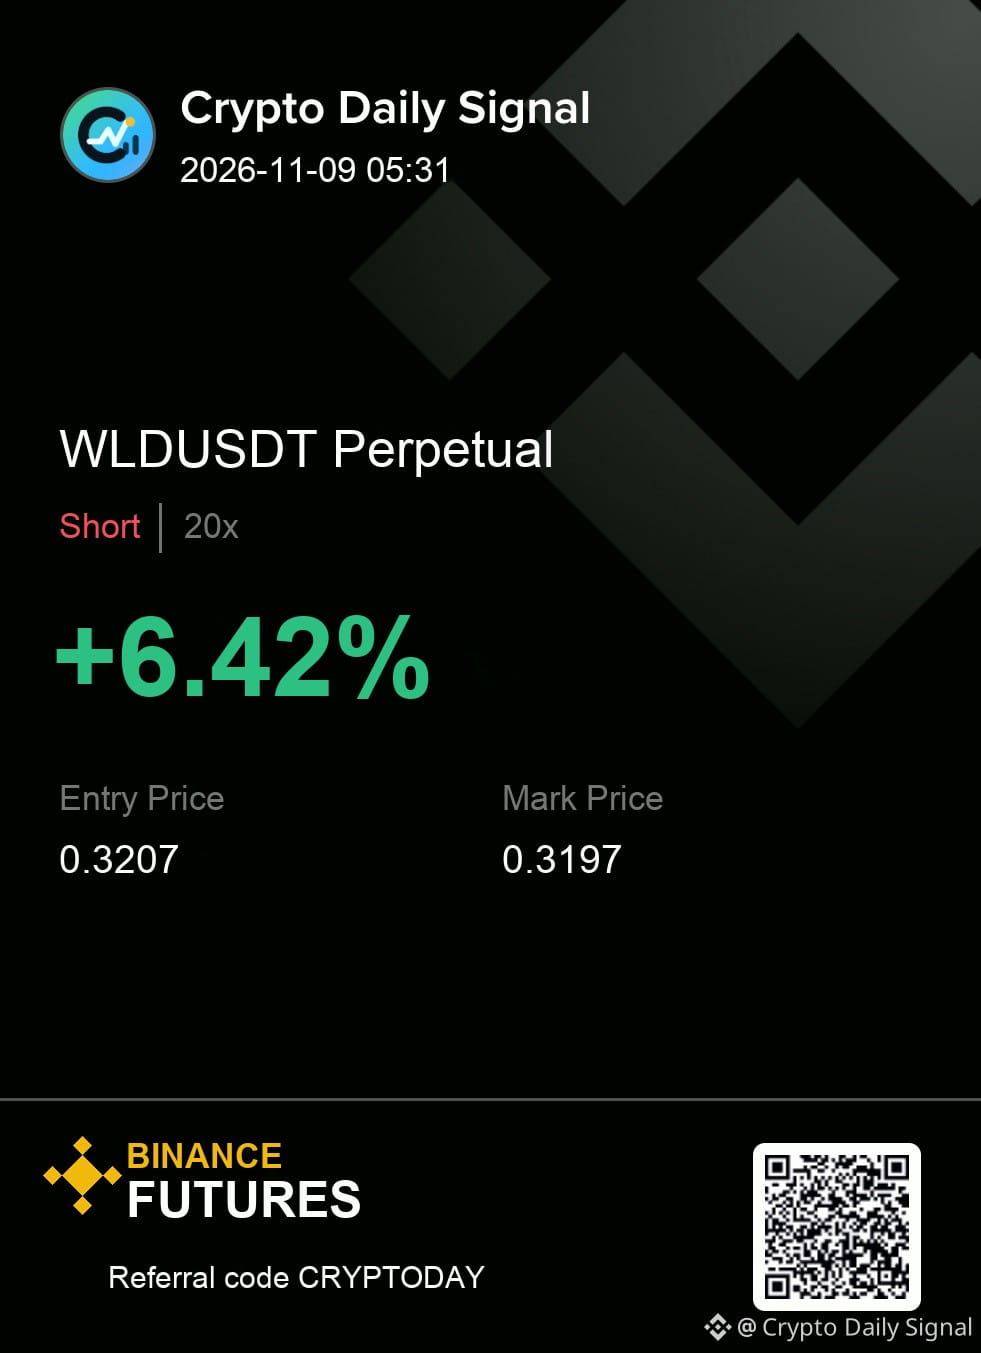
My levels for WLDUSDT — SHORT
Entry zone 0.3203 - 0.3211
Risk line 0.3229
Targets 0.3185 / 0.3168 / 0.3147
Confirmation first or early entry — which side of that trade-off are you on?
#TradeSetup
{future}(WLDUSDT)
$WLD — quick take, I still think it needs confirmation before I press the short. The price is respecting the top of the recent trading range while lower highs keep appearing on the short-term chart. A break below the immediate low would cement this bearish direction.
My levels for WLDUSDT — SHORT
Entry zone 0.3203 - 0.3211
Risk line 0.3229
Targets 0.3185 / 0.3168 / 0.3147
Confirmation first or early entry — which side of that trade-off are you on?
#TradeSetup
My levels for WLDUSDT — SHORT
Entry zone 0.3203 - 0.3211
Risk line 0.3229
Targets 0.3185 / 0.3168 / 0.3147
Confirmation first or early entry — which side of that trade-off are you on?
#TradeSetup
3
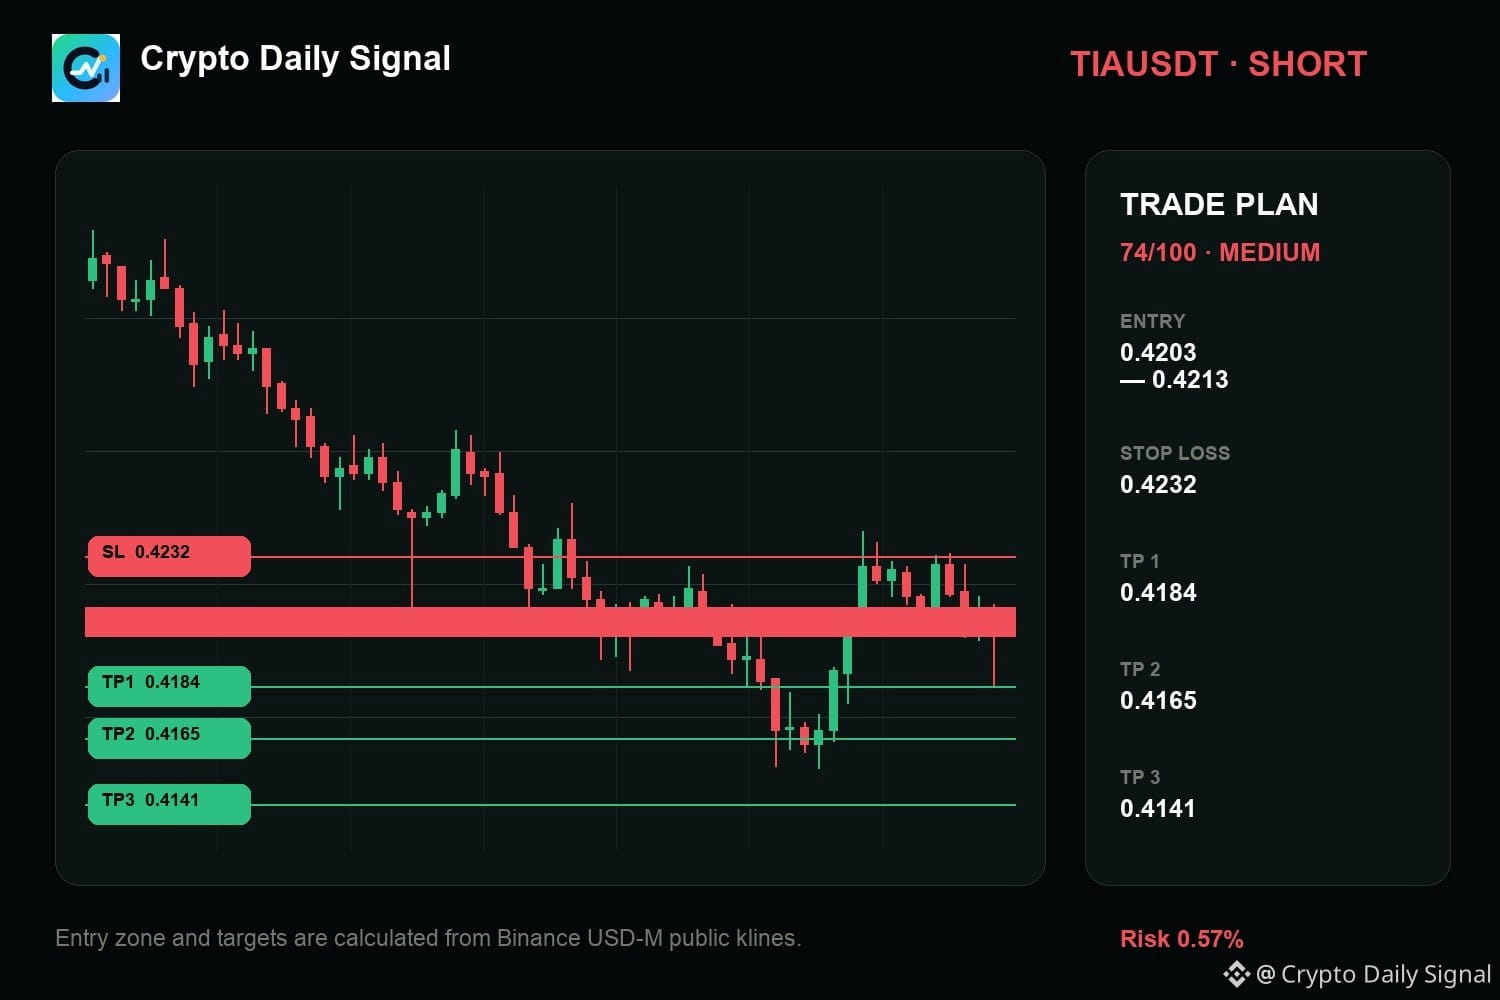
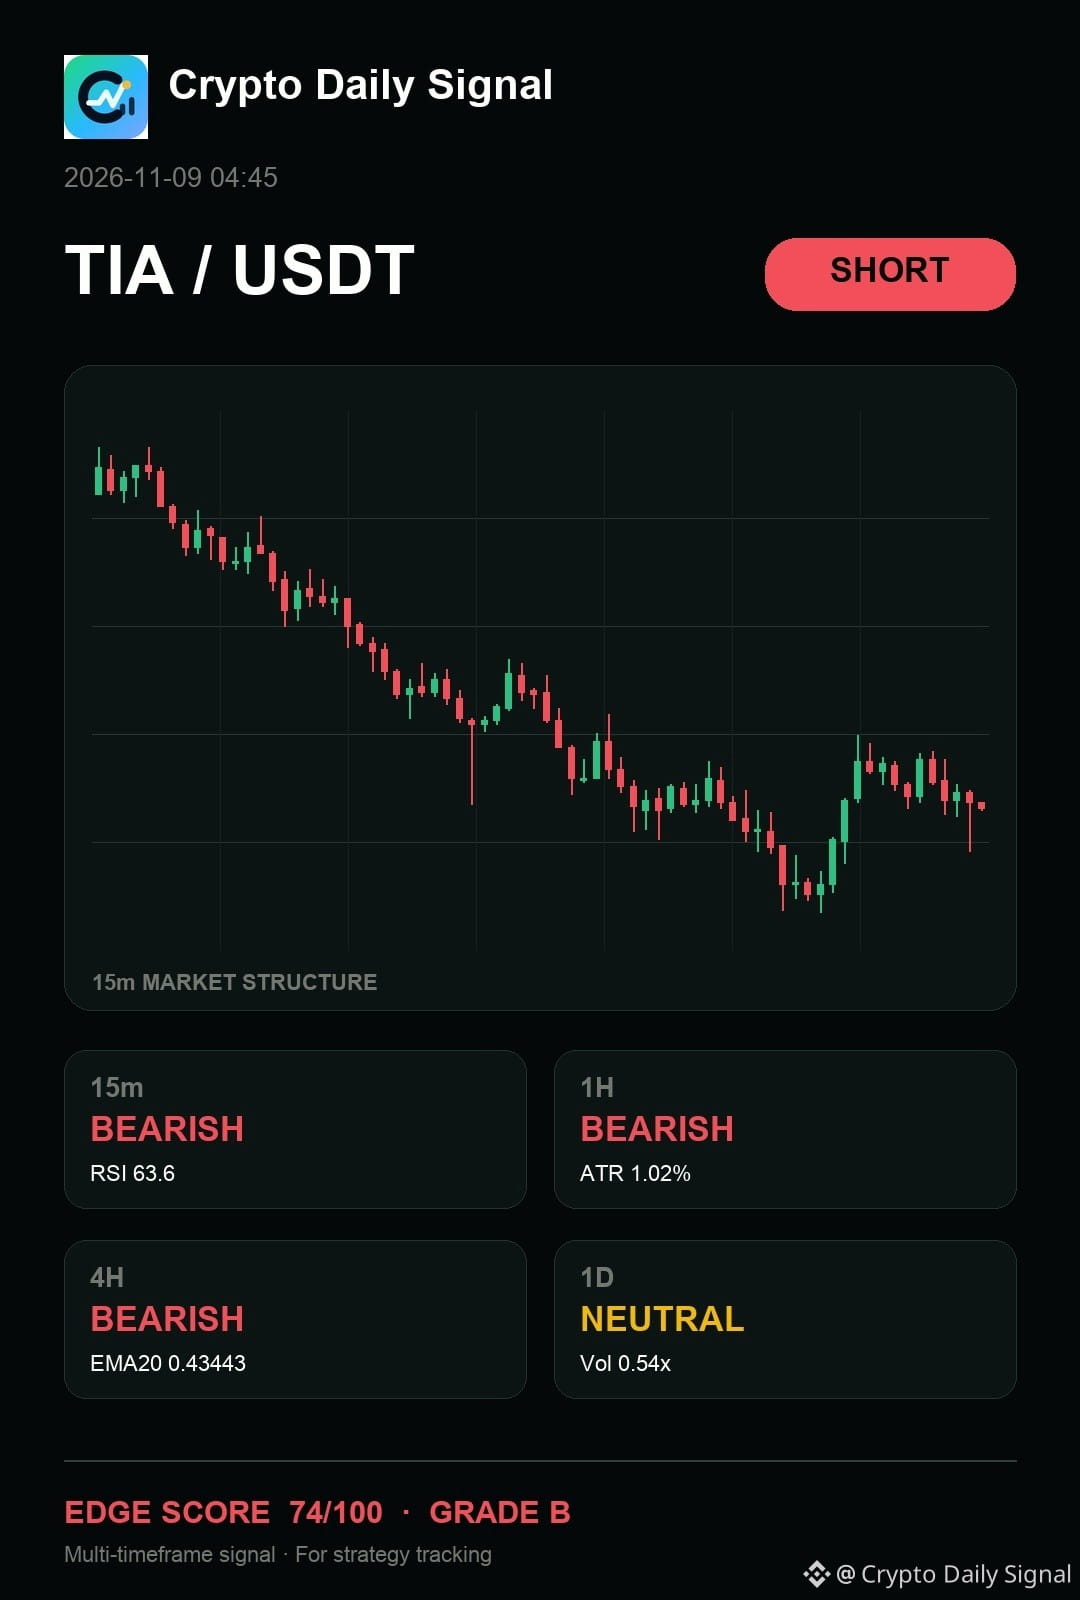
$TIA — bro, here's my read: it remains a short watch for me because the recent price swings show a pattern of lower highs, confirming continued selling pressure. The current move below the descending line supports the short view. A cleaner signal would be a drop below the recent low on heavy selling volume, otherwise the setup is still too fragile.
Execution plan (TIAUSDT — SHORT)
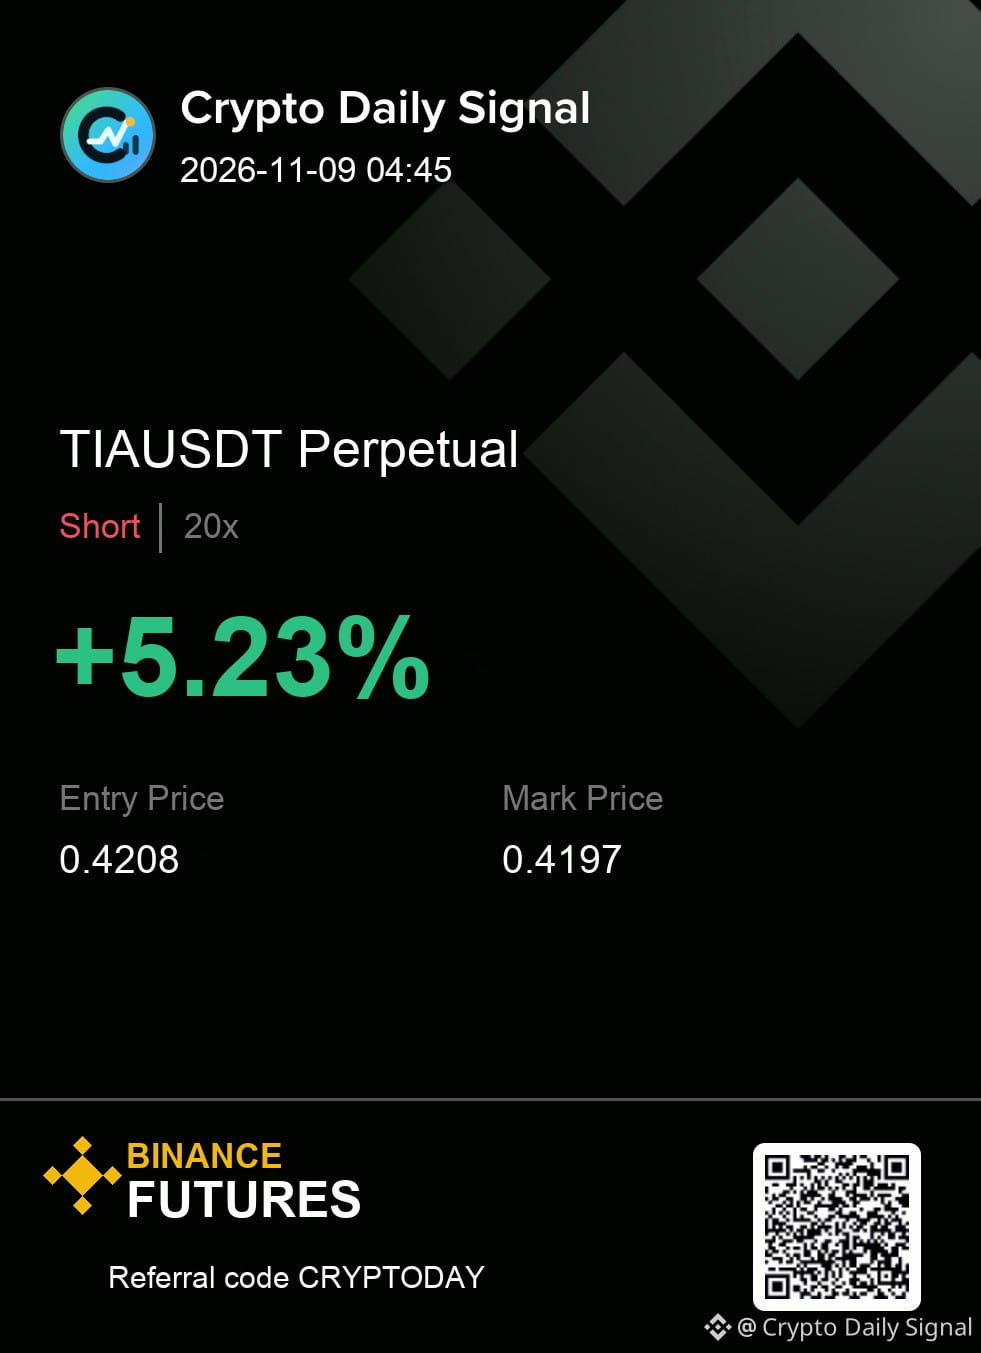
Entry: 0.4203 - 0.4213 | SL: 0.4232
Take profit: 0.4184 → 0.4165 → 0.4141
Execution is simple here: respect the zone and respect the cut.
#TradeSetup
{future}(TIAUSDT)
$TIA — bro, here's my read: it remains a short watch for me because the recent price swings show a pattern of lower highs, confirming continued selling pressure. The current move below the descending line supports the short view. A cleaner signal would be a drop below the recent low on heavy selling volume, otherwise the setup is still too fragile.
Execution plan (TIAUSDT — SHORT)
Entry: 0.4203 - 0.4213 | SL: 0.4232
Take profit: 0.4184 → 0.4165 → 0.4141
Execution is simple here: respect the zone and respect the cut.
#TradeSetup
Execution plan (TIAUSDT — SHORT)
Entry: 0.4203 - 0.4213 | SL: 0.4232
Take profit: 0.4184 → 0.4165 → 0.4141
Execution is simple here: respect the zone and respect the cut.
#TradeSetup
3
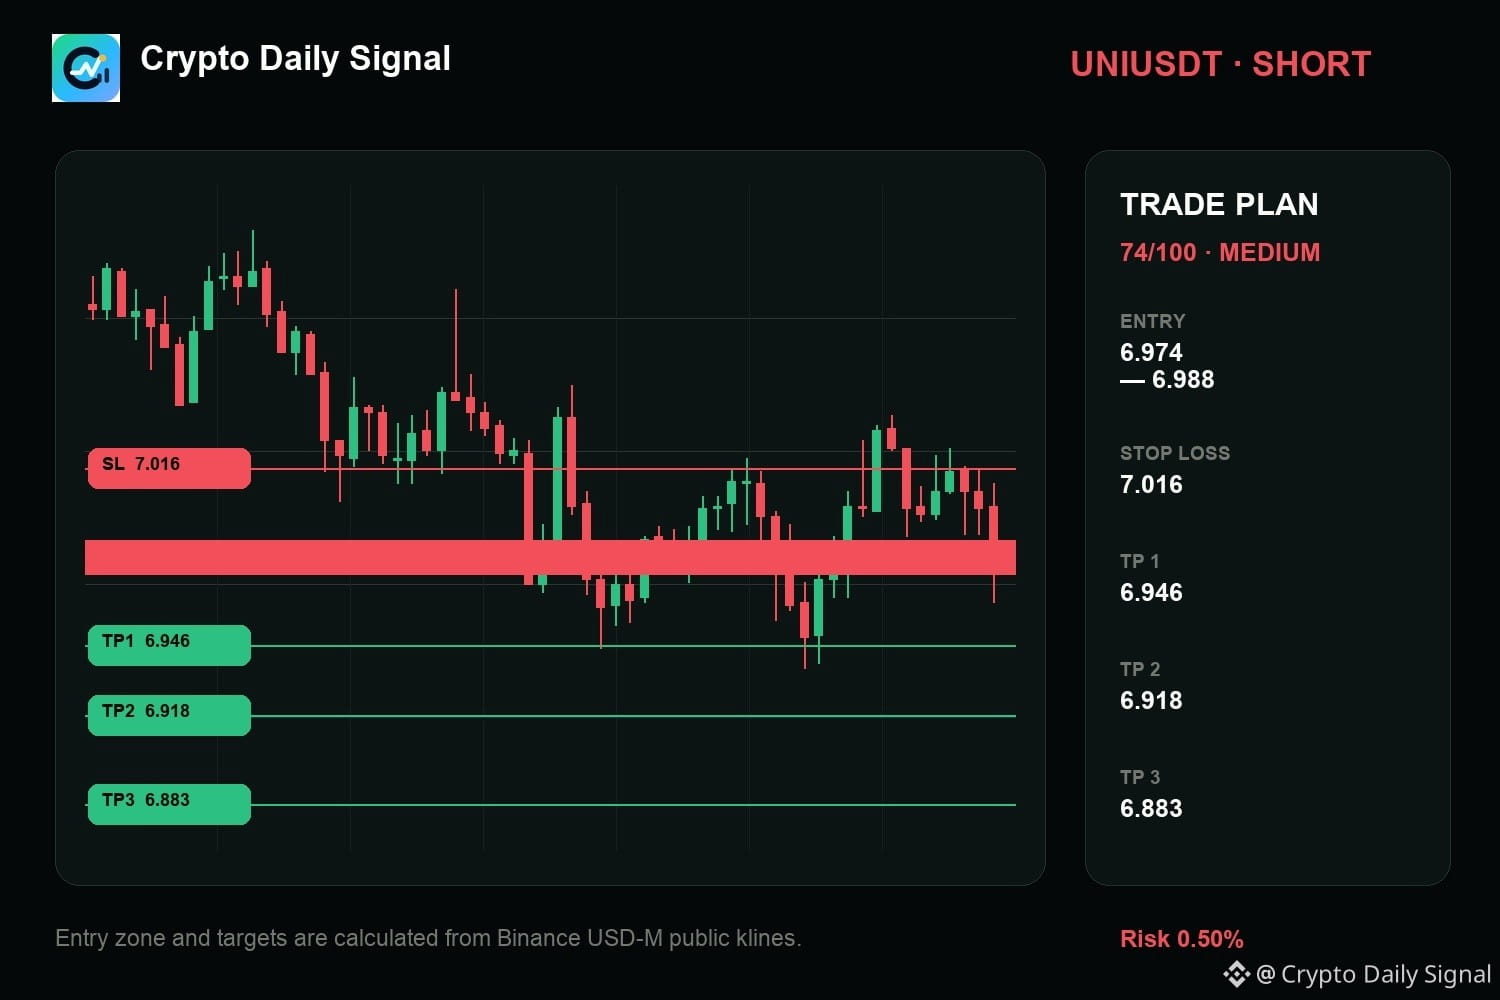
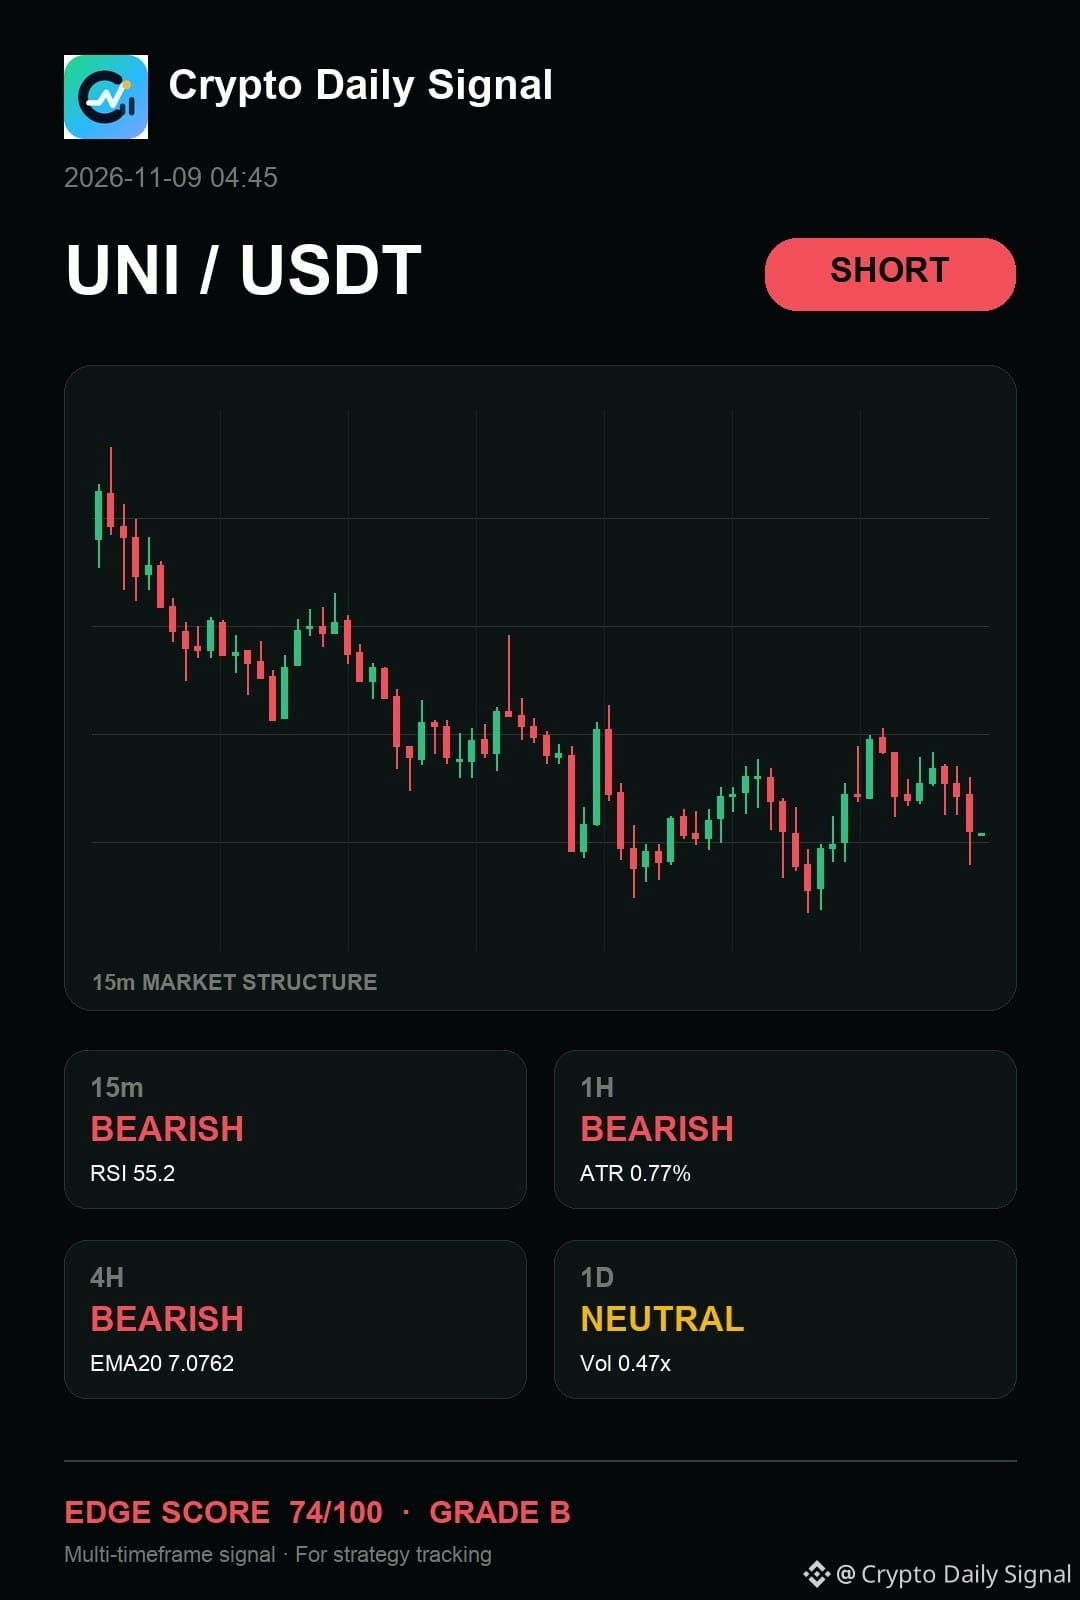
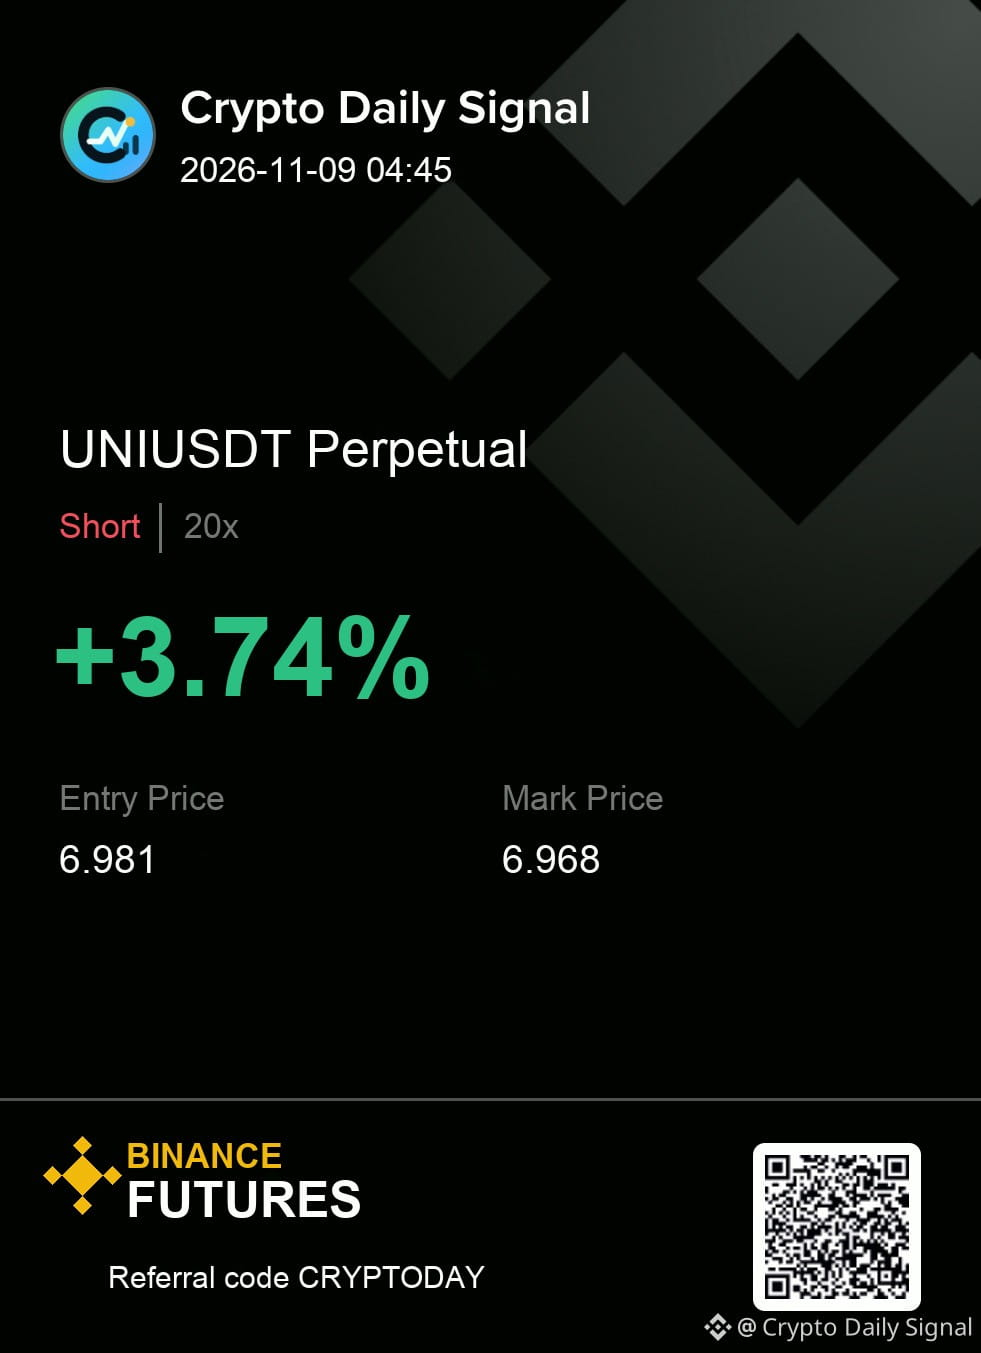
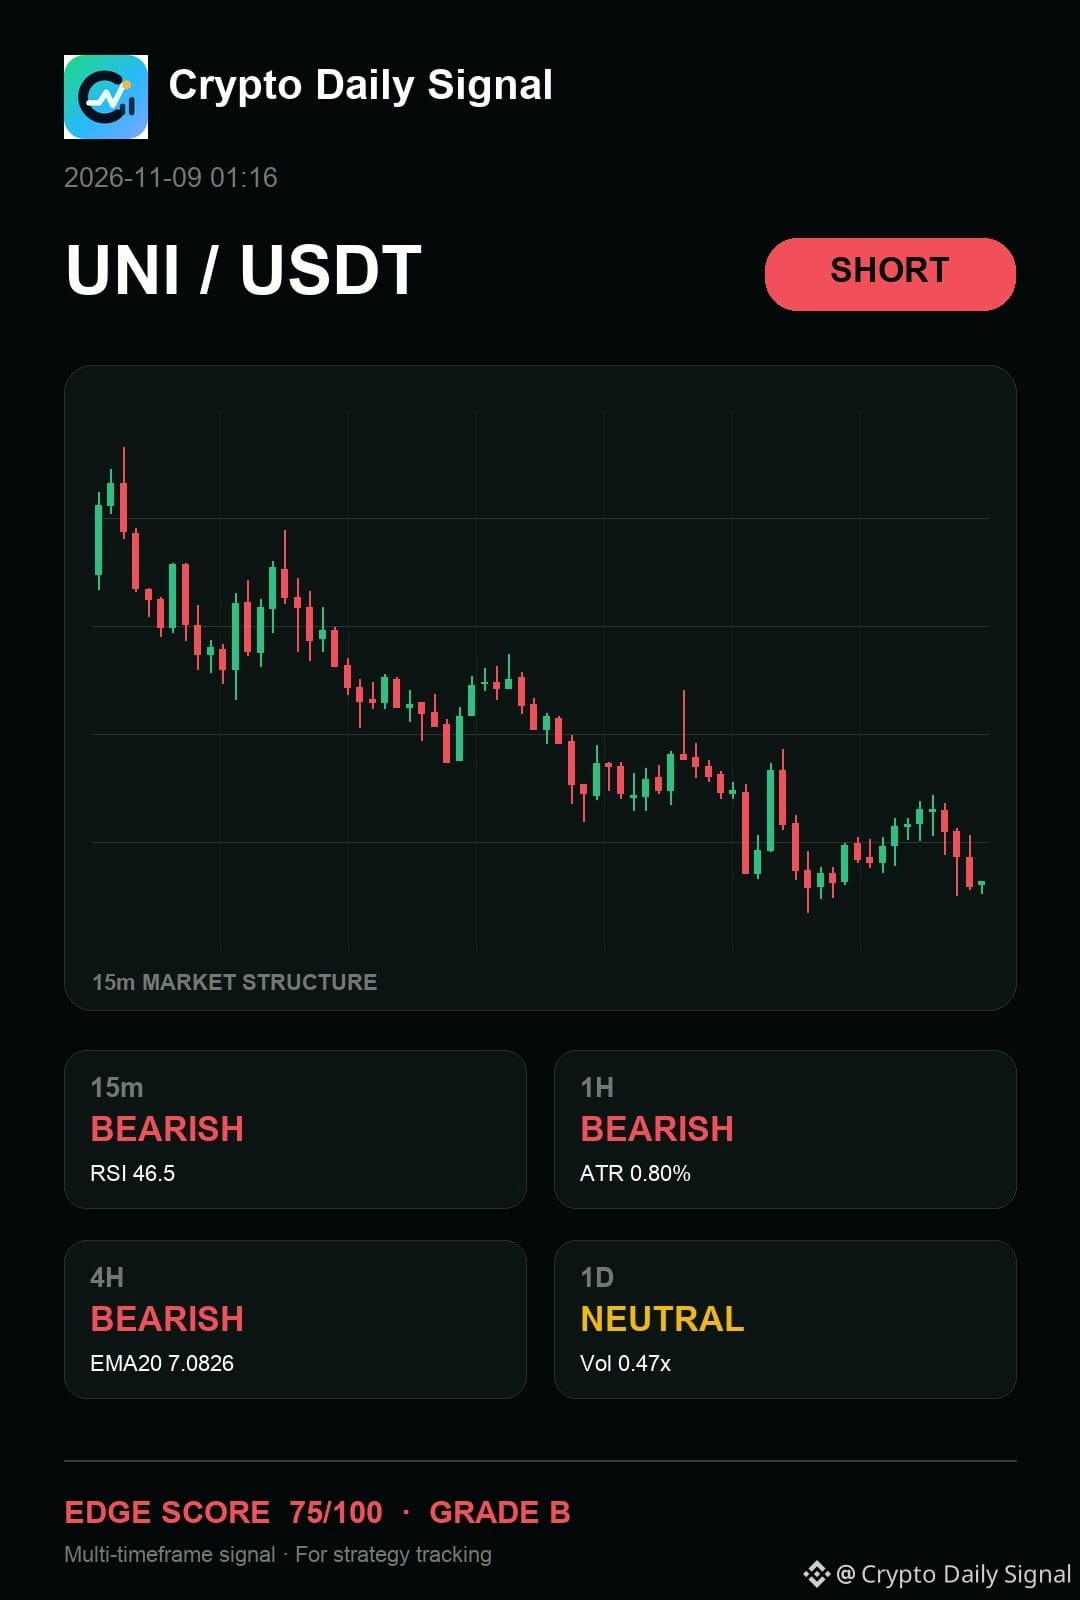
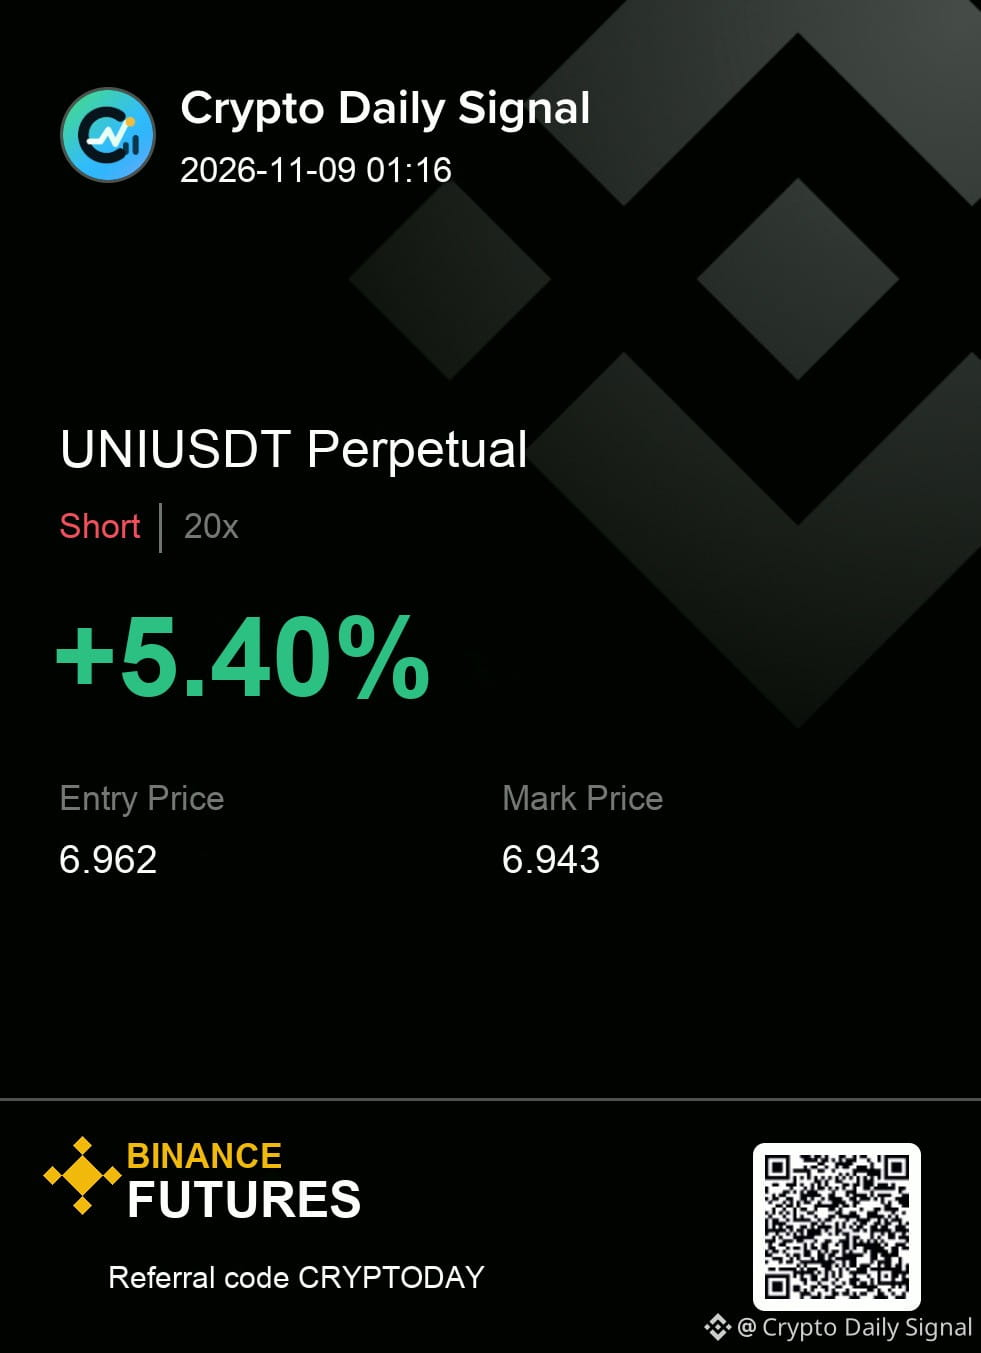
$UNI needs the sell-side reaction to confirm the bearish outlook. The formation of lower highs on the fifteen-minute chart supports this, and the four-hour and hourly trends lean down. A clear rejection below the current range floor would solidify the move, whereas a strong close above the local swing high would negate the short idea.
UNIUSDT | SHORT
Entry 6.974 - 6.988
Invalidation 7.016
Targets 6.946 / 6.918 / 6.883
#TradeSetup
{future}(UNIUSDT)
$UNI needs the sell-side reaction to confirm the bearish outlook. The formation of lower highs on the fifteen-minute chart supports this, and the four-hour and hourly trends lean down. A clear rejection below the current range floor would solidify the move, whereas a strong close above the local swing high would negate the short idea.
UNIUSDT | SHORT
Entry 6.974 - 6.988
Invalidation 7.016
Targets 6.946 / 6.918 / 6.883
#TradeSetup
UNIUSDT | SHORT
Entry 6.974 - 6.988
Invalidation 7.016
Targets 6.946 / 6.918 / 6.883
#TradeSetup
3
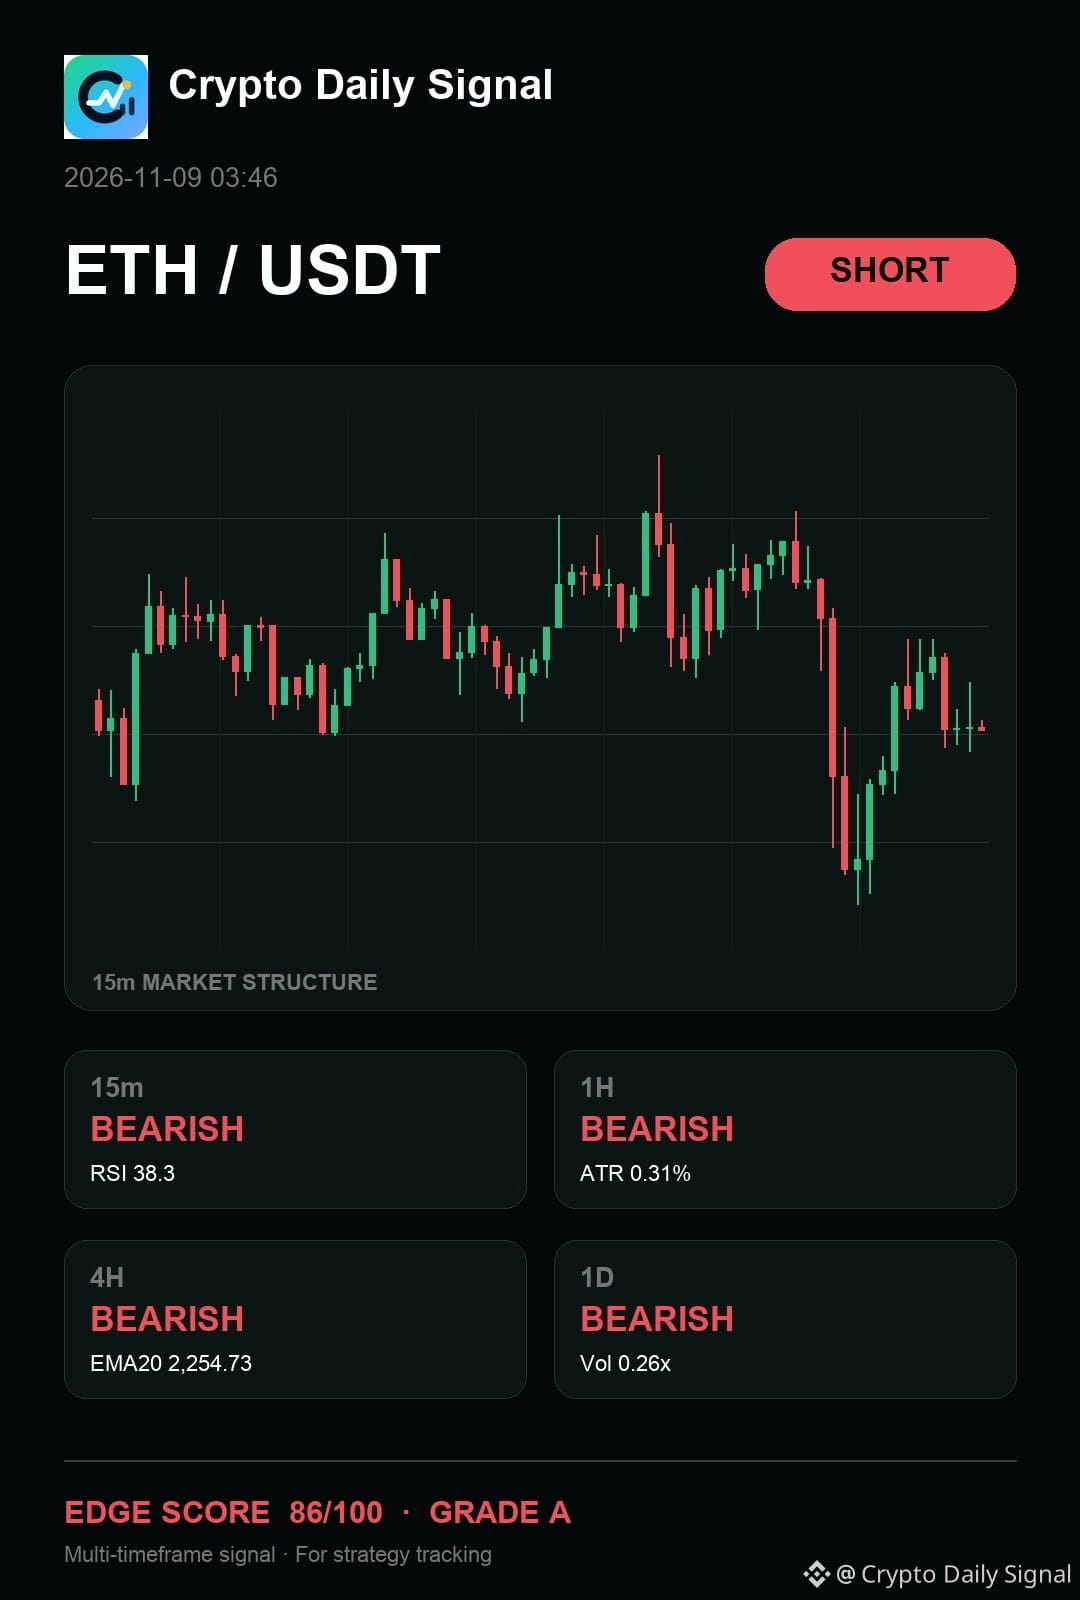
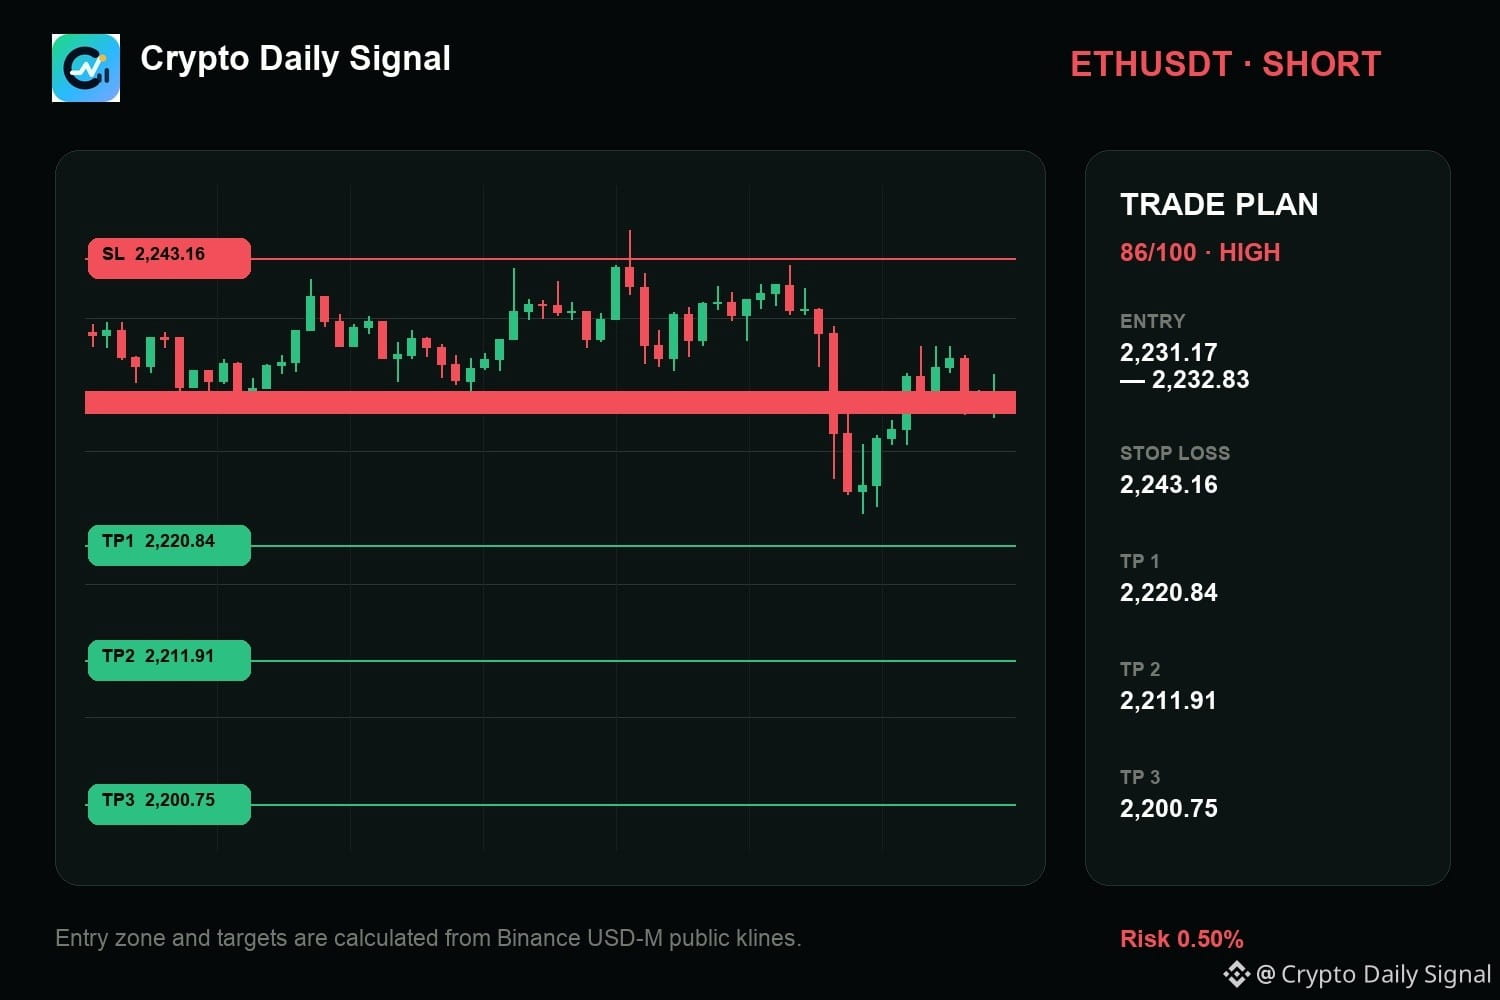
$ETH — tbh, I keep coming back to how it needs confirmation before I press the short. The price is near the top of the recent range, and the market has shown a strong rejection wick on the most recent candle. Overall, the indicators across the hourly and daily timeframes lean bearish. A definitive close below the consolidation floor would signal continuation.
I only want the planned reaction; anything else is a pass.
Trade Plan — ETHUSDT SHORT
Entry: 2,231.17 - 2,232.83
Stop Loss: 2,243.16
TP1: 2,220.84 | TP2: 2,211.91 | TP3: 2,200.75
#TradeSetup
{future}(ETHUSDT)
$ETH — tbh, I keep coming back to how it needs confirmation before I press the short. The price is near the top of the recent range, and the market has shown a strong rejection wick on the most recent candle. Overall, the indicators across the hourly and daily timeframes lean bearish. A definitive close below the consolidation floor would signal continuation.
I only want the planned reaction; anything else is a pass.
Trade Plan — ETHUSDT SHORT
Entry: 2,231.17 - 2,232.83
Stop Loss: 2,243.16
TP1: 2,220.84 | TP2: 2,211.91 | TP3: 2,200.75
#TradeSetup
I only want the planned reaction; anything else is a pass.
Trade Plan — ETHUSDT SHORT
Entry: 2,231.17 - 2,232.83
Stop Loss: 2,243.16
TP1: 2,220.84 | TP2: 2,211.91 | TP3: 2,200.75
#TradeSetup
3
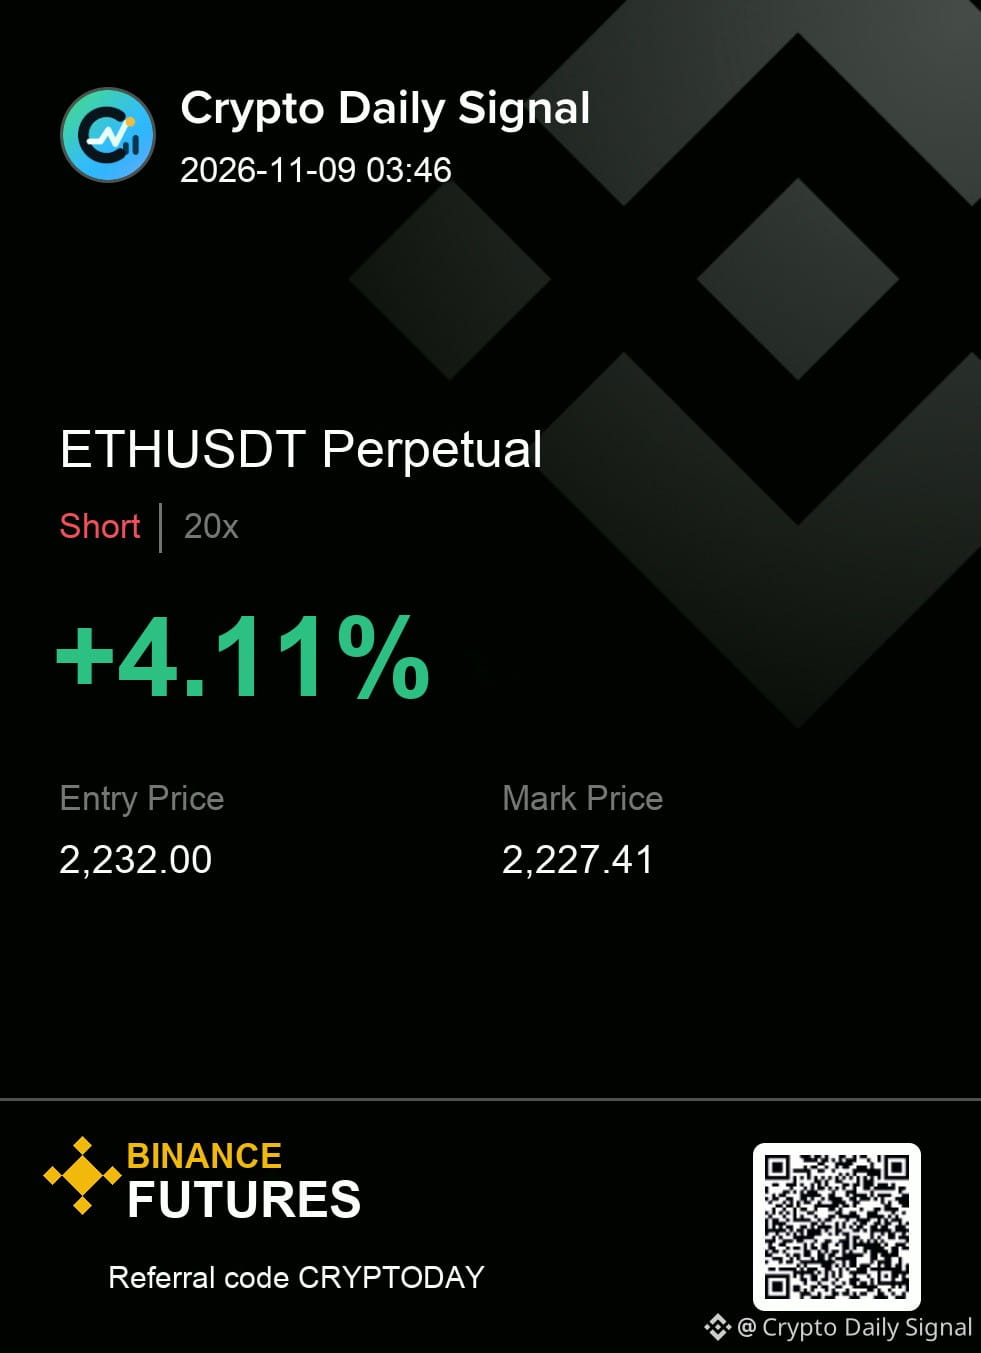
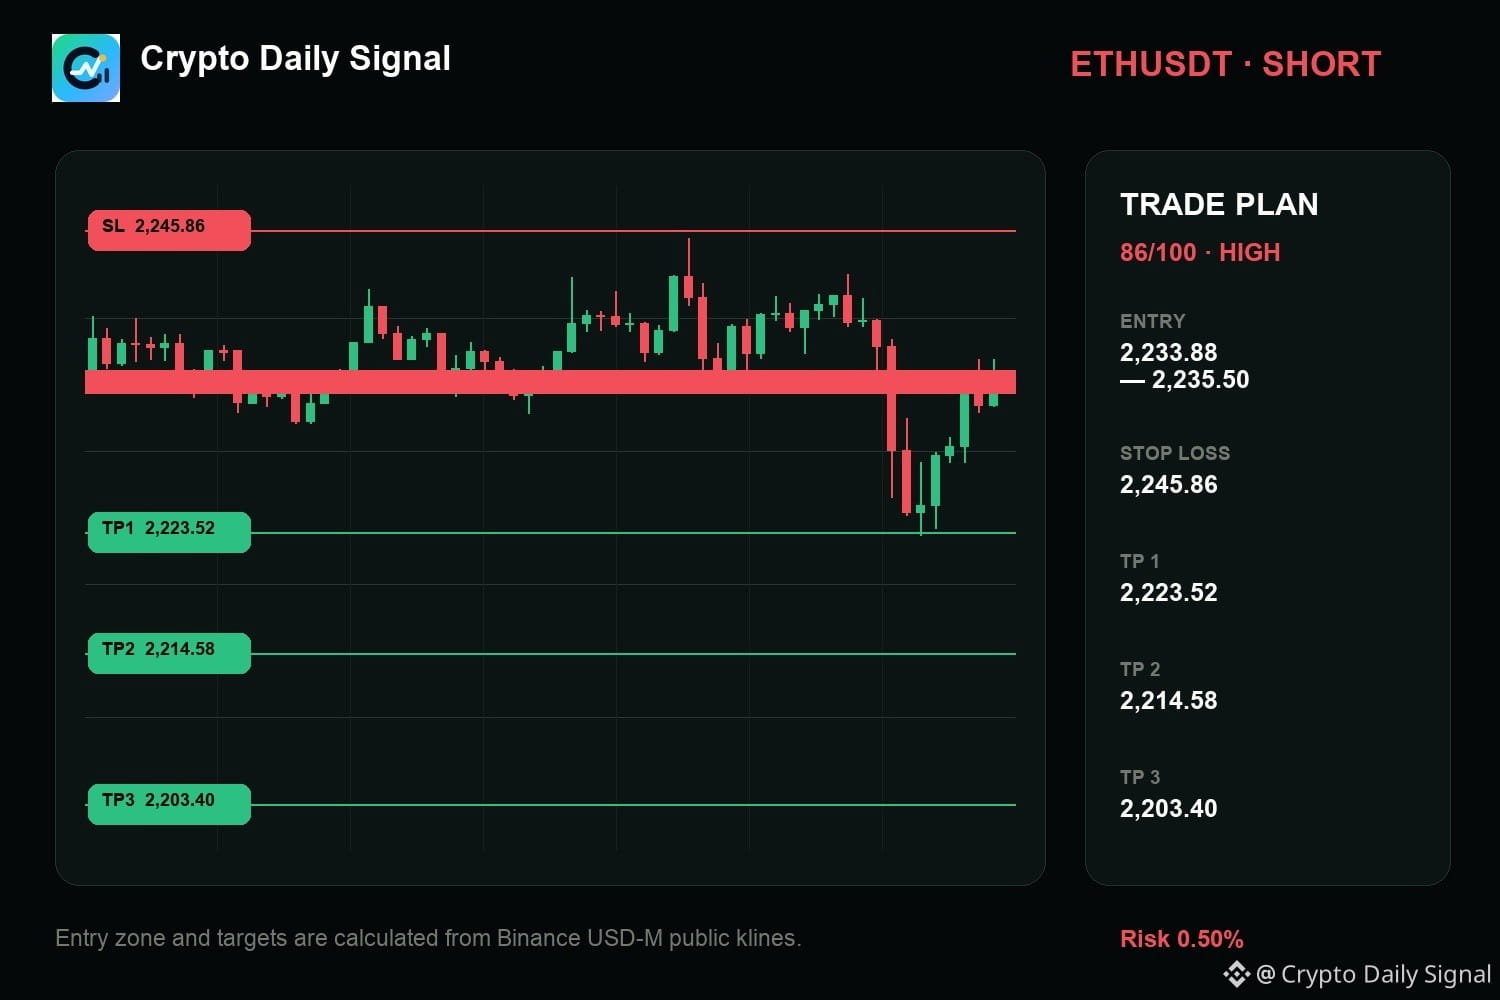
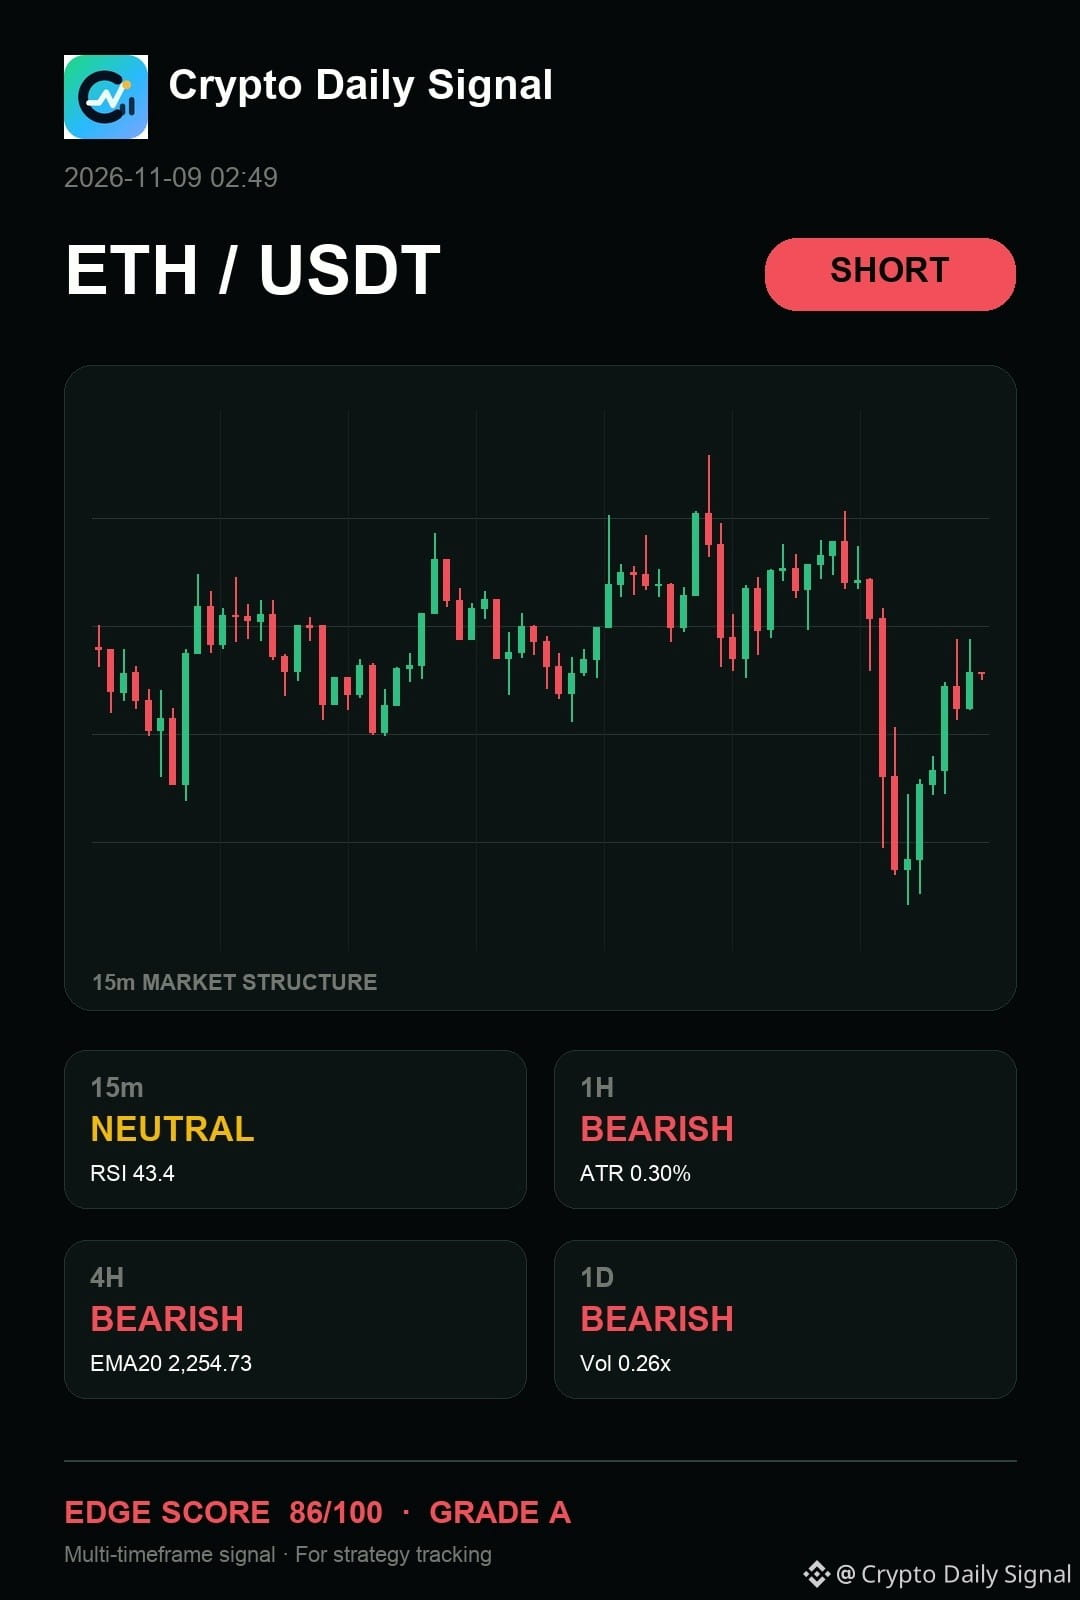
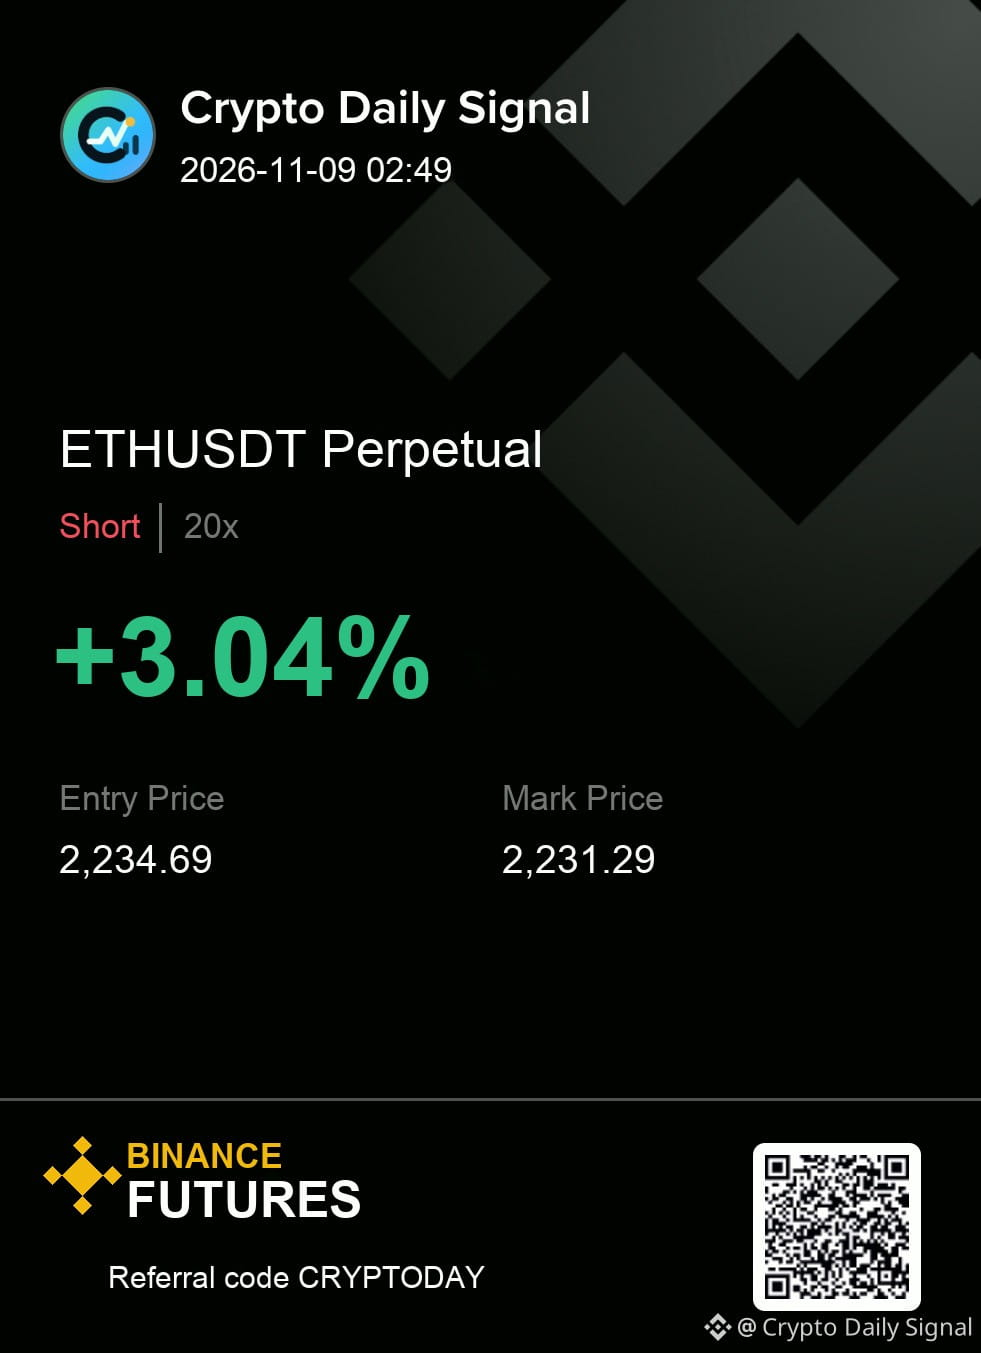
$ETH — quick take, I still think it remains a short watch for me following that rejection wick near the upper limit of consolidation. Both the hourly and four-hour views point bearishly, and the price is stuck making lower highs inside this range. A strong close back above that recent swing high would change my mind, but for now, the downside bias holds.
ETHUSDT | SHORT
Entry 2,233.88 - 2,235.50
Invalidation 2,245.86
Targets 2,223.52 / 2,214.58 / 2,203.40
#TradeSetup
{future}(ETHUSDT)
$ETH — quick take, I still think it remains a short watch for me following that rejection wick near the upper limit of consolidation. Both the hourly and four-hour views point bearishly, and the price is stuck making lower highs inside this range. A strong close back above that recent swing high would change my mind, but for now, the downside bias holds.
ETHUSDT | SHORT
Entry 2,233.88 - 2,235.50
Invalidation 2,245.86
Targets 2,223.52 / 2,214.58 / 2,203.40
#TradeSetup
ETHUSDT | SHORT
Entry 2,233.88 - 2,235.50
Invalidation 2,245.86
Targets 2,223.52 / 2,214.58 / 2,203.40
#TradeSetup
4
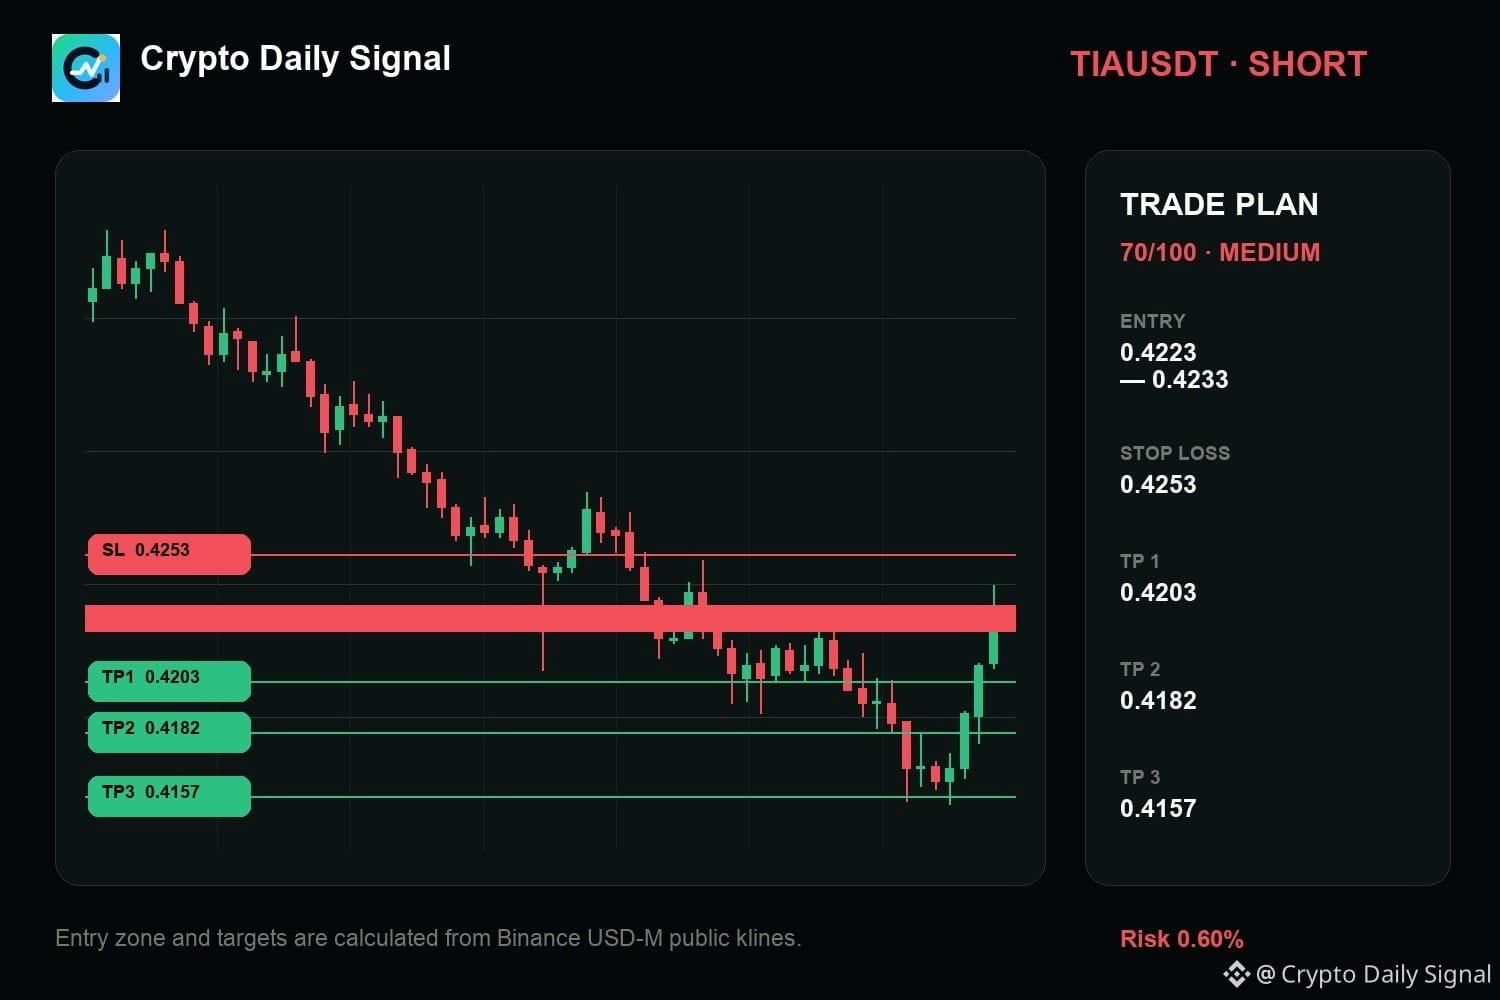
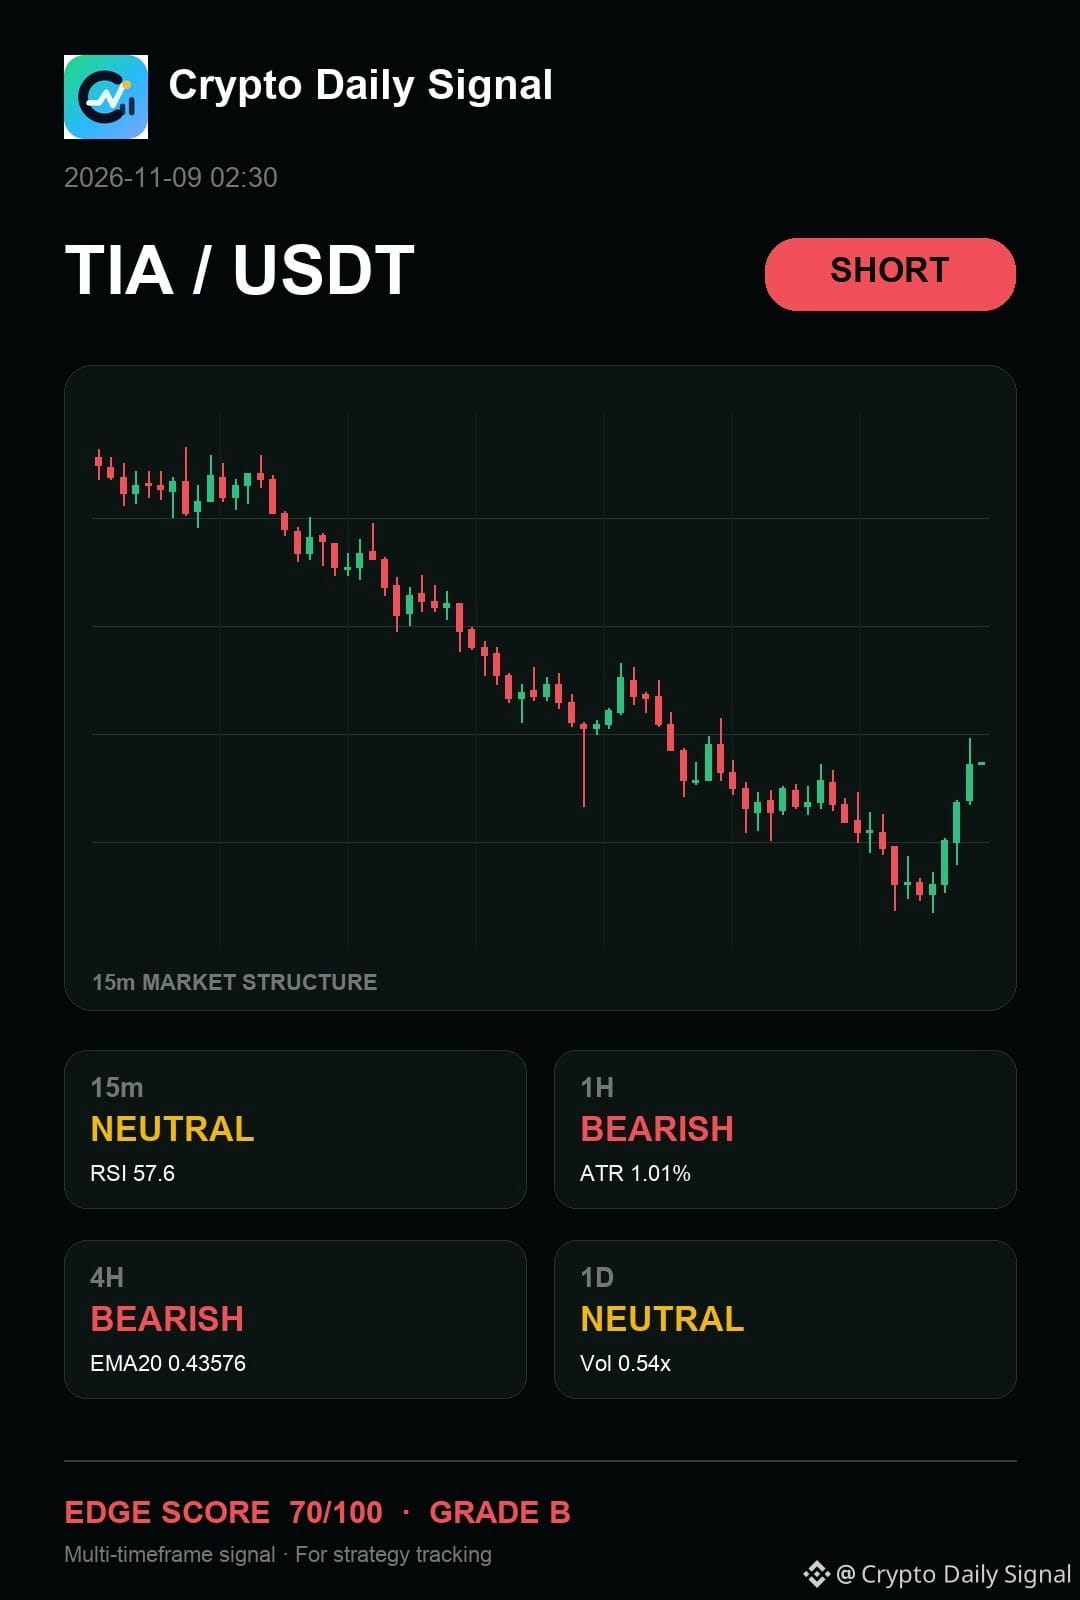
$TIA needs the sell-side reaction to confirm the bearish picture, as the overall structure is building lower highs and lower lows while respecting the descending trendline. Chasing into current strength feels premature; a convincing break below that last local swing low on a bearish bar would provide a better entry. If it closes strongly above that recent local swing high, the short thesis dissolves.
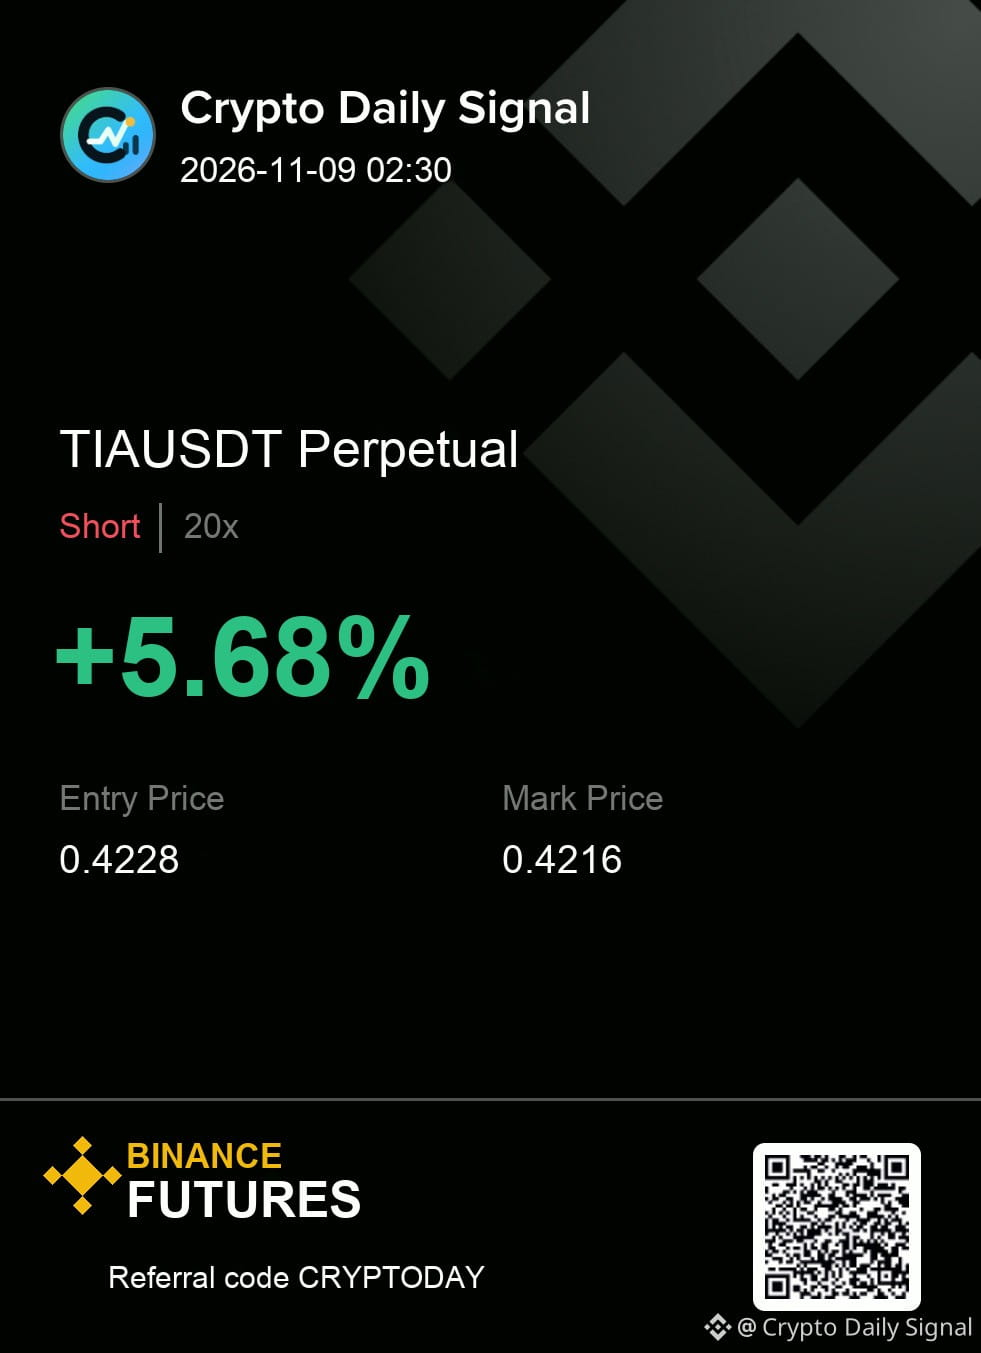
Execution plan (TIAUSDT — SHORT)
Entry: 0.4223 - 0.4233 | SL: 0.4253
Take profit: 0.4203 → 0.4182 → 0.4157
No chase outside the zone; the stop defines the whole idea.
#TradeSetup
{future}(TIAUSDT)
$TIA needs the sell-side reaction to confirm the bearish picture, as the overall structure is building lower highs and lower lows while respecting the descending trendline. Chasing into current strength feels premature; a convincing break below that last local swing low on a bearish bar would provide a better entry. If it closes strongly above that recent local swing high, the short thesis dissolves.
Execution plan (TIAUSDT — SHORT)
Entry: 0.4223 - 0.4233 | SL: 0.4253
Take profit: 0.4203 → 0.4182 → 0.4157
No chase outside the zone; the stop defines the whole idea.
#TradeSetup
Execution plan (TIAUSDT — SHORT)
Entry: 0.4223 - 0.4233 | SL: 0.4253
Take profit: 0.4203 → 0.4182 → 0.4157
No chase outside the zone; the stop defines the whole idea.
#TradeSetup
3
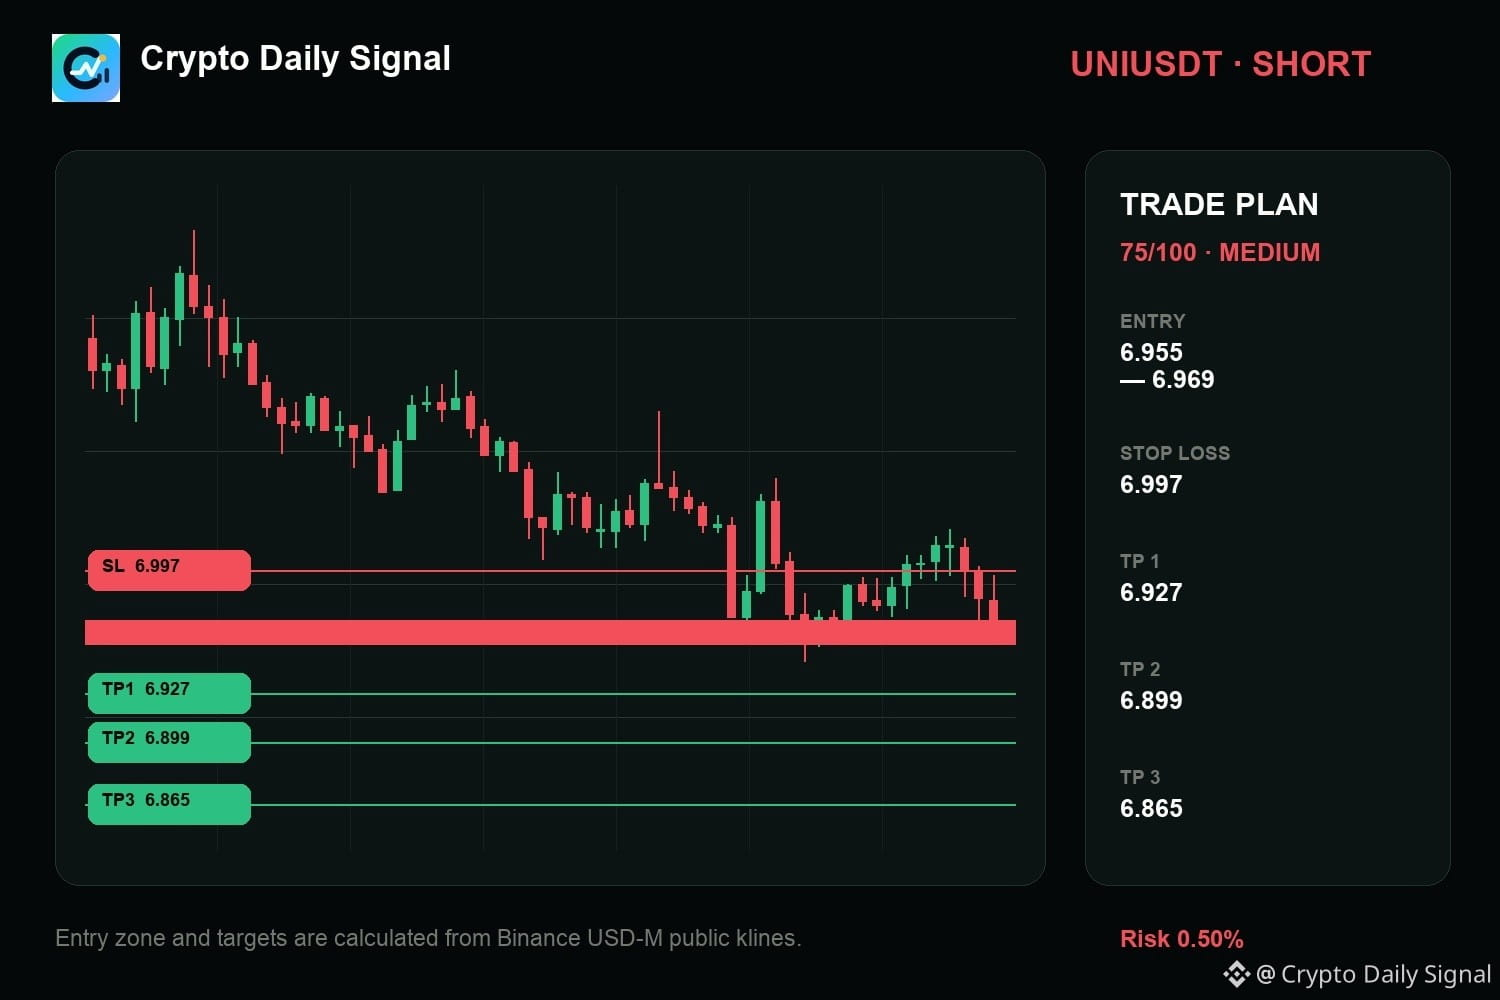
$UNI — from my side, the tape says it continues to favor the short case while the current setup is confined to a lower band. Trying to catch a dip right now is unattractive because a strong close above the recent peak would signal a reversal. What I need to see to pull the trigger is a clear break below the floor of this short-term trading range on a bearish candle.
SHORT plan for UNIUSDT
6.955 - 6.969 entry | 6.997 stop
6.927 → 6.899 → 6.865
A clean invalidation ends the thesis — no averaging into it.
#TradeSetup
{future}(UNIUSDT)
$UNI — from my side, the tape says it continues to favor the short case while the current setup is confined to a lower band. Trying to catch a dip right now is unattractive because a strong close above the recent peak would signal a reversal. What I need to see to pull the trigger is a clear break below the floor of this short-term trading range on a bearish candle.
SHORT plan for UNIUSDT
6.955 - 6.969 entry | 6.997 stop
6.927 → 6.899 → 6.865
A clean invalidation ends the thesis — no averaging into it.
#TradeSetup
SHORT plan for UNIUSDT
6.955 - 6.969 entry | 6.997 stop
6.927 → 6.899 → 6.865
A clean invalidation ends the thesis — no averaging into it.
#TradeSetup
Log in to explore more content
Join global crypto users on Binance Square
⚡️ Get latest and useful information about crypto.
💬 Trusted by the world’s largest crypto exchange.
👍 Discover real insights from verified creators.
Email / Phone number
Trending Topics
1
#BitcoinFiveWeeklyLosses
8,457 views
315 Discussing
2
#AIChipSlumpNasdaq
4,838 views
173 Discussing
3
#NvidiaInvestigatesAfterHuang’sAffairApology
2,781 views
83 Discussing
4
#BinanceReopensWithdrawalsForHYPE&APT
158,347 views
1,240 Discussing
5
#SouthKoreaDraftLawTargets15To20%ShareholderCap
159,927 views
838 Discussing
6
#TradFiForBeginners
231,248 views
2,083 Discussing
7
#KeplrAdvisesSocialLoginUsersToTransferAssets
74,721 views
611 Discussing
8
#TetherPlans€28.8MForJuventusCapitalIncrease
55,307 views
451 Discussing
9
#JobsReportRaisesHikeOdds
981,376 views
4,573 Discussing
10
#CPITestsDecemberRateOutlook
444,567 views
1,994 Discussing