
Bengal Trading
2.2k Публикации

Bengal Trading
Отправить жалобу
Заблокировать пользователя
Трейдер с частыми сделками
3.5 г
8.8K+ подписок(и/а)
2.6K+ подписчиков(а)
808 понравилось
Посты
Все
Цитирования
Видео
Активно
Обзор рыночной аналитикиБолее широкий рынок переживает краткую фазу охлаждения после отката на 1,4% по глобальной рыночной капитализации — до $2,68 трлн. Биткоин удерживается около $77 268, а общий объём торгов на всех рынках составляет $82,3 млрд. Краткосрочная структура рынка указывает на консолидацию в зоне премии на более высоком таймфрейме, что приводит к локальной ротации альткоинов и спотовым ликвидациям, не сигнализируя о полном развороте структурного тренда.
Топ-5 высокоскоростных нарративов
Расширение будущего TradFi: быстрое размещение и ускорение объёма в USDⓈ-маржинальных инструментах на акции (перпетуалы) на криптобиржах.
Обзор рыночной аналитики
Более широкий рынок переживает краткую фазу охлаждения после отката на 1,4% по глобальной рыночной капитализации — до $2,68 трлн. Биткоин удерживается около $77 268, а общий объём торгов на всех рынках составляет $82,3 млрд. Краткосрочная структура рынка указывает на консолидацию в зоне премии на более высоком таймфрейме, что приводит к локальной ротации альткоинов и спотовым ликвидациям, не сигнализируя о полном развороте структурного тренда.
Топ-5 высокоскоростных нарративов
Расширение будущего TradFi: быстрое размещение и ускорение объёма в USDⓈ-маржинальных инструментах на акции (перпетуалы) на криптобиржах.
Топ-5 высокоскоростных нарративов
Расширение будущего TradFi: быстрое размещение и ускорение объёма в USDⓈ-маржинальных инструментах на акции (перпетуалы) на криптобиржах.
244
См. перевод
Market Overview and Futures SignalsAggregate crypto market capitalisation sits near 2.64 trillion USD after a roughly 3 percent contraction over the trailing 24 hours, with 24-hour futures and spot volume elevated as leverage flushed. Bitcoin dominance holds 59.6 to 59.7 percent, confirming capital concentration in BTC rather than broad alt rotation. The Fear and Greed Index prints 61 to 62 (Greed), while the Altcoin Season Index remains depressed near 26 to 31, consistent with a Bitcoin-led tape. Average crypto RSI hovers in the mid-40s, neither oversold nor stretched on the composite. DXY trades near 99.4, gold futures near 4,440 USD. Recent U.S. spot Bitcoin ETF prints show mixed to negative daily flows after a strong mid-August inflow streak, while perpetual funding on BTC and ETH remains modestly positive (longs paying), signalling residual long crowding after the impulse from the mid-60s into the 81,000 area. Open interest across majors is slightly lower on the day, and 24-hour liquidations exceed 430 million USD with both sides represented.
The five highest-velocity narratives currently attracting order flow are Real-World Asset tokenisation and on-chain Treasuries, privacy and zero-knowledge (ZEC and XMR relative strength on the weekly), AI-agent and DePIN infrastructure, perpetual DEX and on-chain derivatives venues, and stablecoin settlement rails. Speculative micro-cap and meme velocity remains high but is not the institutional bid.
Ten notable high-velocity or structurally relevant movers over the trailing 24 hours include SKR (Seeker) approximately plus 75 to 110 percent on listing and volume expansion, ZORA approximately plus 41 to 65 percent, BASECAT approximately plus 49 to 58 percent, FLOCK approximately plus 24 to 39 percent, GHST (Aavegotchi) approximately plus 20 to 26 percent, AST (AirSwap) approximately plus 17 to 19 percent, JASMY approximately plus 6 to 7 percent, DASH approximately plus 6 to 7 percent, MANTLE approximately plus 6 to 8 percent, and MORPHO approximately plus 6 percent. Among larger-cap names most majors printed red on the day (SOL near minus 3 percent, XRP near minus 2 to 3 percent, BNB near minus 1 to 2 percent). Privacy names such as ZEC and XMR retained better relative weekly structure after earlier outsized advances. Structural drivers for the micro-cap cluster are thin-liquidity listing events and narrative rotation rather than durable institutional order flow. For the majors the driver is post-impulse mean reversion after the mid-August breakout toward 81,000 BTC, combined with modest ETF outflow prints and a still-elevated but cooling greed reading.
The 24 to 72 hour base case is range continuation and liquidity engineering around the recent high and the first demand cluster beneath current price, unless a fresh macro catalyst (DXY impulse, risk-off equity session, or a decisive ETF flow reversal) forces a market-structure shift. Bias is conditionally constructive above the recovered 200-day EMA cluster on BTC, but the immediate tape is a premium-to-discount rotation inside the 76,000 to 81,000 BTC box.
Asset: BTCUSDT
Live Price (aggregated): 78,286
Position: LONG
Entry: 76,400 to 77,200
Stop-Loss: 75,350
Take Profit 1: 79,200
Take Profit 2: 80,400
Take Profit 3: 81,250
Take Profit 4: 82,800
Valid Reason: Price is consolidating after tagging the 81,000 to 81,250 liquidity pool and failing to hold the psychological 80,000 handle. Higher-timeframe structure remains bullish with price still above the 50, 100 and 200 EMA cluster (approximately 69,700 to 72,300). The 76,400 to 77,200 zone aligns with the first demand after the breakout, a Fibonacci OTE of the last impulsive leg, and reported short-term support from multiple desks. A liquidity sweep of the 76,800 to 77,000 equal lows followed by a displacement candle and CISD on M15 or H1 would complete the AMD sequence into discount. Positive but not extreme funding, slightly declining OI, and mixed ETF prints argue against chasing mid-range. CVD divergence on the last sell-off would add confluence. Macro overlay is a still-soft DXY and no confirmed risk-off cascade.
The long is a mean-reversion buy of discounted institutional demand after a buy-side liquidity raid at the weekly high, not a breakout chase. Invalidation is a clean H4 close beneath 75,350 with expanding sell-side volume and OI rebuild on the short side.
Asset: BTCUSDT
Live Price (aggregated): 78,286
Position: SHORT
Entry: 80,150 to 81,050
Stop-Loss: 82,150
Take Profit 1: 79,000
Take Profit 2: 77,800
Take Profit 3: 76,600
Take Profit 4: 75,400
Valid Reason: The 80,000 to 81,250 band is unmitigated buy-side liquidity and the May swing rejection zone. A raid of resting stops above 80,800 to 81,000 followed by a bearish MSS on H1 and a return into a premium FVG would complete PO3 distribution. RSI on the daily is no longer extreme but remains elevated versus the mid-August base. Funding remains positive, so a squeeze of late longs into the high is the institutional path of least resistance before any deeper discount delivery. Volume profile shows acceptance below 80,000 on the last two sessions. Short only after the high is taken and displacement confirms; do not fade a clean H4 break and hold above 81,250.
Asset: ETHUSDT
Live Price (aggregated): 2,459
Position: LONG
Entry: 2,385 to 2,420
Stop-Loss: 2,328
Take Profit 1: 2,505
Take Profit 2: 2,550
Take Profit 3: 2,620
Take Profit 4: 2,750
Valid Reason: ETH is holding above the recovered 200-day EMA near 2,160 and the 50-day near 2,100. Immediate demand sits 2,385 to 2,420 after the rejection from 2,500 to 2,535. A sweep of 2,390 equal lows, bullish FVG fill, and H1 BOS would align with the same post-impulse consolidation seen on BTC. Funding is modestly positive. Relative strength versus BTC has cooled, so ETH longs work best as a beta expression of a BTC discount bounce rather than independent leadership. Liquidation data shows both sides flushed; a clean CISD off 2,400 would be the trigger.
Asset: ETHUSDT
Live Price (aggregated): 2,459
Position: SHORT
Entry: 2,515 to 2,555
Stop-Loss: 2,625
Take Profit 1: 2,460
Take Profit 2: 2,400
Take Profit 3: 2,340
Take Profit 4: 2,210
Valid Reason: 2,500 to 2,550 is the active supply and the first major resistance cited across desks. A liquidity hunt through 2,520 followed by a lower high and bearish displacement would confirm distribution. ETH underperformed the last impulse relative to the August range high near 2,567. Short only after the premium array is mitigated.
Asset: BNBUSDT
Live Price (aggregated): 688.9
Position: LONG
Entry: 668 to 678
Stop-Loss: 652
Take Profit 1: 705
Take Profit 2: 722
Take Profit 3: 745
Take Profit 4: 780
Valid Reason: BNB is the most range-bound of the five names, with lighter relative volume and slightly negative funding. Structure is still higher-low on the daily after the August advance toward the 700 to 710 area. A sweep of 670 to 675 demand and a reclaim of the 8/20 EMA stack on H1 would constitute a valid discount long. BNB often lags BTC on the first rotation and then follows; treat it as a lower-beta expression. Skip if price chops mid-range without a sweep.
Asset: BNBUSDT
Live Price (aggregated): 688.9
Position: SHORT
Entry: 708 to 722
Stop-Loss: 738
Take Profit 1: 688
Take Profit 2: 672
Take Profit 3: 655
Take Profit 4: 630
Valid Reason: Premium supply sits 708 to 722 from the recent local high. A raid of 710 stops and a bearish MSS would complete the short. OI on BNB is modest versus BTC and ETH, so conviction is lower. If the pair prints a clean H4 close above 722 with rising OI, stand aside.
Asset: SOLUSDT
Live Price (aggregated): 102.86
Position: LONG
Entry: 98.80 to 100.80
Stop-Loss: 96.40
Take Profit 1: 106.50
Take Profit 2: 110.00
Take Profit 3: 112.80
Take Profit 4: 118.00
Valid Reason: SOL is the weakest of the five on the 24-hour print (approximately minus 3 percent) after tagging the 108 to 110 supply. Funding has flipped slightly negative, which is constructive for a bounce once sell-side liquidity beneath 100 is taken. The 98.80 to 100.80 band is the first demand after the impulse from the mid-70s and aligns with prior breakout structure. A liquidity sweep of 100, bullish FVG, and H1 CHOC would be the ICT trigger. SOL remains a high-beta name; size smaller than BTC.
Asset: SOLUSDT
Live Price (aggregated): 102.86
Position: SHORT
Entry: 107.80 to 110.40
Stop-Loss: 113.20
Take Profit 1: 104.00
Take Profit 2: 101.00
Take Profit 3: 98.50
Take Profit 4: 94.80
Valid Reason: 108 to 110 is unmitigated premium and the local swing high. Negative funding can persist into a final squeeze of remaining shorts before distribution. Short only after the high is taken and displacement confirms. A hold above 110.40 with rising OI invalidates the short.
Asset: XRPUSDT
Live Price (aggregated): 1.366
Position: LONG
Entry: 1.318 to 1.348
Stop-Loss: 1.278
Take Profit 1: 1.405
Take Profit 2: 1.455
Take Profit 3: 1.520
Take Profit 4: 1.680
Valid Reason: XRP is defending the 1.35 area after failing to sustain 1.45 to 1.50. The 200-day EMA near 1.21 remains distant support; nearer demand is 1.32 to 1.35. A sweep of 1.33 equal lows and a bullish MSS would complete the long. Weekly structure from the August impulse remains intact above 1.30. Funding is mildly positive. XRP often lags then catches a late rotation; wait for the sweep rather than buying mid-range.
Asset: XRPUSDT
Live Price (aggregated): 1.366
Position: SHORT
Entry: 1.448 to 1.505
Stop-Loss: 1.545
Take Profit 1: 1.390
Take Profit 2: 1.350
Take Profit 3: 1.310
Take Profit 4: 1.240
Valid Reason: 1.45 to 1.50 is the active supply and the first rejection cluster after the 1.70 spike. A raid of 1.48 to 1.50 buy-side liquidity followed by a lower high would confirm distribution. Do not short a clean reclaim and hold of 1.50.
Session Summary - Directional Bias (Bullish/Bearish/Neutral)
Asset: BTCUSDT
Trend: Neutral to mildly bullish on higher timeframes, range-bound on H4
LONG: 76,400 to 77,200
Context: Discount demand after the 81,000 liquidity raid. Requires a sweep of 76,800 to 77,000 and H1 displacement. Higher-timeframe EMAs and the recovered 200-day average still support a buy-the-dip framework provided 75,350 holds.
SHORT: 80,150 to 81,050
Context: Premium supply and unmitigated buy-side liquidity. Requires a raid of 80,800 to 81,000 and bearish MSS. Positive funding favours a squeeze into the high before any deeper delivery lower.
Asset: ETHUSDT
Trend: Neutral, tracking BTC
LONG: 2,385 to 2,420
Context: First demand after 2,500 rejection. Valid only after a low sweep and CISD.
SHORT: 2,515 to 2,555
Context: Active 2,500 to 2,550 supply. Valid after a high raid and displacement.
Asset: BNBUSDT
Trend: Neutral
LONG: 668 to 678
Context: Lower-beta demand. Requires a clear sweep; otherwise SKIP for insufficient displacement.
SHORT: 708 to 722
Context: Local premium. Lower OI reduces conviction versus BTC.
Asset: SOLUSDT
Trend: Neutral to short-term bearish until 100 is defended
LONG: 98.80 to 100.80
Context: High-beta discount after the 108 to 110 rejection. Slightly negative funding supports a squeeze of shorts once 100 is swept.
SHORT: 107.80 to 110.40
Context: Unmitigated premium. Requires the high to be taken first.
Asset: XRPUSDT
Trend: Neutral
LONG: 1.318 to 1.348
Context: Defence of 1.35. Requires a sweep of 1.33.
SHORT: 1.448 to 1.505
Context: 1.45 to 1.50 supply after the 1.70 rejection.
Overall session bias is Neutral with a slight higher-timeframe bullish lean while BTC holds the 76,000 to 77,000 demand cluster and the 200-day EMA complex. The path of least resistance for the next 24 hours is continued range rotation and liquidity hunts at both edges of the August box rather than a clean trend day. Size down into the London–New York overlap and wait for the sweep plus displacement; do not fade mid-range.
Disclaimer: All financial data and technical trade setups provided in this analysis are for educational and informational purposes only. Digital asset derivatives trading carries immense risk due to volatile price fluctuations and structural leverage components. Traders must implement strict risk management protocols and execute separate verifications before entering live market positions.
#DYOR #TYOR #BengalTrading #Pavel
Market Overview and Futures Signals
Aggregate crypto market capitalisation sits near 2.64 trillion USD after a roughly 3 percent contraction over the trailing 24 hours, with 24-hour futures and spot volume elevated as leverage flushed. Bitcoin dominance holds 59.6 to 59.7 percent, confirming capital concentration in BTC rather than broad alt rotation. The Fear and Greed Index prints 61 to 62 (Greed), while the Altcoin Season Index remains depressed near 26 to 31, consistent with a Bitcoin-led tape. Average crypto RSI hovers in the mid-40s, neither oversold nor stretched on the composite. DXY trades near 99.4, gold futures near 4,440 USD. Recent U.S. spot Bitcoin ETF prints show mixed to negative daily flows after a strong mid-August inflow streak, while perpetual funding on BTC and ETH remains modestly positive (longs paying), signalling residual long crowding after the impulse from the mid-60s into the 81,000 area. Open interest across majors is slightly lower on the day, and 24-hour liquidations exceed 430 million USD with both sides represented.
The five highest-velocity narratives currently attracting order flow are Real-World Asset tokenisation and on-chain Treasuries, privacy and zero-knowledge (ZEC and XMR relative strength on the weekly), AI-agent and DePIN infrastructure, perpetual DEX and on-chain derivatives venues, and stablecoin settlement rails. Speculative micro-cap and meme velocity remains high but is not the institutional bid.
Ten notable high-velocity or structurally relevant movers over the trailing 24 hours include SKR (Seeker) approximately plus 75 to 110 percent on listing and volume expansion, ZORA approximately plus 41 to 65 percent, BASECAT approximately plus 49 to 58 percent, FLOCK approximately plus 24 to 39 percent, GHST (Aavegotchi) approximately plus 20 to 26 percent, AST (AirSwap) approximately plus 17 to 19 percent, JASMY approximately plus 6 to 7 percent, DASH approximately plus 6 to 7 percent, MANTLE approximately plus 6 to 8 percent, and MORPHO approximately plus 6 percent. Among larger-cap names most majors printed red on the day (SOL near minus 3 percent, XRP near minus 2 to 3 percent, BNB near minus 1 to 2 percent). Privacy names such as ZEC and XMR retained better relative weekly structure after earlier outsized advances. Structural drivers for the micro-cap cluster are thin-liquidity listing events and narrative rotation rather than durable institutional order flow. For the majors the driver is post-impulse mean reversion after the mid-August breakout toward 81,000 BTC, combined with modest ETF outflow prints and a still-elevated but cooling greed reading.
The 24 to 72 hour base case is range continuation and liquidity engineering around the recent high and the first demand cluster beneath current price, unless a fresh macro catalyst (DXY impulse, risk-off equity session, or a decisive ETF flow reversal) forces a market-structure shift. Bias is conditionally constructive above the recovered 200-day EMA cluster on BTC, but the immediate tape is a premium-to-discount rotation inside the 76,000 to 81,000 BTC box.
Asset: BTCUSDT
Live Price (aggregated): 78,286
Position: LONG
Entry: 76,400 to 77,200
Stop-Loss: 75,350
Take Profit 1: 79,200
Take Profit 2: 80,400
Take Profit 3: 81,250
Take Profit 4: 82,800
Valid Reason: Price is consolidating after tagging the 81,000 to 81,250 liquidity pool and failing to hold the psychological 80,000 handle. Higher-timeframe structure remains bullish with price still above the 50, 100 and 200 EMA cluster (approximately 69,700 to 72,300). The 76,400 to 77,200 zone aligns with the first demand after the breakout, a Fibonacci OTE of the last impulsive leg, and reported short-term support from multiple desks. A liquidity sweep of the 76,800 to 77,000 equal lows followed by a displacement candle and CISD on M15 or H1 would complete the AMD sequence into discount. Positive but not extreme funding, slightly declining OI, and mixed ETF prints argue against chasing mid-range. CVD divergence on the last sell-off would add confluence. Macro overlay is a still-soft DXY and no confirmed risk-off cascade.
The long is a mean-reversion buy of discounted institutional demand after a buy-side liquidity raid at the weekly high, not a breakout chase. Invalidation is a clean H4 close beneath 75,350 with expanding sell-side volume and OI rebuild on the short side.
Asset: BTCUSDT
Live Price (aggregated): 78,286
Position: SHORT
Entry: 80,150 to 81,050
Stop-Loss: 82,150
Take Profit 1: 79,000
Take Profit 2: 77,800
Take Profit 3: 76,600
Take Profit 4: 75,400
Valid Reason: The 80,000 to 81,250 band is unmitigated buy-side liquidity and the May swing rejection zone. A raid of resting stops above 80,800 to 81,000 followed by a bearish MSS on H1 and a return into a premium FVG would complete PO3 distribution. RSI on the daily is no longer extreme but remains elevated versus the mid-August base. Funding remains positive, so a squeeze of late longs into the high is the institutional path of least resistance before any deeper discount delivery. Volume profile shows acceptance below 80,000 on the last two sessions. Short only after the high is taken and displacement confirms; do not fade a clean H4 break and hold above 81,250.
Asset: ETHUSDT
Live Price (aggregated): 2,459
Position: LONG
Entry: 2,385 to 2,420
Stop-Loss: 2,328
Take Profit 1: 2,505
Take Profit 2: 2,550
Take Profit 3: 2,620
Take Profit 4: 2,750
Valid Reason: ETH is holding above the recovered 200-day EMA near 2,160 and the 50-day near 2,100. Immediate demand sits 2,385 to 2,420 after the rejection from 2,500 to 2,535. A sweep of 2,390 equal lows, bullish FVG fill, and H1 BOS would align with the same post-impulse consolidation seen on BTC. Funding is modestly positive. Relative strength versus BTC has cooled, so ETH longs work best as a beta expression of a BTC discount bounce rather than independent leadership. Liquidation data shows both sides flushed; a clean CISD off 2,400 would be the trigger.
Asset: ETHUSDT
Live Price (aggregated): 2,459
Position: SHORT
Entry: 2,515 to 2,555
Stop-Loss: 2,625
Take Profit 1: 2,460
Take Profit 2: 2,400
Take Profit 3: 2,340
Take Profit 4: 2,210
Valid Reason: 2,500 to 2,550 is the active supply and the first major resistance cited across desks. A liquidity hunt through 2,520 followed by a lower high and bearish displacement would confirm distribution. ETH underperformed the last impulse relative to the August range high near 2,567. Short only after the premium array is mitigated.
Asset: BNBUSDT
Live Price (aggregated): 688.9
Position: LONG
Entry: 668 to 678
Stop-Loss: 652
Take Profit 1: 705
Take Profit 2: 722
Take Profit 3: 745
Take Profit 4: 780
Valid Reason: BNB is the most range-bound of the five names, with lighter relative volume and slightly negative funding. Structure is still higher-low on the daily after the August advance toward the 700 to 710 area. A sweep of 670 to 675 demand and a reclaim of the 8/20 EMA stack on H1 would constitute a valid discount long. BNB often lags BTC on the first rotation and then follows; treat it as a lower-beta expression. Skip if price chops mid-range without a sweep.
Asset: BNBUSDT
Live Price (aggregated): 688.9
Position: SHORT
Entry: 708 to 722
Stop-Loss: 738
Take Profit 1: 688
Take Profit 2: 672
Take Profit 3: 655
Take Profit 4: 630
Valid Reason: Premium supply sits 708 to 722 from the recent local high. A raid of 710 stops and a bearish MSS would complete the short. OI on BNB is modest versus BTC and ETH, so conviction is lower. If the pair prints a clean H4 close above 722 with rising OI, stand aside.
Asset: SOLUSDT
Live Price (aggregated): 102.86
Position: LONG
Entry: 98.80 to 100.80
Stop-Loss: 96.40
Take Profit 1: 106.50
Take Profit 2: 110.00
Take Profit 3: 112.80
Take Profit 4: 118.00
Valid Reason: SOL is the weakest of the five on the 24-hour print (approximately minus 3 percent) after tagging the 108 to 110 supply. Funding has flipped slightly negative, which is constructive for a bounce once sell-side liquidity beneath 100 is taken. The 98.80 to 100.80 band is the first demand after the impulse from the mid-70s and aligns with prior breakout structure. A liquidity sweep of 100, bullish FVG, and H1 CHOC would be the ICT trigger. SOL remains a high-beta name; size smaller than BTC.
Asset: SOLUSDT
Live Price (aggregated): 102.86
Position: SHORT
Entry: 107.80 to 110.40
Stop-Loss: 113.20
Take Profit 1: 104.00
Take Profit 2: 101.00
Take Profit 3: 98.50
Take Profit 4: 94.80
Valid Reason: 108 to 110 is unmitigated premium and the local swing high. Negative funding can persist into a final squeeze of remaining shorts before distribution. Short only after the high is taken and displacement confirms. A hold above 110.40 with rising OI invalidates the short.
Asset: XRPUSDT
Live Price (aggregated): 1.366
Position: LONG
Entry: 1.318 to 1.348
Stop-Loss: 1.278
Take Profit 1: 1.405
Take Profit 2: 1.455
Take Profit 3: 1.520
Take Profit 4: 1.680
Valid Reason: XRP is defending the 1.35 area after failing to sustain 1.45 to 1.50. The 200-day EMA near 1.21 remains distant support; nearer demand is 1.32 to 1.35. A sweep of 1.33 equal lows and a bullish MSS would complete the long. Weekly structure from the August impulse remains intact above 1.30. Funding is mildly positive. XRP often lags then catches a late rotation; wait for the sweep rather than buying mid-range.
Asset: XRPUSDT
Live Price (aggregated): 1.366
Position: SHORT
Entry: 1.448 to 1.505
Stop-Loss: 1.545
Take Profit 1: 1.390
Take Profit 2: 1.350
Take Profit 3: 1.310
Take Profit 4: 1.240
Valid Reason: 1.45 to 1.50 is the active supply and the first rejection cluster after the 1.70 spike. A raid of 1.48 to 1.50 buy-side liquidity followed by a lower high would confirm distribution. Do not short a clean reclaim and hold of 1.50.
Session Summary - Directional Bias (Bullish/Bearish/Neutral)
Asset: BTCUSDT
Trend: Neutral to mildly bullish on higher timeframes, range-bound on H4
LONG: 76,400 to 77,200
Context: Discount demand after the 81,000 liquidity raid. Requires a sweep of 76,800 to 77,000 and H1 displacement. Higher-timeframe EMAs and the recovered 200-day average still support a buy-the-dip framework provided 75,350 holds.
SHORT: 80,150 to 81,050
Context: Premium supply and unmitigated buy-side liquidity. Requires a raid of 80,800 to 81,000 and bearish MSS. Positive funding favours a squeeze into the high before any deeper delivery lower.
Asset: ETHUSDT
Trend: Neutral, tracking BTC
LONG: 2,385 to 2,420
Context: First demand after 2,500 rejection. Valid only after a low sweep and CISD.
SHORT: 2,515 to 2,555
Context: Active 2,500 to 2,550 supply. Valid after a high raid and displacement.
Asset: BNBUSDT
Trend: Neutral
LONG: 668 to 678
Context: Lower-beta demand. Requires a clear sweep; otherwise SKIP for insufficient displacement.
SHORT: 708 to 722
Context: Local premium. Lower OI reduces conviction versus BTC.
Asset: SOLUSDT
Trend: Neutral to short-term bearish until 100 is defended
LONG: 98.80 to 100.80
Context: High-beta discount after the 108 to 110 rejection. Slightly negative funding supports a squeeze of shorts once 100 is swept.
SHORT: 107.80 to 110.40
Context: Unmitigated premium. Requires the high to be taken first.
Asset: XRPUSDT
Trend: Neutral
LONG: 1.318 to 1.348
Context: Defence of 1.35. Requires a sweep of 1.33.
SHORT: 1.448 to 1.505
Context: 1.45 to 1.50 supply after the 1.70 rejection.
Overall session bias is Neutral with a slight higher-timeframe bullish lean while BTC holds the 76,000 to 77,000 demand cluster and the 200-day EMA complex. The path of least resistance for the next 24 hours is continued range rotation and liquidity hunts at both edges of the August box rather than a clean trend day. Size down into the London–New York overlap and wait for the sweep plus displacement; do not fade mid-range.
Disclaimer: All financial data and technical trade setups provided in this analysis are for educational and informational purposes only. Digital asset derivatives trading carries immense risk due to volatile price fluctuations and structural leverage components. Traders must implement strict risk management protocols and execute separate verifications before entering live market positions.
#DYOR #TYOR #BengalTrading #Pavel
The five highest-velocity narratives currently attracting order flow are Real-World Asset tokenisation and on-chain Treasuries, privacy and zero-knowledge (ZEC and XMR relative strength on the weekly), AI-agent and DePIN infrastructure, perpetual DEX and on-chain derivatives venues, and stablecoin settlement rails. Speculative micro-cap and meme velocity remains high but is not the institutional bid.
Ten notable high-velocity or structurally relevant movers over the trailing 24 hours include SKR (Seeker) approximately plus 75 to 110 percent on listing and volume expansion, ZORA approximately plus 41 to 65 percent, BASECAT approximately plus 49 to 58 percent, FLOCK approximately plus 24 to 39 percent, GHST (Aavegotchi) approximately plus 20 to 26 percent, AST (AirSwap) approximately plus 17 to 19 percent, JASMY approximately plus 6 to 7 percent, DASH approximately plus 6 to 7 percent, MANTLE approximately plus 6 to 8 percent, and MORPHO approximately plus 6 percent. Among larger-cap names most majors printed red on the day (SOL near minus 3 percent, XRP near minus 2 to 3 percent, BNB near minus 1 to 2 percent). Privacy names such as ZEC and XMR retained better relative weekly structure after earlier outsized advances. Structural drivers for the micro-cap cluster are thin-liquidity listing events and narrative rotation rather than durable institutional order flow. For the majors the driver is post-impulse mean reversion after the mid-August breakout toward 81,000 BTC, combined with modest ETF outflow prints and a still-elevated but cooling greed reading.
The 24 to 72 hour base case is range continuation and liquidity engineering around the recent high and the first demand cluster beneath current price, unless a fresh macro catalyst (DXY impulse, risk-off equity session, or a decisive ETF flow reversal) forces a market-structure shift. Bias is conditionally constructive above the recovered 200-day EMA cluster on BTC, but the immediate tape is a premium-to-discount rotation inside the 76,000 to 81,000 BTC box.
Asset: BTCUSDT
Live Price (aggregated): 78,286
Position: LONG
Entry: 76,400 to 77,200
Stop-Loss: 75,350
Take Profit 1: 79,200
Take Profit 2: 80,400
Take Profit 3: 81,250
Take Profit 4: 82,800
Valid Reason: Price is consolidating after tagging the 81,000 to 81,250 liquidity pool and failing to hold the psychological 80,000 handle. Higher-timeframe structure remains bullish with price still above the 50, 100 and 200 EMA cluster (approximately 69,700 to 72,300). The 76,400 to 77,200 zone aligns with the first demand after the breakout, a Fibonacci OTE of the last impulsive leg, and reported short-term support from multiple desks. A liquidity sweep of the 76,800 to 77,000 equal lows followed by a displacement candle and CISD on M15 or H1 would complete the AMD sequence into discount. Positive but not extreme funding, slightly declining OI, and mixed ETF prints argue against chasing mid-range. CVD divergence on the last sell-off would add confluence. Macro overlay is a still-soft DXY and no confirmed risk-off cascade.
The long is a mean-reversion buy of discounted institutional demand after a buy-side liquidity raid at the weekly high, not a breakout chase. Invalidation is a clean H4 close beneath 75,350 with expanding sell-side volume and OI rebuild on the short side.
Asset: BTCUSDT
Live Price (aggregated): 78,286
Position: SHORT
Entry: 80,150 to 81,050
Stop-Loss: 82,150
Take Profit 1: 79,000
Take Profit 2: 77,800
Take Profit 3: 76,600
Take Profit 4: 75,400
Valid Reason: The 80,000 to 81,250 band is unmitigated buy-side liquidity and the May swing rejection zone. A raid of resting stops above 80,800 to 81,000 followed by a bearish MSS on H1 and a return into a premium FVG would complete PO3 distribution. RSI on the daily is no longer extreme but remains elevated versus the mid-August base. Funding remains positive, so a squeeze of late longs into the high is the institutional path of least resistance before any deeper discount delivery. Volume profile shows acceptance below 80,000 on the last two sessions. Short only after the high is taken and displacement confirms; do not fade a clean H4 break and hold above 81,250.
Asset: ETHUSDT
Live Price (aggregated): 2,459
Position: LONG
Entry: 2,385 to 2,420
Stop-Loss: 2,328
Take Profit 1: 2,505
Take Profit 2: 2,550
Take Profit 3: 2,620
Take Profit 4: 2,750
Valid Reason: ETH is holding above the recovered 200-day EMA near 2,160 and the 50-day near 2,100. Immediate demand sits 2,385 to 2,420 after the rejection from 2,500 to 2,535. A sweep of 2,390 equal lows, bullish FVG fill, and H1 BOS would align with the same post-impulse consolidation seen on BTC. Funding is modestly positive. Relative strength versus BTC has cooled, so ETH longs work best as a beta expression of a BTC discount bounce rather than independent leadership. Liquidation data shows both sides flushed; a clean CISD off 2,400 would be the trigger.
Asset: ETHUSDT
Live Price (aggregated): 2,459
Position: SHORT
Entry: 2,515 to 2,555
Stop-Loss: 2,625
Take Profit 1: 2,460
Take Profit 2: 2,400
Take Profit 3: 2,340
Take Profit 4: 2,210
Valid Reason: 2,500 to 2,550 is the active supply and the first major resistance cited across desks. A liquidity hunt through 2,520 followed by a lower high and bearish displacement would confirm distribution. ETH underperformed the last impulse relative to the August range high near 2,567. Short only after the premium array is mitigated.
Asset: BNBUSDT
Live Price (aggregated): 688.9
Position: LONG
Entry: 668 to 678
Stop-Loss: 652
Take Profit 1: 705
Take Profit 2: 722
Take Profit 3: 745
Take Profit 4: 780
Valid Reason: BNB is the most range-bound of the five names, with lighter relative volume and slightly negative funding. Structure is still higher-low on the daily after the August advance toward the 700 to 710 area. A sweep of 670 to 675 demand and a reclaim of the 8/20 EMA stack on H1 would constitute a valid discount long. BNB often lags BTC on the first rotation and then follows; treat it as a lower-beta expression. Skip if price chops mid-range without a sweep.
Asset: BNBUSDT
Live Price (aggregated): 688.9
Position: SHORT
Entry: 708 to 722
Stop-Loss: 738
Take Profit 1: 688
Take Profit 2: 672
Take Profit 3: 655
Take Profit 4: 630
Valid Reason: Premium supply sits 708 to 722 from the recent local high. A raid of 710 stops and a bearish MSS would complete the short. OI on BNB is modest versus BTC and ETH, so conviction is lower. If the pair prints a clean H4 close above 722 with rising OI, stand aside.
Asset: SOLUSDT
Live Price (aggregated): 102.86
Position: LONG
Entry: 98.80 to 100.80
Stop-Loss: 96.40
Take Profit 1: 106.50
Take Profit 2: 110.00
Take Profit 3: 112.80
Take Profit 4: 118.00
Valid Reason: SOL is the weakest of the five on the 24-hour print (approximately minus 3 percent) after tagging the 108 to 110 supply. Funding has flipped slightly negative, which is constructive for a bounce once sell-side liquidity beneath 100 is taken. The 98.80 to 100.80 band is the first demand after the impulse from the mid-70s and aligns with prior breakout structure. A liquidity sweep of 100, bullish FVG, and H1 CHOC would be the ICT trigger. SOL remains a high-beta name; size smaller than BTC.
Asset: SOLUSDT
Live Price (aggregated): 102.86
Position: SHORT
Entry: 107.80 to 110.40
Stop-Loss: 113.20
Take Profit 1: 104.00
Take Profit 2: 101.00
Take Profit 3: 98.50
Take Profit 4: 94.80
Valid Reason: 108 to 110 is unmitigated premium and the local swing high. Negative funding can persist into a final squeeze of remaining shorts before distribution. Short only after the high is taken and displacement confirms. A hold above 110.40 with rising OI invalidates the short.
Asset: XRPUSDT
Live Price (aggregated): 1.366
Position: LONG
Entry: 1.318 to 1.348
Stop-Loss: 1.278
Take Profit 1: 1.405
Take Profit 2: 1.455
Take Profit 3: 1.520
Take Profit 4: 1.680
Valid Reason: XRP is defending the 1.35 area after failing to sustain 1.45 to 1.50. The 200-day EMA near 1.21 remains distant support; nearer demand is 1.32 to 1.35. A sweep of 1.33 equal lows and a bullish MSS would complete the long. Weekly structure from the August impulse remains intact above 1.30. Funding is mildly positive. XRP often lags then catches a late rotation; wait for the sweep rather than buying mid-range.
Asset: XRPUSDT
Live Price (aggregated): 1.366
Position: SHORT
Entry: 1.448 to 1.505
Stop-Loss: 1.545
Take Profit 1: 1.390
Take Profit 2: 1.350
Take Profit 3: 1.310
Take Profit 4: 1.240
Valid Reason: 1.45 to 1.50 is the active supply and the first rejection cluster after the 1.70 spike. A raid of 1.48 to 1.50 buy-side liquidity followed by a lower high would confirm distribution. Do not short a clean reclaim and hold of 1.50.
Session Summary - Directional Bias (Bullish/Bearish/Neutral)
Asset: BTCUSDT
Trend: Neutral to mildly bullish on higher timeframes, range-bound on H4
LONG: 76,400 to 77,200
Context: Discount demand after the 81,000 liquidity raid. Requires a sweep of 76,800 to 77,000 and H1 displacement. Higher-timeframe EMAs and the recovered 200-day average still support a buy-the-dip framework provided 75,350 holds.
SHORT: 80,150 to 81,050
Context: Premium supply and unmitigated buy-side liquidity. Requires a raid of 80,800 to 81,000 and bearish MSS. Positive funding favours a squeeze into the high before any deeper delivery lower.
Asset: ETHUSDT
Trend: Neutral, tracking BTC
LONG: 2,385 to 2,420
Context: First demand after 2,500 rejection. Valid only after a low sweep and CISD.
SHORT: 2,515 to 2,555
Context: Active 2,500 to 2,550 supply. Valid after a high raid and displacement.
Asset: BNBUSDT
Trend: Neutral
LONG: 668 to 678
Context: Lower-beta demand. Requires a clear sweep; otherwise SKIP for insufficient displacement.
SHORT: 708 to 722
Context: Local premium. Lower OI reduces conviction versus BTC.
Asset: SOLUSDT
Trend: Neutral to short-term bearish until 100 is defended
LONG: 98.80 to 100.80
Context: High-beta discount after the 108 to 110 rejection. Slightly negative funding supports a squeeze of shorts once 100 is swept.
SHORT: 107.80 to 110.40
Context: Unmitigated premium. Requires the high to be taken first.
Asset: XRPUSDT
Trend: Neutral
LONG: 1.318 to 1.348
Context: Defence of 1.35. Requires a sweep of 1.33.
SHORT: 1.448 to 1.505
Context: 1.45 to 1.50 supply after the 1.70 rejection.
Overall session bias is Neutral with a slight higher-timeframe bullish lean while BTC holds the 76,000 to 77,000 demand cluster and the 200-day EMA complex. The path of least resistance for the next 24 hours is continued range rotation and liquidity hunts at both edges of the August box rather than a clean trend day. Size down into the London–New York overlap and wait for the sweep plus displacement; do not fade mid-range.
Disclaimer: All financial data and technical trade setups provided in this analysis are for educational and informational purposes only. Digital asset derivatives trading carries immense risk due to volatile price fluctuations and structural leverage components. Traders must implement strict risk management protocols and execute separate verifications before entering live market positions.
#DYOR #TYOR #BengalTrading #Pavel
97
Обзор крипторынка и фьючерсные сигналы для 5 крупнейших монетСовокупная капитализация крипторынка держится около $2,62 трлн, отражая снижение на 2,3–2,9 процента за последние 24 часа на фоне снижения оборота спот- и фьючерсных сделок. Доминация биткоина остается повышенной на уровне 58,5–59,5 процента, подтверждая концентрацию капитала в BTC, в то время как широта альткоинов остается узкой (Индекс Альтсезона около 35–36, при лидерстве биткоина). Индекс Fear and Greed находится в диапазоне 67–76, что классифицируется как «Жадность»; однако недавние показания снизились по сравнению с более высокими экстремумами, сигнализируя о том, что остаточный риск-аппетит умеряется фиксацией прибыли. Открытый интерес по деривативам сократился на 3–4 процента, а ликвидации за 24 часа превысили $400–560 млн, при этом перекос смещен в сторону лонгов.
Обзор крипторынка и фьючерсные сигналы для 5 крупнейших монет
Совокупная капитализация крипторынка держится около $2,62 трлн, отражая снижение на 2,3–2,9 процента за последние 24 часа на фоне снижения оборота спот- и фьючерсных сделок. Доминация биткоина остается повышенной на уровне 58,5–59,5 процента, подтверждая концентрацию капитала в BTC, в то время как широта альткоинов остается узкой (Индекс Альтсезона около 35–36, при лидерстве биткоина). Индекс Fear and Greed находится в диапазоне 67–76, что классифицируется как «Жадность»; однако недавние показания снизились по сравнению с более высокими экстремумами, сигнализируя о том, что остаточный риск-аппетит умеряется фиксацией прибыли. Открытый интерес по деривативам сократился на 3–4 процента, а ликвидации за 24 часа превысили $400–560 млн, при этом перекос смещен в сторону лонгов.
88
Обзор криптовалютного рынка и безопасная зона входа для пяти крупнейших монет.Совокупный рынок консолидируется после бурного августовского всплеска в середине месяца, который поднял общую капитализацию с диапазона около 2,6 трлн до коридора 2,77–2,80 трлн. CoinGecko оценивает текущую капитализацию примерно в 2,777 трлн долларов: изменение за 24 часа составляет 0,1%, а объем спотовых торгов — около 94,5 млрд долларов. Доля биткоина держится около 57,5% по данным CoinGecko и в диапазоне 57,9–59,7% по снимкам CoinGlass и CryptoRank, подтверждая, что рост по-прежнему лидируется BTC, а не является полномасштабным сезоном альткоинов. Доля Ethereum составляет примерно 10,8–11,3%. Alternative.me Fear and Greed показывает 73 (Greed — «жадность») 28 августа после 71 27 августа и 65 26 августа; при этом CoinMarketCap по-прежнему отображает 80 Extreme Greed («крайняя жадность») на некоторых дашбордах. Это расхождение важно: настроение жадное, но охват уже сузился, а ликвидации за 24 часа остаются двусторонними, а не чистым шорт-сквизом.
Обзор криптовалютного рынка и безопасная зона входа для пяти крупнейших монет.
Совокупный рынок консолидируется после бурного августовского всплеска в середине месяца, который поднял общую капитализацию с диапазона около 2,6 трлн до коридора 2,77–2,80 трлн. CoinGecko оценивает текущую капитализацию примерно в 2,777 трлн долларов: изменение за 24 часа составляет 0,1%, а объем спотовых торгов — около 94,5 млрд долларов. Доля биткоина держится около 57,5% по данным CoinGecko и в диапазоне 57,9–59,7% по снимкам CoinGlass и CryptoRank, подтверждая, что рост по-прежнему лидируется BTC, а не является полномасштабным сезоном альткоинов. Доля Ethereum составляет примерно 10,8–11,3%. Alternative.me Fear and Greed показывает 73 (Greed — «жадность») 28 августа после 71 27 августа и 65 26 августа; при этом CoinMarketCap по-прежнему отображает 80 Extreme Greed («крайняя жадность») на некоторых дашбордах. Это расхождение важно: настроение жадное, но охват уже сузился, а ликвидации за 24 часа остаются двусторонними, а не чистым шорт-сквизом.
133
Обзор рынка и сигналы по фьючерсамОбщая капитализация крипторынка находится рядом с 2.67–2.76 трлн USD при умеренном росте за 24 часа на 1.2–1.5 процента и повышенном объёме spot+деривативов, превышающем в ряде случаев 140 млрд USD. Доминация Bitcoin удерживается в диапазоне 57.7–59.7 процента, отражая продолжающееся лидерство BTC, при этом доля ETH держится около 11.0–11.3 процента. Показания индекса Fear & Greed группируются между 57 (Greed) и 80 (Extreme Greed) по источникам, указывая на риск‑аппетит, смягчённый недавним short-covering’ом, а не на неконтролируемую эйфорию. Метрики сезона альткоинов остаются сдержанными, причём Bitcoin всё ещё опережает за последние 30 дней. Открытый интерес на крупных перпетуалах остаётся высоким; ставки funding положительные, но умеренные (BTC и ETH около 0.005–0.010 процента), а ликвидационная активность демонстрирует сбалансированное давление long/short без экстремальных односторонних каскадов. Макро‑катализаторы включают продолжающееся восстановление чистого притока в US spot Bitcoin ETF, сигналы регуляторной ясности вокруг законопроекта CLARITY Act и обновлений по рамкам SEC, а также более широкую чувствительность к рисковым активам по DXY и динамике казначейства. В ближайшие 24–72 часа базовый сценарий — продолжение в диапазоне с лёгким бычьим уклоном, если потоки в ETF сохранятся и не материализуется резкая сила доллара; пробой ниже ключевых пулов ликвидности переведёт структуру из нейтральной в медвежью.
Обзор рынка и сигналы по фьючерсам
Общая капитализация крипторынка находится рядом с 2.67–2.76 трлн USD при умеренном росте за 24 часа на 1.2–1.5 процента и повышенном объёме spot+деривативов, превышающем в ряде случаев 140 млрд USD. Доминация Bitcoin удерживается в диапазоне 57.7–59.7 процента, отражая продолжающееся лидерство BTC, при этом доля ETH держится около 11.0–11.3 процента. Показания индекса Fear & Greed группируются между 57 (Greed) и 80 (Extreme Greed) по источникам, указывая на риск‑аппетит, смягчённый недавним short-covering’ом, а не на неконтролируемую эйфорию. Метрики сезона альткоинов остаются сдержанными, причём Bitcoin всё ещё опережает за последние 30 дней. Открытый интерес на крупных перпетуалах остаётся высоким; ставки funding положительные, но умеренные (BTC и ETH около 0.005–0.010 процента), а ликвидационная активность демонстрирует сбалансированное давление long/short без экстремальных односторонних каскадов. Макро‑катализаторы включают продолжающееся восстановление чистого притока в US spot Bitcoin ETF, сигналы регуляторной ясности вокруг законопроекта CLARITY Act и обновлений по рамкам SEC, а также более широкую чувствительность к рисковым активам по DXY и динамике казначейства. В ближайшие 24–72 часа базовый сценарий — продолжение в диапазоне с лёгким бычьим уклоном, если потоки в ETF сохранятся и не материализуется резкая сила доллара; пробой ниже ключевых пулов ликвидности переведёт структуру из нейтральной в медвежью.
6
Обзор рынка и фьючерсные сигналыСовокупная капитализация рынка криптовалют находится примерно на $2.64–$2.73 трлн, показывая умеренное снижение на 1.9%–2% за последние 24 часа после достижения максимумов сессии около $2.71 трлн. Доминантность Bitcoin держится на повышенных уровнях между 57.7% и 59.7%, что указывает на продолжающуюся концентрацию капитала в крупнейшем активе и ограниченную ротацию в альткоины. Индекс Fear and Greed сейчас равен 65 (Greed), ранее он откатился от 74 в предыдущий день после быстрого многонедельного роста с экстремальных значений страха около 25–27. Положительные ставки фандинга по основным perpetual-контрактам и устойчивые притоки в ETF (много дней чистый плюс для BTC-продуктов) поддерживают остаточный институциональный спрос, однако высокий открытый интерес и недавние кластеры ликвидаций сигнализируют о уязвимости к «сливам ликвидности». Макро-катализаторы включают остаточные эффекты комментариев по выкупам американского долга, предстоящие комментарии, связанные с Jackson Hole, а также постоянный мониторинг DXY и ожиданий по траектории ставок. Краткосрочный (24–72 часа) перекос остается нейтрально‑осторожно конструктивным по мажорам при условии удержания ключевой поддержки, но есть риск дальнейшей средней реversion, если экстремумы жадности привлекут фиксацию прибыли. Самые быстрорастущие нарративы сосредоточены на токенизации Real‑World Assets (RWA), пересечении AI и крипто, гибридах DePIN, инфраструктуре стейблкоинов и механизмах доходности, росте ликвидности perpetual DEX, а также остаточной активности приватности/zero‑knowledge. Мемекоин-ы и отдельные сегменты DeFi демонстрируют эпизодическую скорость, но без устойчивого подтверждения институционального потока заявок. Среди лидеров за последние 24 часа: Hyperliquid (HYPE) растет примерно на 2.8–3.4% на фоне расширения открытого интереса, Zcash (ZEC) демонстрирует высокую волатильность с размахами более 5–6%, небольшие по капитализации активы вроде BTR показывают рост около 30%, BMT фиксирует непропорционально большие процентные движения выше 50% на тонкой ликвидности, а отдельные названия включая PORTAL и EDEN публикуют двузначные процентные приросты. Общая динамика крупных капитализаций остается смешанной: SOL и XRP находятся под относительным давлением.
Обзор рынка и фьючерсные сигналы
Совокупная капитализация рынка криптовалют находится примерно на $2.64–$2.73 трлн, показывая умеренное снижение на 1.9%–2% за последние 24 часа после достижения максимумов сессии около $2.71 трлн. Доминантность Bitcoin держится на повышенных уровнях между 57.7% и 59.7%, что указывает на продолжающуюся концентрацию капитала в крупнейшем активе и ограниченную ротацию в альткоины. Индекс Fear and Greed сейчас равен 65 (Greed), ранее он откатился от 74 в предыдущий день после быстрого многонедельного роста с экстремальных значений страха около 25–27. Положительные ставки фандинга по основным perpetual-контрактам и устойчивые притоки в ETF (много дней чистый плюс для BTC-продуктов) поддерживают остаточный институциональный спрос, однако высокий открытый интерес и недавние кластеры ликвидаций сигнализируют о уязвимости к «сливам ликвидности». Макро-катализаторы включают остаточные эффекты комментариев по выкупам американского долга, предстоящие комментарии, связанные с Jackson Hole, а также постоянный мониторинг DXY и ожиданий по траектории ставок. Краткосрочный (24–72 часа) перекос остается нейтрально‑осторожно конструктивным по мажорам при условии удержания ключевой поддержки, но есть риск дальнейшей средней реversion, если экстремумы жадности привлекут фиксацию прибыли. Самые быстрорастущие нарративы сосредоточены на токенизации Real‑World Assets (RWA), пересечении AI и крипто, гибридах DePIN, инфраструктуре стейблкоинов и механизмах доходности, росте ликвидности perpetual DEX, а также остаточной активности приватности/zero‑knowledge. Мемекоин-ы и отдельные сегменты DeFi демонстрируют эпизодическую скорость, но без устойчивого подтверждения институционального потока заявок. Среди лидеров за последние 24 часа: Hyperliquid (HYPE) растет примерно на 2.8–3.4% на фоне расширения открытого интереса, Zcash (ZEC) демонстрирует высокую волатильность с размахами более 5–6%, небольшие по капитализации активы вроде BTR показывают рост около 30%, BMT фиксирует непропорционально большие процентные движения выше 50% на тонкой ликвидности, а отдельные названия включая PORTAL и EDEN публикуют двузначные процентные приросты. Общая динамика крупных капитализаций остается смешанной: SOL и XRP находятся под относительным давлением.
78
См. перевод
Market Overview and Futures Signals.Aggregate crypto market capitalization holds near 2.66 to 2.68 trillion USD after briefly testing higher levels earlier in the session, with 24-hour volume elevated above 100 billion USD across spot and derivatives. Bitcoin dominance sits in the 59.2 to 59.7 percent range, reflecting continued capital concentration in BTC amid selective altcoin participation. Fear and Greed Index registers between 73 and 81, firmly in greed to extreme greed territory following the multi-day short-covering rally that pushed BTC through the 80 000 psychological barrier for the first time since May. Positive ETF net flows (BTC approximately 336 million USD, ETH approximately 116 million USD in the latest reported session) and elevated perpetual funding rates (majors near 0.01 percent, longs paying) confirm institutional order flow remains constructive on dips, though elevated open interest and recent liquidation clusters around prior highs introduce mean-reversion risk over the next 24 to 72 hours. Macro catalysts remain muted in the immediate window with no major FOMC or CPI prints imminent; residual dollar debasement narrative and residual short-squeeze momentum continue to support risk assets, while any sharp DXY rebound or profit-taking could trigger liquidity hunts below recent range lows.
Top trending narratives center on Solana ecosystem strength (LSTs, DeFi, and related tokens), privacy-focused assets led by ZEC weekly outperformance, AI-agent and virtuals-protocol tokens, meme and high-beta small-cap rotation, and residual recovery flows into large-cap L1s after the prior week’s forced short covering. Highest-velocity 24-hour movers across futures and spot include Measurable Data Token (MDT) with gains exceeding 280 percent, Ampleforth Governance (FORTH) above 70 percent, ONG near 26 to 37 percent, Stacks (STX) approximately 13 to 14 percent, JasmyCoin (JASMY) near 11 to 13 percent, LayerZero (ZRO) approximately 8 percent, Aerodrome Finance (AERO) near 5 to 12 percent, and selective Solana-related and AI-narrative tokens posting double-digit advances; these moves are driven by low-float liquidity grabs, narrative rotation, and residual short covering rather than broad structural breakouts.
BTCUSDT
Live Price (aggregated): 79200
Position: LONG
Entry: 78500 to 78800
Stop-Loss: 77850
Take Profit 1: 80200
Take Profit 2: 81200
Take Profit 3: 82500
Take Profit 4: 84000
Valid Reason: Price has established a higher-low sequence after the liquidity sweep below 78000 and subsequent BOS above 80000, with EMA 8 and 20 aligned bullishly on H1 and H4. Order-book imbalances show bid clusters near 78500 to 78700 acting as a mitigation block after the prior AMD cycle. Positive funding, rising OI on the advance, and residual short-liquidation heat above 80500 support continuation once the current pullback fills the FVG left on the move through 80000. RSI remains above 50 on higher timeframes without extreme divergence, while CVD and delta favor accumulation on dips. Macro support from ETF inflows reinforces the institutional bid.
Position: SHORT
Entry: 80500 to 81000
Stop-Loss: 81800
Take Profit 1: 79200
Take Profit 2: 78000
Take Profit 3: 76500
Take Profit 4: 75000
Valid Reason: Rejection at the 81000 to 81200 liquidity pool after the initial break of 80000 creates a potential MSS on lower timeframes if price fails to hold above the prior BOS. High funding rates and elevated OI increase the probability of a liquidity hunt lower into the 78000 equal lows zone. EMA 50 on H4 still lags the advance, creating room for a mean-reversion CHoCH if volume fades at the highs. Liquidation heatmaps show dense short-side clusters already cleared, leaving long-side liquidity below as the next magnet.
ETHUSDT
Live Price (aggregated): 2475
Position: LONG
Entry: 2440 to 2455
Stop-Loss: 2395
Take Profit 1: 2520
Take Profit 2: 2580
Take Profit 3: 2650
Take Profit 4: 2750
Valid Reason: ETH tracks BTC structure with a clear higher-low formation and FVG fill opportunity in the 2440 zone after the recent push toward 2500. H1 and H4 EMAs remain stacked bullishly, RSI holds above midpoint, and open interest expansion on the prior leg indicates institutional accumulation. Bid-side liquidity pools near 2440 to 2450 coincide with prior mitigation levels; positive funding and ETF inflows provide additional order-flow support for continuation once the current consolidation resolves higher.
Position: SHORT
Entry: 2520 to 2550
Stop-Loss: 2595
Take Profit 1: 2470
Take Profit 2: 2400
Take Profit 3: 2320
Take Profit 4: 2250
Valid Reason: Failure to sustain above the 2520 to 2550 liquidity cluster after the recent rally would generate a lower-timeframe MSS, targeting the equal lows and FVG below 2470. Elevated funding and potential long-side liquidation heat create downside magnets if BTC rejects higher. Volume profile shows thinner support until the 2400 region, consistent with an AMD distribution phase if buyers exhaust at the highs.
BNBUSDT
Live Price (aggregated): 698
Position: LONG
Entry: 688 to 692
Stop-Loss: 678
Take Profit 1: 715
Take Profit 2: 730
Take Profit 3: 750
Take Profit 4: 780
Valid Reason: BNB maintains relative strength within the large-cap complex, holding above key H4 support after the broader market recovery. EMA alignment remains constructive, and order-flow data shows sustained bid interest near 690. A pullback into the 688 to 692 liquidity zone offers a high-probability mitigation entry aligned with the higher-timeframe uptrend, supported by positive funding and residual institutional flows into exchange-related tokens.
Position: SHORT
Entry: 715 to 725
Stop-Loss: 738
Take Profit 1: 700
Take Profit 2: 685
Take Profit 3: 665
Take Profit 4: 640
Valid Reason: Rejection of the 720 to 725 resistance cluster after the recent advance would confirm a short-term CHoCH, targeting the liquidity resting below 700. Relative lag versus SOL and elevated market-wide OI increase the probability of a rotation lower if BTC fails to extend.
SOLUSDT
Live Price (aggregated): 98.10
Position: LONG
Entry: 96.20 to 96.80
Stop-Loss: 94.50
Take Profit 1: 101.50
Take Profit 2: 105.00
Take Profit 3: 110.00
Take Profit 4: 118.00
Valid Reason: SOL leads the L1 recovery with clear BOS structure and strong relative performance. The 96.20 to 96.80 zone represents a fair-value gap and prior liquidity pool that has already been partially mitigated. EMA 8/20/50 alignment on H1 and H4 remains bullish, RSI holds constructive, and open-interest expansion plus ecosystem narrative flows support continuation. Positive funding and higher-timeframe order flow favor long entries on dips into this demand zone.
Position: SHORT
Entry: 101.50 to 103.00
Stop-Loss: 105.50
Take Profit 1: 98.00
Take Profit 2: 95.00
Take Profit 3: 91.00
Take Profit 4: 86.00
Valid Reason: Failure to hold above the 101 to 103 liquidity magnet after the recent rally would generate a lower-timeframe market-structure shift, targeting the equal lows and unfilled FVGs below. High relative volume and potential long-side liquidation clusters create downside asymmetry if broader market momentum stalls.
XRPUSDT
Live Price (aggregated): 1.47
Position: LONG
Entry: 1.445 to 1.455
Stop-Loss: 1.415
Take Profit 1: 1.52
Take Profit 2: 1.58
Take Profit 3: 1.65
Take Profit 4: 1.75
Valid Reason: XRP retains the strongest weekly structure among majors after the prior expansion. The 1.445 to 1.455 region coincides with a prior mitigation block and bid-side liquidity after the recent pullback. H4 EMAs remain supportive, and residual institutional interest continues to provide a floor. A reclaim of local structure with volume confirmation offers a clean long setup aligned with the higher-timeframe trend.
Position: SHORT
Entry: 1.52 to 1.55
Stop-Loss: 1.585
Take Profit 1: 1.47
Take Profit 2: 1.42
Take Profit 3: 1.36
Take Profit 4: 1.28
Valid Reason: Rejection at the 1.52 to 1.55 resistance cluster after multiple tests would confirm short-term distribution, targeting the liquidity pools below 1.47. Elevated weekly gains increase the probability of profit-taking and a liquidity hunt lower if BTC fails to extend the range.
Session Summary - Directional Bias (Bullish/Bearish/Neutral)
Asset: BTCUSDT
Trend: Bullish
LONG: 78500 to 78800
Context: Higher-low structure after 80000 BOS with bid liquidity and positive funding supporting continuation on dips.
SHORT: 80500 to 81000
Context: Potential rejection and MSS at prior liquidity highs if volume fails to expand, targeting lower equal lows.
Asset: ETHUSDT
Trend: Bullish
LONG: 2440 to 2455
Context: Aligned with BTC higher-timeframe structure and FVG mitigation with ETF flow support.
SHORT: 2520 to 2550
Context: Failure at local resistance creates downside liquidity magnets into prior range lows.
Asset: BNBUSDT
Trend: Neutral to mildly bullish
LONG: 688 to 692
Context: Relative strength holding key demand with constructive EMA alignment.
SHORT: 715 to 725
Context: Rejection of resistance cluster favors mean reversion into lower liquidity.
Asset: SOLUSDT
Trend: Bullish
LONG: 96.20 to 96.80
Context: Leading L1 with clear BOS, ecosystem flows, and unfilled demand.
SHORT: 101.50 to 103.00
Context: Exhaustion at upper liquidity after strong relative move creates short opportunity on CHoCH.
Asset: XRPUSDT
Trend: Bullish
LONG: 1.445 to 1.455
Context: Strongest weekly structure among majors with residual bid interest at mitigation levels.
SHORT: 1.52 to 1.55
Context: Multi-test resistance rejection targets lower liquidity pools after extended weekly gains.
Disclaimer: All financial data and technical trade setups provided in this analysis are for educational and informational purposes only. Digital asset derivatives trading carries immense risk due to volatile price fluctuations and structural leverage components. Traders must implement strict risk management protocols and execute separate verifications before entering live market positions.
#DYOR #TYOR #BengalTrading #Pavel
Market Overview and Futures Signals.
Aggregate crypto market capitalization holds near 2.66 to 2.68 trillion USD after briefly testing higher levels earlier in the session, with 24-hour volume elevated above 100 billion USD across spot and derivatives. Bitcoin dominance sits in the 59.2 to 59.7 percent range, reflecting continued capital concentration in BTC amid selective altcoin participation. Fear and Greed Index registers between 73 and 81, firmly in greed to extreme greed territory following the multi-day short-covering rally that pushed BTC through the 80 000 psychological barrier for the first time since May. Positive ETF net flows (BTC approximately 336 million USD, ETH approximately 116 million USD in the latest reported session) and elevated perpetual funding rates (majors near 0.01 percent, longs paying) confirm institutional order flow remains constructive on dips, though elevated open interest and recent liquidation clusters around prior highs introduce mean-reversion risk over the next 24 to 72 hours. Macro catalysts remain muted in the immediate window with no major FOMC or CPI prints imminent; residual dollar debasement narrative and residual short-squeeze momentum continue to support risk assets, while any sharp DXY rebound or profit-taking could trigger liquidity hunts below recent range lows.
Top trending narratives center on Solana ecosystem strength (LSTs, DeFi, and related tokens), privacy-focused assets led by ZEC weekly outperformance, AI-agent and virtuals-protocol tokens, meme and high-beta small-cap rotation, and residual recovery flows into large-cap L1s after the prior week’s forced short covering. Highest-velocity 24-hour movers across futures and spot include Measurable Data Token (MDT) with gains exceeding 280 percent, Ampleforth Governance (FORTH) above 70 percent, ONG near 26 to 37 percent, Stacks (STX) approximately 13 to 14 percent, JasmyCoin (JASMY) near 11 to 13 percent, LayerZero (ZRO) approximately 8 percent, Aerodrome Finance (AERO) near 5 to 12 percent, and selective Solana-related and AI-narrative tokens posting double-digit advances; these moves are driven by low-float liquidity grabs, narrative rotation, and residual short covering rather than broad structural breakouts.
BTCUSDT
Live Price (aggregated): 79200
Position: LONG
Entry: 78500 to 78800
Stop-Loss: 77850
Take Profit 1: 80200
Take Profit 2: 81200
Take Profit 3: 82500
Take Profit 4: 84000
Valid Reason: Price has established a higher-low sequence after the liquidity sweep below 78000 and subsequent BOS above 80000, with EMA 8 and 20 aligned bullishly on H1 and H4. Order-book imbalances show bid clusters near 78500 to 78700 acting as a mitigation block after the prior AMD cycle. Positive funding, rising OI on the advance, and residual short-liquidation heat above 80500 support continuation once the current pullback fills the FVG left on the move through 80000. RSI remains above 50 on higher timeframes without extreme divergence, while CVD and delta favor accumulation on dips. Macro support from ETF inflows reinforces the institutional bid.
Position: SHORT
Entry: 80500 to 81000
Stop-Loss: 81800
Take Profit 1: 79200
Take Profit 2: 78000
Take Profit 3: 76500
Take Profit 4: 75000
Valid Reason: Rejection at the 81000 to 81200 liquidity pool after the initial break of 80000 creates a potential MSS on lower timeframes if price fails to hold above the prior BOS. High funding rates and elevated OI increase the probability of a liquidity hunt lower into the 78000 equal lows zone. EMA 50 on H4 still lags the advance, creating room for a mean-reversion CHoCH if volume fades at the highs. Liquidation heatmaps show dense short-side clusters already cleared, leaving long-side liquidity below as the next magnet.
ETHUSDT
Live Price (aggregated): 2475
Position: LONG
Entry: 2440 to 2455
Stop-Loss: 2395
Take Profit 1: 2520
Take Profit 2: 2580
Take Profit 3: 2650
Take Profit 4: 2750
Valid Reason: ETH tracks BTC structure with a clear higher-low formation and FVG fill opportunity in the 2440 zone after the recent push toward 2500. H1 and H4 EMAs remain stacked bullishly, RSI holds above midpoint, and open interest expansion on the prior leg indicates institutional accumulation. Bid-side liquidity pools near 2440 to 2450 coincide with prior mitigation levels; positive funding and ETF inflows provide additional order-flow support for continuation once the current consolidation resolves higher.
Position: SHORT
Entry: 2520 to 2550
Stop-Loss: 2595
Take Profit 1: 2470
Take Profit 2: 2400
Take Profit 3: 2320
Take Profit 4: 2250
Valid Reason: Failure to sustain above the 2520 to 2550 liquidity cluster after the recent rally would generate a lower-timeframe MSS, targeting the equal lows and FVG below 2470. Elevated funding and potential long-side liquidation heat create downside magnets if BTC rejects higher. Volume profile shows thinner support until the 2400 region, consistent with an AMD distribution phase if buyers exhaust at the highs.
BNBUSDT
Live Price (aggregated): 698
Position: LONG
Entry: 688 to 692
Stop-Loss: 678
Take Profit 1: 715
Take Profit 2: 730
Take Profit 3: 750
Take Profit 4: 780
Valid Reason: BNB maintains relative strength within the large-cap complex, holding above key H4 support after the broader market recovery. EMA alignment remains constructive, and order-flow data shows sustained bid interest near 690. A pullback into the 688 to 692 liquidity zone offers a high-probability mitigation entry aligned with the higher-timeframe uptrend, supported by positive funding and residual institutional flows into exchange-related tokens.
Position: SHORT
Entry: 715 to 725
Stop-Loss: 738
Take Profit 1: 700
Take Profit 2: 685
Take Profit 3: 665
Take Profit 4: 640
Valid Reason: Rejection of the 720 to 725 resistance cluster after the recent advance would confirm a short-term CHoCH, targeting the liquidity resting below 700. Relative lag versus SOL and elevated market-wide OI increase the probability of a rotation lower if BTC fails to extend.
SOLUSDT
Live Price (aggregated): 98.10
Position: LONG
Entry: 96.20 to 96.80
Stop-Loss: 94.50
Take Profit 1: 101.50
Take Profit 2: 105.00
Take Profit 3: 110.00
Take Profit 4: 118.00
Valid Reason: SOL leads the L1 recovery with clear BOS structure and strong relative performance. The 96.20 to 96.80 zone represents a fair-value gap and prior liquidity pool that has already been partially mitigated. EMA 8/20/50 alignment on H1 and H4 remains bullish, RSI holds constructive, and open-interest expansion plus ecosystem narrative flows support continuation. Positive funding and higher-timeframe order flow favor long entries on dips into this demand zone.
Position: SHORT
Entry: 101.50 to 103.00
Stop-Loss: 105.50
Take Profit 1: 98.00
Take Profit 2: 95.00
Take Profit 3: 91.00
Take Profit 4: 86.00
Valid Reason: Failure to hold above the 101 to 103 liquidity magnet after the recent rally would generate a lower-timeframe market-structure shift, targeting the equal lows and unfilled FVGs below. High relative volume and potential long-side liquidation clusters create downside asymmetry if broader market momentum stalls.
XRPUSDT
Live Price (aggregated): 1.47
Position: LONG
Entry: 1.445 to 1.455
Stop-Loss: 1.415
Take Profit 1: 1.52
Take Profit 2: 1.58
Take Profit 3: 1.65
Take Profit 4: 1.75
Valid Reason: XRP retains the strongest weekly structure among majors after the prior expansion. The 1.445 to 1.455 region coincides with a prior mitigation block and bid-side liquidity after the recent pullback. H4 EMAs remain supportive, and residual institutional interest continues to provide a floor. A reclaim of local structure with volume confirmation offers a clean long setup aligned with the higher-timeframe trend.
Position: SHORT
Entry: 1.52 to 1.55
Stop-Loss: 1.585
Take Profit 1: 1.47
Take Profit 2: 1.42
Take Profit 3: 1.36
Take Profit 4: 1.28
Valid Reason: Rejection at the 1.52 to 1.55 resistance cluster after multiple tests would confirm short-term distribution, targeting the liquidity pools below 1.47. Elevated weekly gains increase the probability of profit-taking and a liquidity hunt lower if BTC fails to extend the range.
Session Summary - Directional Bias (Bullish/Bearish/Neutral)
Asset: BTCUSDT
Trend: Bullish
LONG: 78500 to 78800
Context: Higher-low structure after 80000 BOS with bid liquidity and positive funding supporting continuation on dips.
SHORT: 80500 to 81000
Context: Potential rejection and MSS at prior liquidity highs if volume fails to expand, targeting lower equal lows.
Asset: ETHUSDT
Trend: Bullish
LONG: 2440 to 2455
Context: Aligned with BTC higher-timeframe structure and FVG mitigation with ETF flow support.
SHORT: 2520 to 2550
Context: Failure at local resistance creates downside liquidity magnets into prior range lows.
Asset: BNBUSDT
Trend: Neutral to mildly bullish
LONG: 688 to 692
Context: Relative strength holding key demand with constructive EMA alignment.
SHORT: 715 to 725
Context: Rejection of resistance cluster favors mean reversion into lower liquidity.
Asset: SOLUSDT
Trend: Bullish
LONG: 96.20 to 96.80
Context: Leading L1 with clear BOS, ecosystem flows, and unfilled demand.
SHORT: 101.50 to 103.00
Context: Exhaustion at upper liquidity after strong relative move creates short opportunity on CHoCH.
Asset: XRPUSDT
Trend: Bullish
LONG: 1.445 to 1.455
Context: Strongest weekly structure among majors with residual bid interest at mitigation levels.
SHORT: 1.52 to 1.55
Context: Multi-test resistance rejection targets lower liquidity pools after extended weekly gains.
Disclaimer: All financial data and technical trade setups provided in this analysis are for educational and informational purposes only. Digital asset derivatives trading carries immense risk due to volatile price fluctuations and structural leverage components. Traders must implement strict risk management protocols and execute separate verifications before entering live market positions.
#DYOR #TYOR #BengalTrading #Pavel
Top trending narratives center on Solana ecosystem strength (LSTs, DeFi, and related tokens), privacy-focused assets led by ZEC weekly outperformance, AI-agent and virtuals-protocol tokens, meme and high-beta small-cap rotation, and residual recovery flows into large-cap L1s after the prior week’s forced short covering. Highest-velocity 24-hour movers across futures and spot include Measurable Data Token (MDT) with gains exceeding 280 percent, Ampleforth Governance (FORTH) above 70 percent, ONG near 26 to 37 percent, Stacks (STX) approximately 13 to 14 percent, JasmyCoin (JASMY) near 11 to 13 percent, LayerZero (ZRO) approximately 8 percent, Aerodrome Finance (AERO) near 5 to 12 percent, and selective Solana-related and AI-narrative tokens posting double-digit advances; these moves are driven by low-float liquidity grabs, narrative rotation, and residual short covering rather than broad structural breakouts.
BTCUSDT
Live Price (aggregated): 79200
Position: LONG
Entry: 78500 to 78800
Stop-Loss: 77850
Take Profit 1: 80200
Take Profit 2: 81200
Take Profit 3: 82500
Take Profit 4: 84000
Valid Reason: Price has established a higher-low sequence after the liquidity sweep below 78000 and subsequent BOS above 80000, with EMA 8 and 20 aligned bullishly on H1 and H4. Order-book imbalances show bid clusters near 78500 to 78700 acting as a mitigation block after the prior AMD cycle. Positive funding, rising OI on the advance, and residual short-liquidation heat above 80500 support continuation once the current pullback fills the FVG left on the move through 80000. RSI remains above 50 on higher timeframes without extreme divergence, while CVD and delta favor accumulation on dips. Macro support from ETF inflows reinforces the institutional bid.
Position: SHORT
Entry: 80500 to 81000
Stop-Loss: 81800
Take Profit 1: 79200
Take Profit 2: 78000
Take Profit 3: 76500
Take Profit 4: 75000
Valid Reason: Rejection at the 81000 to 81200 liquidity pool after the initial break of 80000 creates a potential MSS on lower timeframes if price fails to hold above the prior BOS. High funding rates and elevated OI increase the probability of a liquidity hunt lower into the 78000 equal lows zone. EMA 50 on H4 still lags the advance, creating room for a mean-reversion CHoCH if volume fades at the highs. Liquidation heatmaps show dense short-side clusters already cleared, leaving long-side liquidity below as the next magnet.
ETHUSDT
Live Price (aggregated): 2475
Position: LONG
Entry: 2440 to 2455
Stop-Loss: 2395
Take Profit 1: 2520
Take Profit 2: 2580
Take Profit 3: 2650
Take Profit 4: 2750
Valid Reason: ETH tracks BTC structure with a clear higher-low formation and FVG fill opportunity in the 2440 zone after the recent push toward 2500. H1 and H4 EMAs remain stacked bullishly, RSI holds above midpoint, and open interest expansion on the prior leg indicates institutional accumulation. Bid-side liquidity pools near 2440 to 2450 coincide with prior mitigation levels; positive funding and ETF inflows provide additional order-flow support for continuation once the current consolidation resolves higher.
Position: SHORT
Entry: 2520 to 2550
Stop-Loss: 2595
Take Profit 1: 2470
Take Profit 2: 2400
Take Profit 3: 2320
Take Profit 4: 2250
Valid Reason: Failure to sustain above the 2520 to 2550 liquidity cluster after the recent rally would generate a lower-timeframe MSS, targeting the equal lows and FVG below 2470. Elevated funding and potential long-side liquidation heat create downside magnets if BTC rejects higher. Volume profile shows thinner support until the 2400 region, consistent with an AMD distribution phase if buyers exhaust at the highs.
BNBUSDT
Live Price (aggregated): 698
Position: LONG
Entry: 688 to 692
Stop-Loss: 678
Take Profit 1: 715
Take Profit 2: 730
Take Profit 3: 750
Take Profit 4: 780
Valid Reason: BNB maintains relative strength within the large-cap complex, holding above key H4 support after the broader market recovery. EMA alignment remains constructive, and order-flow data shows sustained bid interest near 690. A pullback into the 688 to 692 liquidity zone offers a high-probability mitigation entry aligned with the higher-timeframe uptrend, supported by positive funding and residual institutional flows into exchange-related tokens.
Position: SHORT
Entry: 715 to 725
Stop-Loss: 738
Take Profit 1: 700
Take Profit 2: 685
Take Profit 3: 665
Take Profit 4: 640
Valid Reason: Rejection of the 720 to 725 resistance cluster after the recent advance would confirm a short-term CHoCH, targeting the liquidity resting below 700. Relative lag versus SOL and elevated market-wide OI increase the probability of a rotation lower if BTC fails to extend.
SOLUSDT
Live Price (aggregated): 98.10
Position: LONG
Entry: 96.20 to 96.80
Stop-Loss: 94.50
Take Profit 1: 101.50
Take Profit 2: 105.00
Take Profit 3: 110.00
Take Profit 4: 118.00
Valid Reason: SOL leads the L1 recovery with clear BOS structure and strong relative performance. The 96.20 to 96.80 zone represents a fair-value gap and prior liquidity pool that has already been partially mitigated. EMA 8/20/50 alignment on H1 and H4 remains bullish, RSI holds constructive, and open-interest expansion plus ecosystem narrative flows support continuation. Positive funding and higher-timeframe order flow favor long entries on dips into this demand zone.
Position: SHORT
Entry: 101.50 to 103.00
Stop-Loss: 105.50
Take Profit 1: 98.00
Take Profit 2: 95.00
Take Profit 3: 91.00
Take Profit 4: 86.00
Valid Reason: Failure to hold above the 101 to 103 liquidity magnet after the recent rally would generate a lower-timeframe market-structure shift, targeting the equal lows and unfilled FVGs below. High relative volume and potential long-side liquidation clusters create downside asymmetry if broader market momentum stalls.
XRPUSDT
Live Price (aggregated): 1.47
Position: LONG
Entry: 1.445 to 1.455
Stop-Loss: 1.415
Take Profit 1: 1.52
Take Profit 2: 1.58
Take Profit 3: 1.65
Take Profit 4: 1.75
Valid Reason: XRP retains the strongest weekly structure among majors after the prior expansion. The 1.445 to 1.455 region coincides with a prior mitigation block and bid-side liquidity after the recent pullback. H4 EMAs remain supportive, and residual institutional interest continues to provide a floor. A reclaim of local structure with volume confirmation offers a clean long setup aligned with the higher-timeframe trend.
Position: SHORT
Entry: 1.52 to 1.55
Stop-Loss: 1.585
Take Profit 1: 1.47
Take Profit 2: 1.42
Take Profit 3: 1.36
Take Profit 4: 1.28
Valid Reason: Rejection at the 1.52 to 1.55 resistance cluster after multiple tests would confirm short-term distribution, targeting the liquidity pools below 1.47. Elevated weekly gains increase the probability of profit-taking and a liquidity hunt lower if BTC fails to extend the range.
Session Summary - Directional Bias (Bullish/Bearish/Neutral)
Asset: BTCUSDT
Trend: Bullish
LONG: 78500 to 78800
Context: Higher-low structure after 80000 BOS with bid liquidity and positive funding supporting continuation on dips.
SHORT: 80500 to 81000
Context: Potential rejection and MSS at prior liquidity highs if volume fails to expand, targeting lower equal lows.
Asset: ETHUSDT
Trend: Bullish
LONG: 2440 to 2455
Context: Aligned with BTC higher-timeframe structure and FVG mitigation with ETF flow support.
SHORT: 2520 to 2550
Context: Failure at local resistance creates downside liquidity magnets into prior range lows.
Asset: BNBUSDT
Trend: Neutral to mildly bullish
LONG: 688 to 692
Context: Relative strength holding key demand with constructive EMA alignment.
SHORT: 715 to 725
Context: Rejection of resistance cluster favors mean reversion into lower liquidity.
Asset: SOLUSDT
Trend: Bullish
LONG: 96.20 to 96.80
Context: Leading L1 with clear BOS, ecosystem flows, and unfilled demand.
SHORT: 101.50 to 103.00
Context: Exhaustion at upper liquidity after strong relative move creates short opportunity on CHoCH.
Asset: XRPUSDT
Trend: Bullish
LONG: 1.445 to 1.455
Context: Strongest weekly structure among majors with residual bid interest at mitigation levels.
SHORT: 1.52 to 1.55
Context: Multi-test resistance rejection targets lower liquidity pools after extended weekly gains.
Disclaimer: All financial data and technical trade setups provided in this analysis are for educational and informational purposes only. Digital asset derivatives trading carries immense risk due to volatile price fluctuations and structural leverage components. Traders must implement strict risk management protocols and execute separate verifications before entering live market positions.
#DYOR #TYOR #BengalTrading #Pavel
84
Анализ рынкаДействующие справочные цены по состоянию на самые последние доступные котировки вокруг 25 августа 2026 года (цены меняются непрерывно; считайте это приблизительным институциональным срезом): BTC около 78700–78900, ETH около 2475–2480, BNB около 701–704, SOL около 97–98, XRP около 1.47–1.48, XAUUSD около 4655–4675. Общая капитализация крипторынка находится примерно на уровне 2.67–2.68 трлн при доминировании BTC около 59 процентов. Потоки спотовых Bitcoin ETF остаются положительными на протяжении нескольких дней, хотя последняя дневная публикация скромная. Индикатор Fear & Greed находится в зоне greed (жадности) примерно около 73. Недавняя недельная динамика демонстрирует сильное расширение: BTC примерно +22 процента, ETH +29 процентов, SOL +28 процентов, XRP +47 процентов, BNB +16 процентов; золото также растет на том же импульсе ликвидности со стороны Казначейства.
Анализ рынка
Действующие справочные цены по состоянию на самые последние доступные котировки вокруг 25 августа 2026 года (цены меняются непрерывно; считайте это приблизительным институциональным срезом): BTC около 78700–78900, ETH около 2475–2480, BNB около 701–704, SOL около 97–98, XRP около 1.47–1.48, XAUUSD около 4655–4675. Общая капитализация крипторынка находится примерно на уровне 2.67–2.68 трлн при доминировании BTC около 59 процентов. Потоки спотовых Bitcoin ETF остаются положительными на протяжении нескольких дней, хотя последняя дневная публикация скромная. Индикатор Fear & Greed находится в зоне greed (жадности) примерно около 73. Недавняя недельная динамика демонстрирует сильное расширение: BTC примерно +22 процента, ETH +29 процентов, SOL +28 процентов, XRP +47 процентов, BNB +16 процентов; золото также растет на том же импульсе ликвидности со стороны Казначейства.
55
Обзор рынка и сигналы фьючерсовСовокупная капитализация криптовалютного рынка находится near 2,67 трлн долларов США: примерно на 2% выше за последние 24 часа, при этом объемы торгов превышают 100 млрд долларов США как на спотовом, так и на срочном рынках. Доминирование биткоина удерживается в диапазоне 57–59%, отражая продолжающуюся концентрацию капитала в крупнейшем активе, тогда как некоторые альткоины демонстрируют рост. Индекс страха и жадности показывает 81, что уверенно находится в зоне «Крайняя жадность» после резкого подъема с уровней середины 40-х в начале недели; это согласуется с вынужденными ликвидациями short на сумму свыше 200 млн долларов США в предыдущие сессии и благоприятными притоками по спотовым ETF.
Обзор рынка и сигналы фьючерсов
Совокупная капитализация криптовалютного рынка находится near 2,67 трлн долларов США: примерно на 2% выше за последние 24 часа, при этом объемы торгов превышают 100 млрд долларов США как на спотовом, так и на срочном рынках. Доминирование биткоина удерживается в диапазоне 57–59%, отражая продолжающуюся концентрацию капитала в крупнейшем активе, тогда как некоторые альткоины демонстрируют рост. Индекс страха и жадности показывает 81, что уверенно находится в зоне «Крайняя жадность» после резкого подъема с уровней середины 40-х в начале недели; это согласуется с вынужденными ликвидациями short на сумму свыше 200 млн долларов США в предыдущие сессии и благоприятными притоками по спотовым ETF.
69
Обзор рынка и сигнал фьючерсовСовокупная капитализация крипторынка держится на уровне около $2.63T–$2.65T, а колебания за 24 часа остаются умеренными: от плоского изменения до +1.4 процента в зависимости от агрегатора данных. Доля биткоина находится в диапазоне от 58.3 процента до 59.3 процента, отражая продолжение лидерства BTC после сильного недельного роста, превышающего 20 процентов. Показания индекса Fear and Greed сосредоточены в диапазоне 73–79, уверенно находясь в зоне Greed после быстрого восстановления с прежних уровней Fear. Притоки по спотовым ETF сохраняют поддержку на протяжении нескольких дней, особенно для продуктов на BTC и ETH.
Обзор рынка и сигнал фьючерсов
Совокупная капитализация крипторынка держится на уровне около $2.63T–$2.65T, а колебания за 24 часа остаются умеренными: от плоского изменения до +1.4 процента в зависимости от агрегатора данных. Доля биткоина находится в диапазоне от 58.3 процента до 59.3 процента, отражая продолжение лидерства BTC после сильного недельного роста, превышающего 20 процентов. Показания индекса Fear and Greed сосредоточены в диапазоне 73–79, уверенно находясь в зоне Greed после быстрого восстановления с прежних уровней Fear. Притоки по спотовым ETF сохраняют поддержку на протяжении нескольких дней, особенно для продуктов на BTC и ETH.
104
Обзор криптовалютного рынка и сигнал по фьючерсамГлобальная капитализация рынка криптовалют оценивается примерно в 2,71 трлн долларов, отражая устойчивое расширение на 7,5% за последние 24 часа. Доля Bitcoin (BTC.D) удерживается на уровне 56,63%, сохраняя основное структурное влияние на распределение общей ликвидности, тогда как альткоины демонстрируют избирательный импульс. Индекс Crypto Fear and Greed находится в зоне жадности — 68 — чему способствуют масштабные притоки в спотовые биржевые фонды (ETF) и сохраняющиеся «шорты» с подавлением позиций на крупных площадках деривативов. На глобальных биржах общий объем ликвидаций за 24 часа превысил 380 млн долларов, при этом доминировали вынужденные покупки со стороны шортов (buy-backs) после того, как ценовое движение вернуло ключевые структурные уровни в виде более высоких максимумов (higher-high). Макроэкономический фон остается осторожно позитивным; участники рынка активно закладывают смягчение денежно-кредитной политики в ожидании предстоящих решений по ставке Федерального комитета по операциям на открытом рынке (FOMC), а Индекс доллара США (DXY) продолжает нисходящее движение к ключевым уровням поддержки на более низких таймфреймах, подпитывая классическую среду risk-on. Предстоящие катализаторы, включая публикации non-farm payrolls и глобальные геополитические события, продолжают добавлять волатильность в институциональный поток заявок, что приводит к резким «ликвидити-сафари» вокруг высокоплотных пулов кредитного плеча.
Обзор криптовалютного рынка и сигнал по фьючерсам
Глобальная капитализация рынка криптовалют оценивается примерно в 2,71 трлн долларов, отражая устойчивое расширение на 7,5% за последние 24 часа. Доля Bitcoin (BTC.D) удерживается на уровне 56,63%, сохраняя основное структурное влияние на распределение общей ликвидности, тогда как альткоины демонстрируют избирательный импульс. Индекс Crypto Fear and Greed находится в зоне жадности — 68 — чему способствуют масштабные притоки в спотовые биржевые фонды (ETF) и сохраняющиеся «шорты» с подавлением позиций на крупных площадках деривативов. На глобальных биржах общий объем ликвидаций за 24 часа превысил 380 млн долларов, при этом доминировали вынужденные покупки со стороны шортов (buy-backs) после того, как ценовое движение вернуло ключевые структурные уровни в виде более высоких максимумов (higher-high). Макроэкономический фон остается осторожно позитивным; участники рынка активно закладывают смягчение денежно-кредитной политики в ожидании предстоящих решений по ставке Федерального комитета по операциям на открытом рынке (FOMC), а Индекс доллара США (DXY) продолжает нисходящее движение к ключевым уровням поддержки на более низких таймфреймах, подпитывая классическую среду risk-on. Предстоящие катализаторы, включая публикации non-farm payrolls и глобальные геополитические события, продолжают добавлять волатильность в институциональный поток заявок, что приводит к резким «ликвидити-сафари» вокруг высокоплотных пулов кредитного плеча.
292
Анализ BTCБиткоин сейчас торгуется вблизи диапазона $72 000–$72 800 после резкого расширения в течение нескольких дней, которое подняло цену с середины $60 000 до прежних максимумов диапазона. Данное движение обладает признаками институционального вытеснения: агрессивные тела свечей, повышенный объем и цепочка шорт-сквиза, которая расчистила ликвидность на стороне продавцов выше потолка прежней консолидации.
Немедленная поддержка располагается в диапазоне $69 000–$70 000. Эта зона отмечает область принятия прорыва и территорию, где предыдущий максимум диапазона был решительно пробит. Устойчивое удержание здесь сохраняет краткосрочную бычью рыночную структуру. Ниже уровень $67 000–$67 200 действует как основная структурная поддержка. Это была точка контроля по объему и сопротивление, которое ограничивало предшествующие недели консолидации; именно его конверсия в спрос является ключевым институциональным ориентиром. Чистая потеря этого уровня будет означать смену рыночной структуры вниз и откроет путь к кластеру $65 000–$66 000 (предыдущие пересечения EMA и верхняя граница более раннего диапазона), при этом более глубоко защищенная полка сохраняется на $62 000–$63 000.
Анализ BTC
Биткоин сейчас торгуется вблизи диапазона $72 000–$72 800 после резкого расширения в течение нескольких дней, которое подняло цену с середины $60 000 до прежних максимумов диапазона. Данное движение обладает признаками институционального вытеснения: агрессивные тела свечей, повышенный объем и цепочка шорт-сквиза, которая расчистила ликвидность на стороне продавцов выше потолка прежней консолидации.
Немедленная поддержка располагается в диапазоне $69 000–$70 000. Эта зона отмечает область принятия прорыва и территорию, где предыдущий максимум диапазона был решительно пробит. Устойчивое удержание здесь сохраняет краткосрочную бычью рыночную структуру. Ниже уровень $67 000–$67 200 действует как основная структурная поддержка. Это была точка контроля по объему и сопротивление, которое ограничивало предшествующие недели консолидации; именно его конверсия в спрос является ключевым институциональным ориентиром. Чистая потеря этого уровня будет означать смену рыночной структуры вниз и откроет путь к кластеру $65 000–$66 000 (предыдущие пересечения EMA и верхняя граница более раннего диапазона), при этом более глубоко защищенная полка сохраняется на $62 000–$63 000.
Немедленная поддержка располагается в диапазоне $69 000–$70 000. Эта зона отмечает область принятия прорыва и территорию, где предыдущий максимум диапазона был решительно пробит. Устойчивое удержание здесь сохраняет краткосрочную бычью рыночную структуру. Ниже уровень $67 000–$67 200 действует как основная структурная поддержка. Это была точка контроля по объему и сопротивление, которое ограничивало предшествующие недели консолидации; именно его конверсия в спрос является ключевым институциональным ориентиром. Чистая потеря этого уровня будет означать смену рыночной структуры вниз и откроет путь к кластеру $65 000–$66 000 (предыдущие пересечения EMA и верхняя граница более раннего диапазона), при этом более глубоко защищенная полка сохраняется на $62 000–$63 000.
62
SEC, CFTC и стратегические резервы формируют следующую эпоху цифровых активовКриптовалютный рынок развился из пепла глобального финансового кризиса 2008 года в основной класс макроэкономических активов. То, что начиналось с белой книги Биткоина от Сатоши Накамото как экспериментальная альтернатива денежной системе, сегодня стало ключевым фокусом мировой геополитики, институционального капитала и технологических инноваций. На протяжении последних полутора десятилетий цифровая экосистема активов проходила через экстремальную волатильность, смещаясь от спекулятивной розничной торговли к глубокой институциональной ликвидности и структурированным регуляторным рамкам.
SEC, CFTC и стратегические резервы формируют следующую эпоху цифровых активов
Криптовалютный рынок развился из пепла глобального финансового кризиса 2008 года в основной класс макроэкономических активов. То, что начиналось с белой книги Биткоина от Сатоши Накамото как экспериментальная альтернатива денежной системе, сегодня стало ключевым фокусом мировой геополитики, институционального капитала и технологических инноваций. На протяжении последних полутора десятилетий цифровая экосистема активов проходила через экстремальную волатильность, смещаясь от спекулятивной розничной торговли к глубокой институциональной ликвидности и структурированным регуляторным рамкам.
96
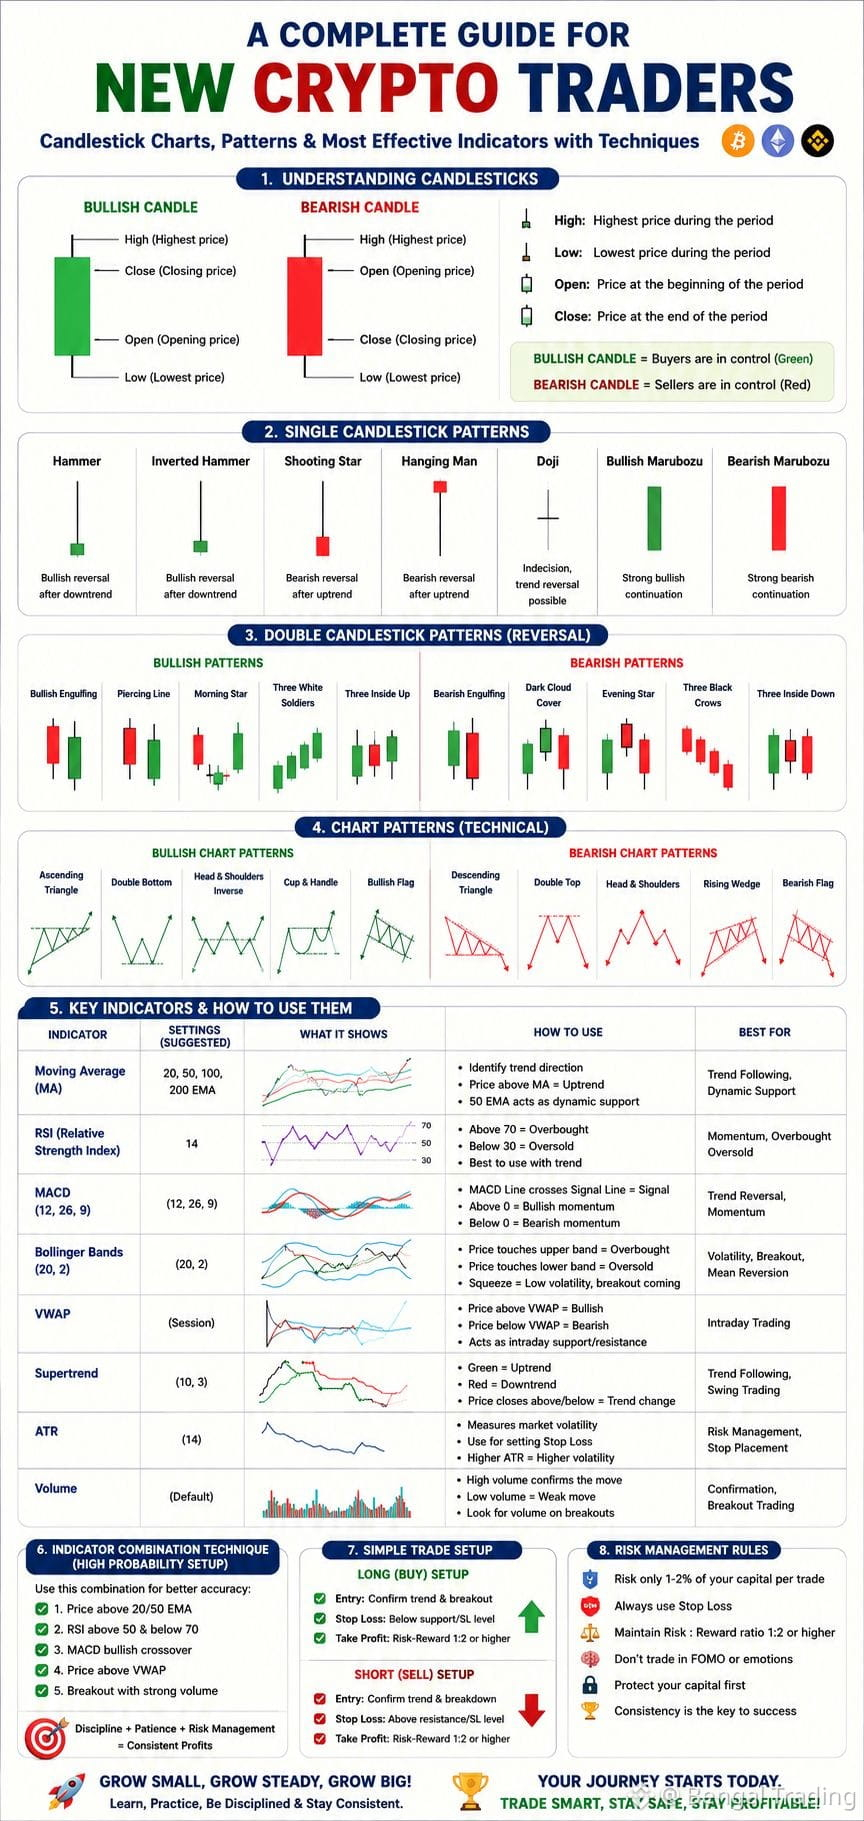
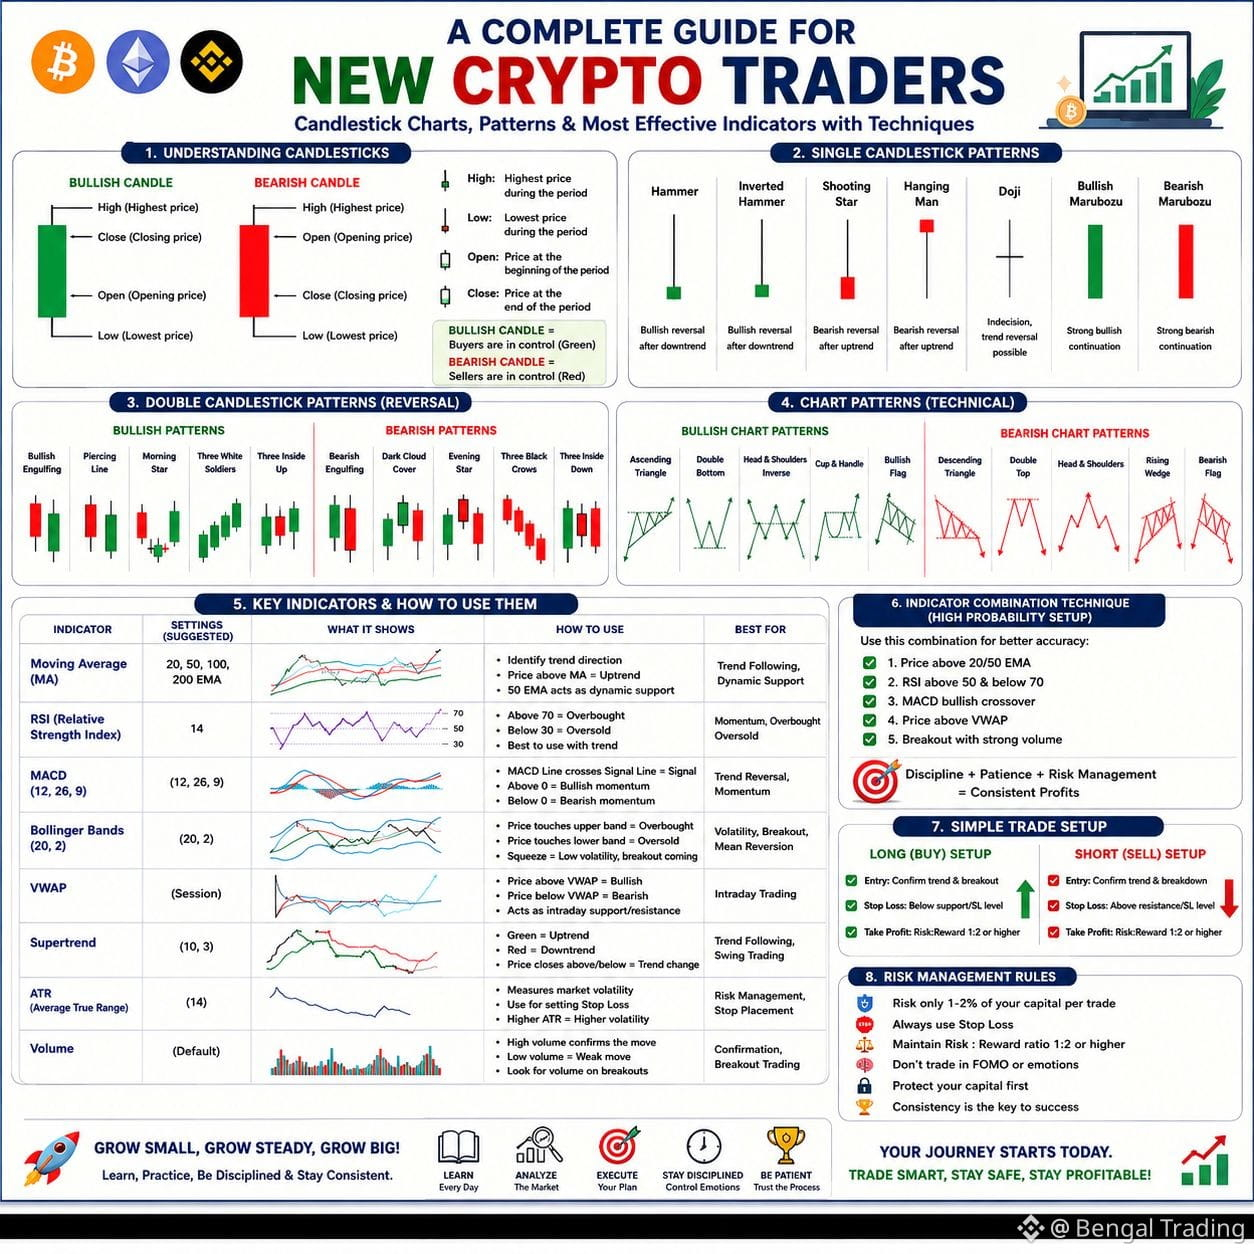
85
Внимание: будьте начеку, трейдеры.Вход в мир Web3 и криптовалют открывает огромные возможности наряду со значительными операционными и финансовыми рисками. Для новых розничных трейдеров навигация по экосистемам соцсетей — например, Telegram, X (ранее Twitter), Discord и TikTok — требует строгой бдительности. Мошенники, манипуляторы рынком и автоматизированные синдикаты активно используют энтузиазм розницы, применяя психологический инжиниринг, обещания высокой доходности и замаскированный вредоносный код.
Понимание того, как работают эти схемы, и внедрение строгих протоколов снижения рисков крайне важно для сохранения капитала.
Внимание: будьте начеку, трейдеры.
Вход в мир Web3 и криптовалют открывает огромные возможности наряду со значительными операционными и финансовыми рисками. Для новых розничных трейдеров навигация по экосистемам соцсетей — например, Telegram, X (ранее Twitter), Discord и TikTok — требует строгой бдительности. Мошенники, манипуляторы рынком и автоматизированные синдикаты активно используют энтузиазм розницы, применяя психологический инжиниринг, обещания высокой доходности и замаскированный вредоносный код.
Понимание того, как работают эти схемы, и внедрение строгих протоколов снижения рисков крайне важно для сохранения капитала.
Понимание того, как работают эти схемы, и внедрение строгих протоколов снижения рисков крайне важно для сохранения капитала.
1
6
🚨 КРИТИЧЕСКОЕ ПРЕДУПРЕЖДЕНИЕ О РИСКАХ: разбор механизма Web3-токена GROKUSDTКритическая оценка рисков токена GROKUSDT, размещённого на децентрализованных биржах через Web3-кошельки, выявляет серьёзные структурные угрозы, которые каждый розничный трейдер должен понимать. Недавно токен показал крайне искусственный скачок цены, превышающий 34 000 000%. Однако аудит смарт-контракта на блокчейне указывает, что этот токен почти полностью соответствует всем стандартным техническим признакам honeypot-мошенничества и надвигающейся схемы rugpull.
С точки зрения ончейн-метрик токен демонстрирует завышенную рыночную капитализацию примерно 77,39 трлн при фактической глубине ликвидного пула всего 565,01K. Такое огромное несоответствие создаётся за счёт пулов с нулевой глубиной и автоматизированного wash trading, предназначенных для обмана сканеров децентрализованных бирж и извлечения выгоды из страха розничных инвесторов упустить момент. Кроме того, токен характеризуется экстремальной концентрацией держателей: десять крупнейших адресов контролируют 99,94% обращающегося предложения при общей численности всего сорока трёх держателей. В ликвидных рыночных условиях одна сущность или кластер разработчиков удерживает полную власть над ценой, позволяя им устроить market-dump своих позиций и мгновенно обрушить цену актива до нуля.
🚨 КРИТИЧЕСКОЕ ПРЕДУПРЕЖДЕНИЕ О РИСКАХ: разбор механизма Web3-токена GROKUSDT
Критическая оценка рисков токена GROKUSDT, размещённого на децентрализованных биржах через Web3-кошельки, выявляет серьёзные структурные угрозы, которые каждый розничный трейдер должен понимать. Недавно токен показал крайне искусственный скачок цены, превышающий 34 000 000%. Однако аудит смарт-контракта на блокчейне указывает, что этот токен почти полностью соответствует всем стандартным техническим признакам honeypot-мошенничества и надвигающейся схемы rugpull.
С точки зрения ончейн-метрик токен демонстрирует завышенную рыночную капитализацию примерно 77,39 трлн при фактической глубине ликвидного пула всего 565,01K. Такое огромное несоответствие создаётся за счёт пулов с нулевой глубиной и автоматизированного wash trading, предназначенных для обмана сканеров децентрализованных бирж и извлечения выгоды из страха розничных инвесторов упустить момент. Кроме того, токен характеризуется экстремальной концентрацией держателей: десять крупнейших адресов контролируют 99,94% обращающегося предложения при общей численности всего сорока трёх держателей. В ликвидных рыночных условиях одна сущность или кластер разработчиков удерживает полную власть над ценой, позволяя им устроить market-dump своих позиций и мгновенно обрушить цену актива до нуля.
С точки зрения ончейн-метрик токен демонстрирует завышенную рыночную капитализацию примерно 77,39 трлн при фактической глубине ликвидного пула всего 565,01K. Такое огромное несоответствие создаётся за счёт пулов с нулевой глубиной и автоматизированного wash trading, предназначенных для обмана сканеров децентрализованных бирж и извлечения выгоды из страха розничных инвесторов упустить момент. Кроме того, токен характеризуется экстремальной концентрацией держателей: десять крупнейших адресов контролируют 99,94% обращающегося предложения при общей численности всего сорока трёх держателей. В ликвидных рыночных условиях одна сущность или кластер разработчиков удерживает полную власть над ценой, позволяя им устроить market-dump своих позиций и мгновенно обрушить цену актива до нуля.
79
Торгуйте с уверенностьюБИКО в настоящее время торгуется в диапазоне 0,035–0,05 на фоне высокой волатильности и показал резкий рост за последние 24 часа. Для снайперского входа следите за зоной со скидкой 0,032–0,038 после недавнего сайдсайд-ликвидити-скана, затем подтверждайте смену рыночной структуры, если появится буллиcкий ордер-блок или повторный тест FVG.
Торгуйте с уверенностью
БИКО в настоящее время торгуется в диапазоне 0,035–0,05 на фоне высокой волатильности и показал резкий рост за последние 24 часа. Для снайперского входа следите за зоной со скидкой 0,032–0,038 после недавнего сайдсайд-ликвидити-скана, затем подтверждайте смену рыночной структуры, если появится буллиcкий ордер-блок или повторный тест FVG.
58
Торгуйте с осторожностьюСогласно текущим рыночным данным, RIVER торгуется примерно около 2,50 долларов. С точки зрения SMC/ICT, ключевой фокус для sniper entry должен быть на ретесте institutional order block или fair value gap в зоне дисконта после недавнего sell-side liquidity grab. Сейчас цена находится в заметной коррекции от ATH, поэтому зону 2,20–2,35 можно отслеживать как потенциальную demand zone, где требуется подтверждение смены рыночной структуры в пользу быков.
Торгуйте с осторожностью
Согласно текущим рыночным данным, RIVER торгуется примерно около 2,50 долларов. С точки зрения SMC/ICT, ключевой фокус для sniper entry должен быть на ретесте institutional order block или fair value gap в зоне дисконта после недавнего sell-side liquidity grab. Сейчас цена находится в заметной коррекции от ATH, поэтому зону 2,20–2,35 можно отслеживать как потенциальную demand zone, где требуется подтверждение смены рыночной структуры в пользу быков.
82
Войдите, чтобы посмотреть больше материала
Присоединяйтесь к пользователям криптовалют по всему миру на Binance Square
⚡️ Получайте новейшую и полезную информацию о криптоактивах.
💬 Нам доверяет крупнейшая в мире криптобиржа.
👍 Получите достоверные аналитические данные от верифицированных создателей контента.
Эл. почта/номер телефона
В тренде
fomcотслеживание
Просмотров: 15,254
233 обсуждают
🚨 FOMC может снова встряхнуть крипторынок
#FOMC
ФРС пока держит ставку на уровне 3,50–3,75%, но самое интересное — рынок уже пытается понять, что будет дальше.
Почему криптоинвесторам стоит следить за FOMC?
💰 Ставки влияют на ликвидность.
📈 Ликвидность влияет на аппетит к риску.
₿ А Bitcoin часто одним из первых реагирует на изменение настроений.
Следующее заседание ФРС — 15–16 сентября.
И главный вопрос сейчас:
ФРС даст рынку надежду на смягчение или снова заставит инвесторов нервничать?
#fomcотслеживание
SmartHolder
·Лайков: 1
·Просмотров: 213
ПротоколFOMC
Просмотров: 7,487
49 обсуждают
SolanaFallsOver3%
Просмотров: 50,095
878 обсуждают