Take a look at the charts, because what’s happening right now is far too precise to be a coincidence.
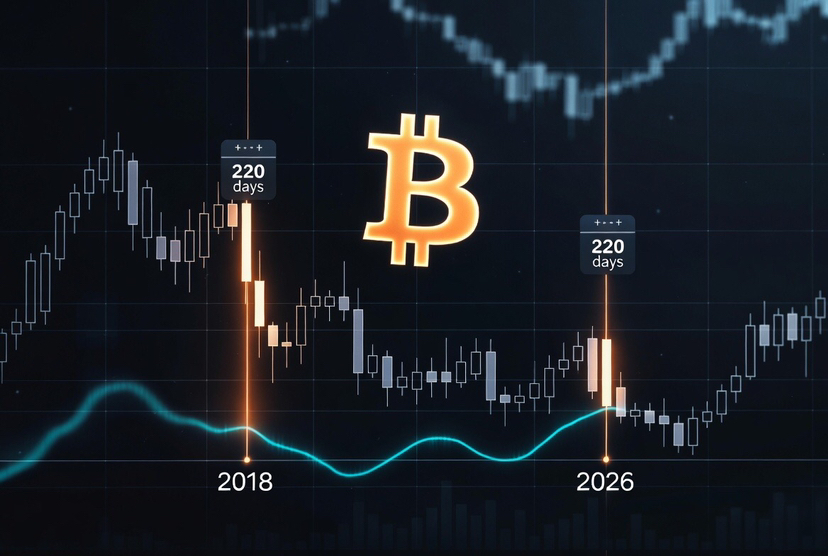
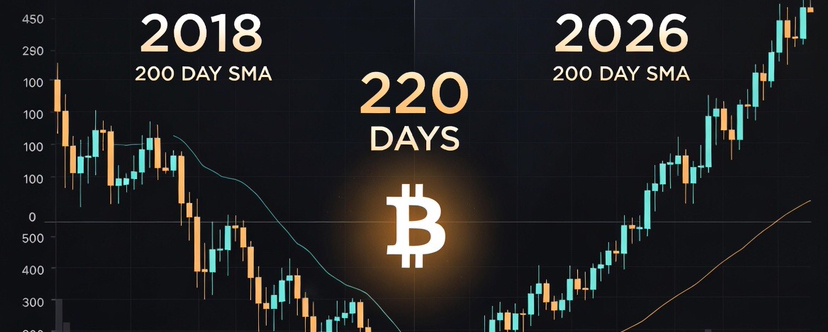
• Back in 2018: Bitcoin famously tapped its 200-day Simple Moving Average (SMA) after exactly 220 days.
• Fast forward to 2026: $BTC just tapped that exact same 200D SMA line. The timeline? Once again, precisely 220 days.
When macro algorithms and historical cycles align this perfectly, you have to sit up and pay attention. The big question on everyone's mind right now: Was $82,500 the local top, or are we just fueling up for the next leg higher?
What's your play here?
Are you taking some chips off the table, or buying the retest of the 200D SMA? Drop your targets in the comments below! 👇
#BitcoinETFsSee$131MNetInflows #BTC #BerkshireHeavilyIncreasesAlphabetStake #Write2Earn