
Key Highlights
$HYPE is up 55.44% year-to-date at $39.52 — outperforming Bitcoin (-24.20% YTD) and Ethereum (-32.70% YTD) by nearly 80 percentage points — one of the most significant performance divergences in the current top-20 market.
Hyperliquid ranks #3 globally by protocol revenue — generating $1.83M in 24 hours, $13.26M in 7 days, and $61.34M in 30 days — ahead of Pump.fun and Tron and behind only Tether and Circle.
HIP-3 recently broke two simultaneous ATHs — $5.4B in single-day perp volume and $1.8B in open interest — directly contributing to increased protocol revenue and HYPE token buybacks.
A BTC November 2020 fractal is forming on HYPE's daily chart — with an identical higher-low structure, 50 MA support, and consolidation approaching the $50.14 range high — a decisive break above which targets $80–$110.
Hyperliquid is one of the most compelling stories in the current crypto market — outperforming Bitcoin and Ethereum by a historic margin year-to-date, ranking third globally by protocol revenue, and forming a technical fractal that mirrors Bitcoin’s explosive 2020–2021 pre-parabolic setup almost perfectly. While the broader market remains under significant pressure, HYPE is sending an unambiguous signal — this is not speculative momentum but a fundamentally driven breakout supported by real, measurable on-chain revenue.
As of March 28, 2026, HYPE is trading at $39.52, up 1.86% in the past 24 hours and an extraordinary +55.44% year-to-date, with a market capitalization of $10.13 billion.
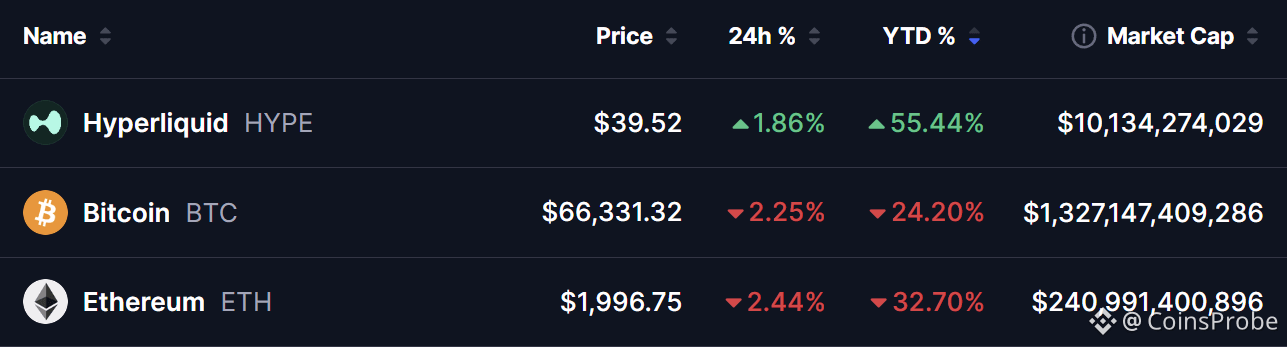 HYPE, BTC and ETH Prices/Source: Coinmarketcap
While Bitcoin is down 24.20% and Ethereum has shed 32.70% year-to-date — both deeply underperforming amid the risk-off environment driven by the ongoing US-Israel-Iran geopolitical conflict — HYPE has not only held its ground but accelerated significantly higher.
This divergence reflects a deliberate capital rotation by sophisticated investors into high-conviction platforms generating real, measurable on-chain revenue. As we first identified in our Hyperliquid institutional adoption analysis, the combination of Grayscale’s spot HYPE ETF filing, the licensed S&P 500 perpetual launch, and HIP-3’s record-breaking open interest growth has been driving sustained institutional interest in HYPE throughout early 2026.
Hyperliquid Revenue — Ranked #3 Globally
The most important fundamental signal in the current HYPE setup is not the price — it is the revenue. Hyperliquid continues to dominate the protocol revenue charts even in a choppy market environment where most DeFi platforms are experiencing volume and fee compression.
Revenue breakdown as of March 28, 2026:
24h Revenue: $1.83 million — Rank #3 globally
7d Revenue: $13.26 million
30d Revenue: $61.34 million
Hyperliquid sits behind only Tether ($16.38M / 24h) and Circle ($6.75M / 24h) — both stablecoin issuers with entirely different business models — and comfortably ahead of Pump.fun ($1.03M / 24h) and Tron ($981K / 24h).
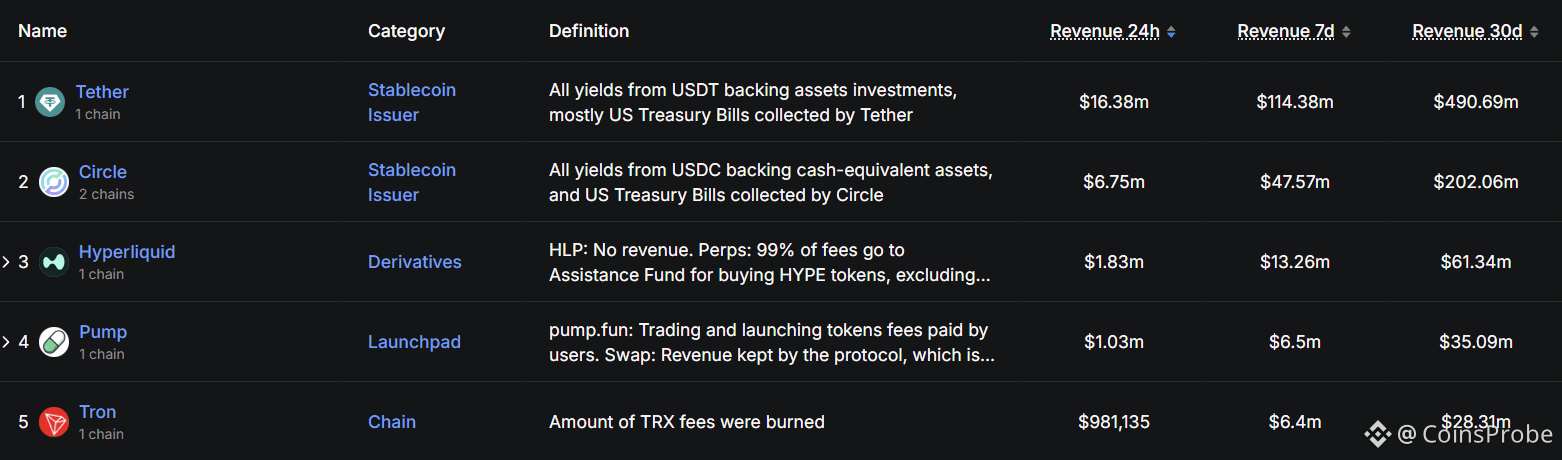 Hyperliquid Revenue/Source: defillama
Why the Revenue Model Creates Structural HYPE Demand:
Hyperliquid’s tokenomics create a direct, structural link between platform revenue and token value. 99% of all perpetual futures fees flow directly into an Assistance Fund — a protocol-controlled mechanism that uses these fees to buy back HYPE on the open market rather than distributing them to team members or VC investors.
This creates a powerful self-reinforcing flywheel:
Higher trading volume → More fees → More HYPE buybacks → Reduced circulating supply → Stronger token value alignment
The momentum behind this revenue has been further validated by HIP-3’s landmark performance. As we documented in detail in our HIP-3 double ATH analysis, Hyperliquid’s permissionless derivatives framework broke two simultaneous records on March 23, 2026:
$5.4 billion in single-day perpetuals volume — an all-time high
$1.8 billion in total open interest — a 620%+ surge from just $250 million in December 2025
These record-breaking HIP-3 metrics directly translate into higher protocol fee revenue — feeding the Assistance Fund buybacks that support HYPE’s price floor even as the broader crypto market corrects. The consistency of $61.34M in 30-day revenue — maintained even during BTC’s significant pullback — highlights Hyperliquid’s sticky user base, deep liquidity, and structural fee capture that operates independently of broader market sentiment.
BTC November 2020 Fractal — HYPE Setting Up for a Major Move
The most technically compelling aspect of the current HYPE setup is a striking fractal comparison with Bitcoin’s November 2020 weekly chart — the period that immediately preceded BTC’s most explosive parabolic run in history.
The BTC November 2020 Reference (Left Chart)
The weekly Bitcoin chart from 2018–2021 shows the classic pre-parabolic structure that every experienced crypto trader recognizes:
Multi-year accumulation base — Years of higher-low formation between 2018 and 2020 building the foundation for the explosive move
Range High at $19,798 — The 2017 all-time high that acted as the critical long-term resistance — once broken decisively in November 2020, it triggered the full parabolic expansion and the +227.22% move to $64,000
Range High at $13,970 — The 2020 local high acting as intermediate resistance before the ATH breakout
Range Low at $3,156 — The 2018 bear market cycle low
50-week MA as dynamic support — Price repeatedly defended the 50 MA before the final breakout confirmation
+227.22% move — BTC surged from approximately $10,000 to over $64,000 in just months after breaking above the $19,798 range high — its previous all-time high from 2017 — confirming the full parabolic expansion was underway
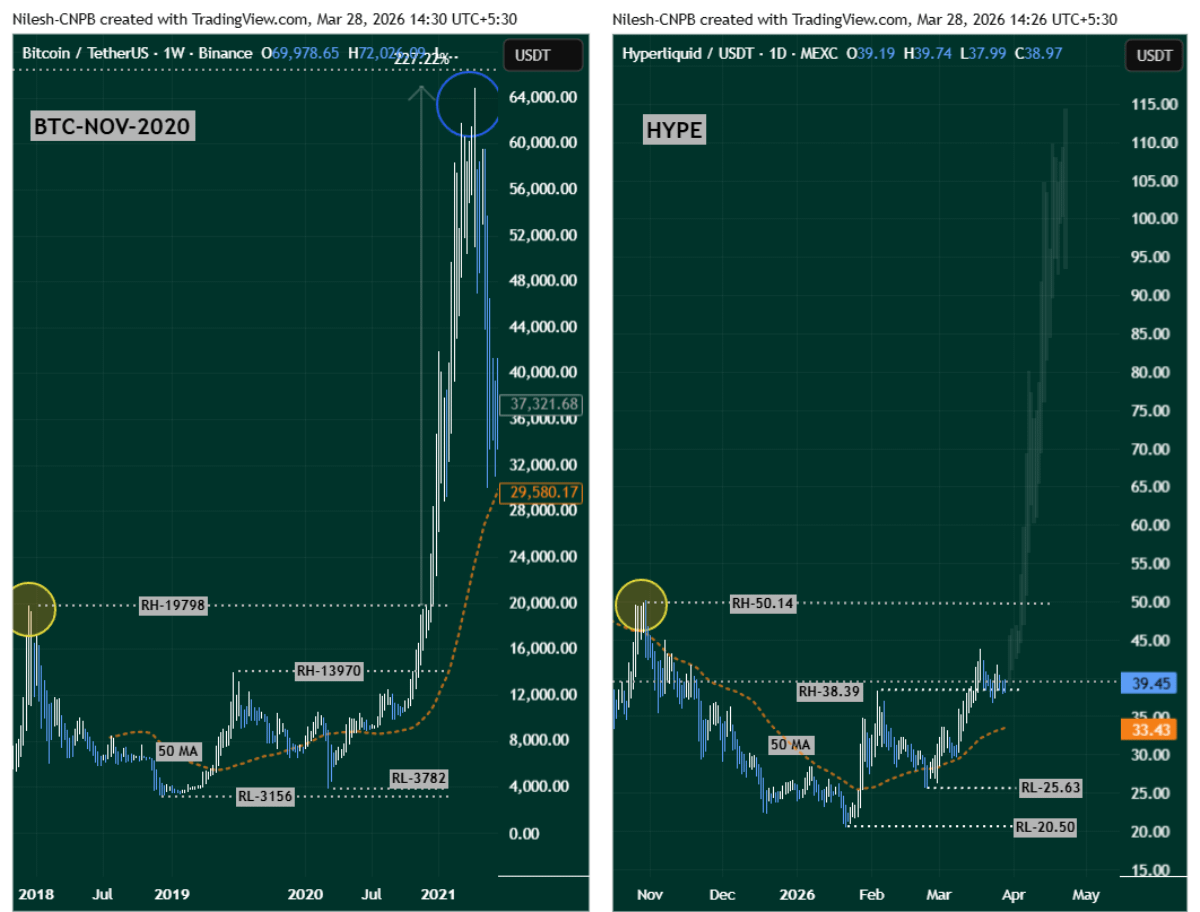 BTC and HYPE Fractal Chart
The HYPE Current Setup (Right Chart)
HYPE’s daily chart from November 2025 to May 2026 is mirroring this structure almost perfectly across four parallel elements:
Identical higher-low formation HYPE has been forming consistent higher lows since its cycle bottom near $20.50 — mirroring BTC’s multi-year accumulation base that preceded the 2020 breakout in both structure and tempo.
Range Lows at $20.50 and $25.63 HYPE established its cycle lows at $20.50 and $25.63 — the structural foundation of the current setup and the key invalidation zone for the fractal thesis if breached on a daily closing basis.
50 MA as dynamic support The 50-day moving average has been providing consistent support throughout HYPE’s recovery — mirroring BTC’s 50-week MA defense that built the foundation for the 2020 parabolic move and kept the structure intact through multiple retests.
Range High at $50.14 — The Critical Breakout Level The single most important level on the HYPE chart. The $50.14 range high is the exact structural equivalent of BTC’s $19,798 all-time high breakout in November 2020 — the resistance that, once broken with conviction, triggered the full parabolic expansion and the +227% move. HYPE is currently consolidating near $39.45 — approaching this level from below in a structure that mirrors BTC’s pre-breakout consolidation phase almost exactly.
What’s Next for HYPE?
The convergence of +55% YTD price outperformance, #3 global protocol revenue, 99% fee buyback tokenomics, HIP-3 record-breaking metrics, and a textbook BTC 2020 fractal approaching its critical breakout level creates one of the more high-conviction setups in the current crypto market.
As we covered in our Hyperliquid institutional analysis, the pending Grayscale HYPE ETF approval — alongside filings from Bitwise, VanEck, and 21Shares — could provide the external institutional catalyst that triggers the $50.14 breakout if approved during Q2 2026.
Bullish Scenario
A decisive daily close above $50.14 — mirroring BTC’s November 2020 breakout above $19,798 — its 2017 all-time high that once broken triggered the full parabolic run to $64,000
Confirms the fractal is fully playing out and triggers the measured move extension
$80–$110 target zone — based on the fractal extension equivalent to BTC’s post-breakout trajectory
HIP-3 volume and open interest continue expanding — feeding higher Assistance Fund buybacks that support the breakout
Grayscale HYPE ETF approval provides the institutional catalyst that accelerates the move
Bearish Scenario
A daily close below $33.43 — the 100-day MA support level — invalidates the fractal entirely
Signals HYPE needs to retest the $25.63 range low before the fractal can reset
Broader market deterioration — including BTC weakness below the key levels identified in our Bitcoin analysis — could delay the fractal timeline even if the structure remains intact
Hyperliquid isn’t just surviving the current market — it is thriving within it. Watch $50.14 for breakout confirmation. Watch $33.43 for invalidation. If $50.14 breaks with conviction, the next leg for HYPE could be one of the most explosive moves of 2026.
Frequently Asked Questions
Why is HYPE up 55% YTD while Bitcoin and Ethereum are both down significantly?
HYPE’s outperformance reflects deliberate capital rotation into platforms generating real, measurable on-chain revenue. Hyperliquid’s 99% fee buyback model — generating $61.34M in 30-day protocol revenue — creates direct structural demand for HYPE independent of broader market sentiment. Combined with HIP-3’s record $5.4B single-day volume and $1.8B open interest ATH, the fundamental case for HYPE diverging from the broader market is well-supported.
How does Hyperliquid’s revenue model benefit HYPE holders?
99% of all perpetual futures fees flow into an Assistance Fund that buys HYPE on the open market — creating direct structural linkage between platform revenue and token value. Higher trading volume generates more fees, which funds more buybacks, reducing circulating supply and strengthening the token’s fundamental support floor without relying on team distributions or VC token unlocks.
What is the BTC November 2020 fractal and how does it apply to HYPE?
The BTC November 2020 fractal refers to the period immediately before Bitcoin’s most explosive parabolic run — when BTC broke above its $19,798 all-time high from 2017 and surged over 227% to $64,000. HYPE’s current daily chart mirrors this structure almost exactly — with the same higher-low formation, 50 MA support, and consolidation approaching the $50.14 range high that represents the equivalent fractal breakout trigger.
What is HYPE’s price target if the BTC 2020 fractal plays out?
A decisive daily close above the $50.14 range high — mirroring BTC’s breakout above $19,798 — would confirm the fractal and target the $80–$110 zone based on the fractal extension equivalent to BTC’s post-breakout trajectory. Invalidation occurs on a daily close below the $33.43 support level aligned with the 100-day MA.
What is HIP-3 and how does it contribute to HYPE’s fundamental case?
HIP-3 is Hyperliquid’s permissionless derivatives framework that allows anyone to deploy perpetual futures markets for any asset on-chain. As documented in our HIP-3 ATH analysis, HIP-3 recently hit simultaneous all-time highs of $5.4B in daily volume and $1.8B in open interest — directly generating the protocol fees that fund HYPE buybacks through the Assistance Fund.
Why does Hyperliquid rank #3 globally by protocol revenue?
Hyperliquid’s ranking reflects its position as the dominant decentralized perpetuals exchange — generating $1.83M in 24h revenue from trading fees across its platform. Only Tether and Circle — both stablecoin issuers with structurally different revenue models — generate more. This ranking, achieved with only 11 team members and no VC token unlocks, represents one of the most capital-efficient revenue stories in all of crypto.
Disclaimer: The views and analysis presented in this article are for informational purposes only and reflect the author’s perspective, not financial advice. Technical patterns and indicators discussed are subject to market volatility and may or may not yield anticipated results. Investors are advised to exercise caution, conduct independent research, and make decisions aligned with their individual risk tolerance.