
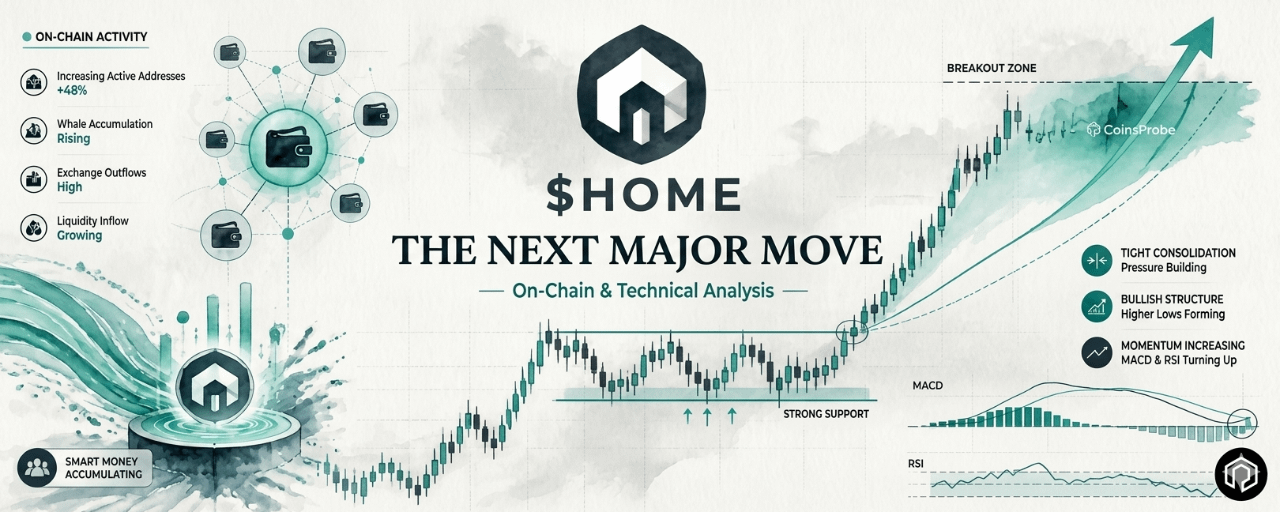

Key Highlights
$HOME is trading at $0.02482 — up +9.55% in 24 hours and +57.83% over 30 days — with a market cap of approximately $95.2 million.
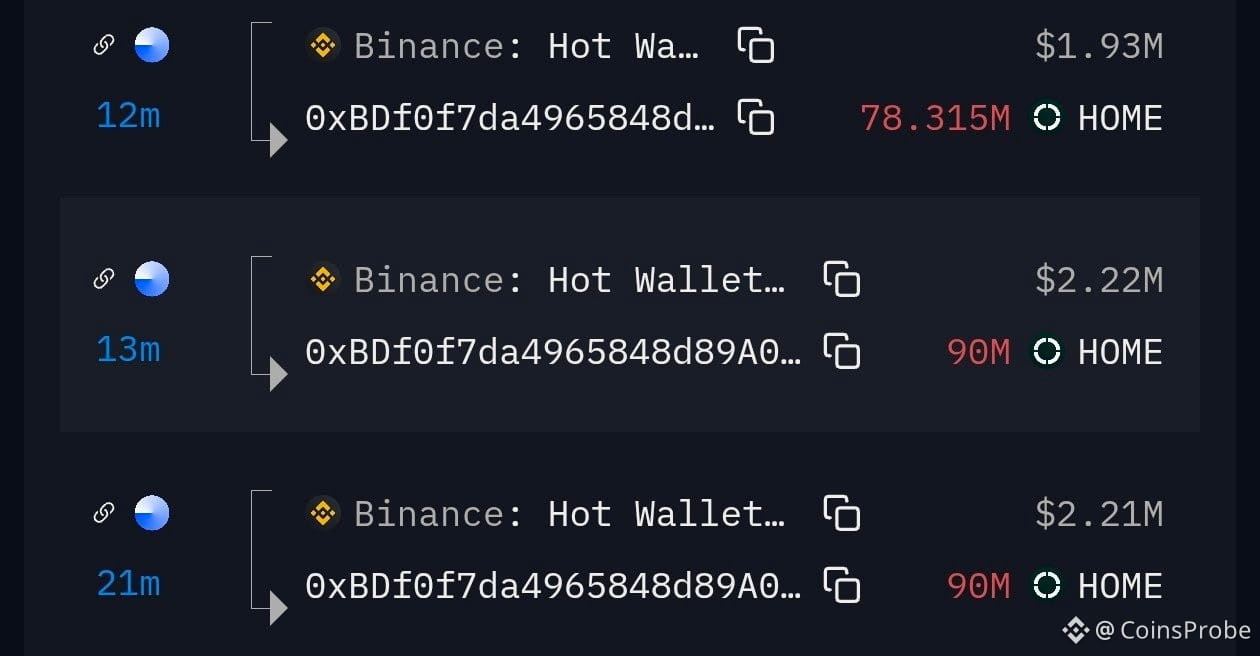
On-chain analyst @0xNoxxx has flagged a 258 million $HOME transfer to a fresh wallet (~$6.34M) — with no selling activity observed — a pattern the analyst has previously seen precede strong volume and price increases in other tokens.
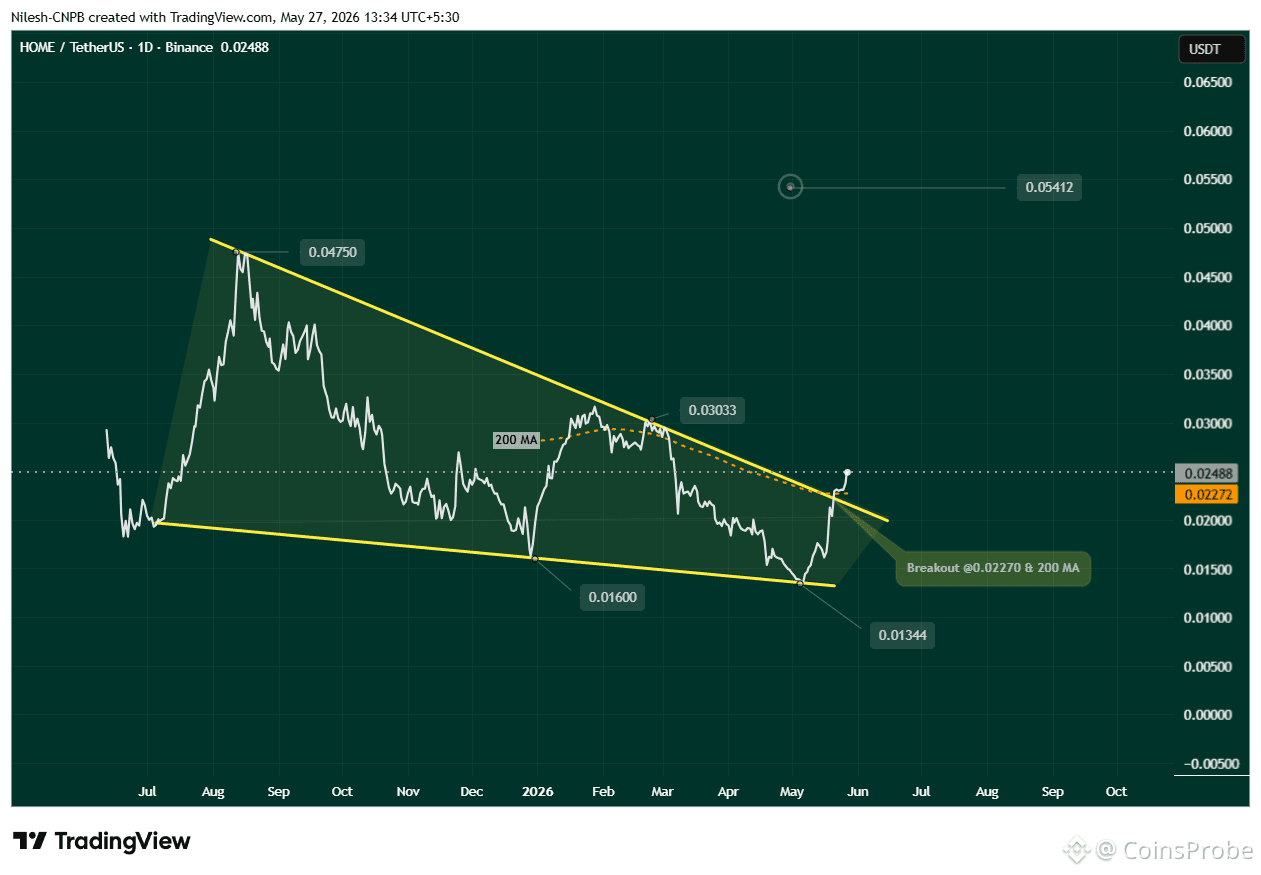
$HOME has completed a textbook falling wedge breakout on the daily chart — breaking above resistance near $0.02270 and reclaiming the 200-day moving average with volume confirmation.
Bullish target: $0.05412 — with the invalidation level at a sustained close below the 200 MA and trendline support near $0.020.
Defi App’s native token $HOME is building a setup that is attracting attention from both technical traders and on-chain analysts simultaneously — and that kind of dual-signal convergence is exactly the type of condition that precedes the strongest altcoin moves.
Trading at $0.02482 with a +57.83% 30-day performance and a $95.2 million market cap, $HOME has emerged from a prolonged consolidation phase with a clean technical breakout and a notable on-chain accumulation signal arriving at the same time. Neither signal alone would be sufficient to build a high-conviction thesis. Together — they create a setup worth tracking carefully.
 Defi APP (HOME) Price/Source: Coinmarketcap
On-Chain Signal — 258 Million $HOME to a Fresh Wallet
The first catalyst drawing attention is an on-chain movement flagged by analyst @0xNoxxx:
“A large amount of $HOME is currently being moved to a fresh wallet. So far, there hasn’t been any selling activity from those wallets. We previously saw similar patterns with $BEAT and $TAG, followed by strong volume and price increases. If selling starts from these wallets, then this thesis becomes invalid. Worth monitoring closely.”
Wallet in focus: 0xBDf0f7da4965848d89A026215bD6AbE05e4f8E6C Holdings: 258 million $HOME (~$6.34 million)
The significance of this signal lies in the pattern the analyst has identified across prior tokens. Large transfers to fresh wallets — without any immediate selling activity — have historically preceded strong volume and price appreciation in the tokens @0xNoxxx has tracked. The fresh wallet characteristic is key: this is not a known distribution address or a prior seller. It is a new address receiving a large position and holding it.
 Source: @0xNoxxx (X)
The analyst’s framing is important and worth preserving: this is not confirmation of a rally — it is a pattern worth monitoring. The thesis invalidates immediately if selling begins from these wallets. As long as the fresh wallet holds without selling — the accumulation narrative remains intact.
What to watch: Monitor 0xBDf0f7da4965848d89A026215bD6AbE05e4f8E6C for any outflows toward exchange deposit addresses. That movement — if it comes — is the signal that the accumulation thesis has reversed.
Technical Setup — Falling Wedge Breakout + 200 MA Reclaim
The on-chain signal arrives alongside a technical setup that is equally compelling — a textbook falling wedge breakout on the daily chart combined with a clean reclaim of the 200-day moving average.
The Pattern — Falling Wedge
During the broader correction phase, $HOME formed a falling wedge on the daily chart — defined by two converging downward-sloping trendlines, with lower highs and lower lows compressing into an increasingly tight range. The falling wedge is one of the most reliable bullish reversal patterns in technical analysis — reflecting diminishing selling momentum as price action tightens toward the apex.
The Breakout Sequence:
Step 1 — The bounce: $HOME made a decisive strong bounce from the lower support trendline near $0.01344 — the most critical technical low of the pattern and the level that defined the floor of the falling wedge structure.
Step 2 — The breakout: Price broke decisively above the falling wedge’s upper resistance trendline near $0.02270 — the level that had acted as resistance through the entire consolidation phase. The breakout was accompanied by volume — adding credibility to the move rather than flagging it as a low-conviction break.
 $HOME Daily Chart/Coinsprobe (Source: Tradingview)
Step 3 — The 200 MA reclaim: Simultaneously with the wedge breakout, $HOME reclaimed the 200-day moving average — one of the most widely watched trend-defining levels in financial markets. A sustained hold above the 200 MA signals that the longer-term trend has shifted from bearish to constructive.
Current position: $HOME is now trading in the $0.025 area — above the breakout level, above the 200 MA, and showing clear buyer conviction in the post-breakout consolidation.
What’s Next — Two Scenarios
Bullish Scenario
$HOME holds above the $0.02270–$0.023 breakout zone — ideally retesting and bouncing from this level to confirm it has flipped from resistance to support. With the retest confirmed and the on-chain accumulation wallet continuing to hold without selling — the falling wedge’s measured move target activates:
TargetLevelUpside from CurrentMeasured Move Target$0.05412~+118%
A sustained move toward $0.054 would represent a more than doubling of the current price — consistent with the kind of post-breakout expansion that falling wedge patterns produce when supported by genuine accumulation.
Bearish Scenario
A sustained daily close below the 200 MA and trendline support near $0.020 would invalidate the bullish setup entirely — signalling the breakout was a false move and returning focus to lower supports. The on-chain thesis also invalidates if selling begins from the 0xBDf0 fresh wallet — both signals failing simultaneously would be a strong warning to exit or avoid.
Bottom Line
$HOME is presenting a setup where the technical picture and the on-chain data are both telling the same story — a falling wedge breakout above the 200 MA with volume, and a 258 million token accumulation to a fresh wallet with no selling. When two independent signals from two different analytical frameworks converge at the same time — it creates a more robust thesis than either could produce alone.
The bullish case is valid above $0.020. A confirmed retest and hold of the $0.02270–$0.023 breakout zone strengthens the case for the $0.054 measured move target. The invalidation levels are clearly defined — and the on-chain wallet to monitor is publicly identified.
Watch the price. Watch the wallet. The setup is in place.
Disclaimer: The views and analysis presented in this article are for informational purposes only and reflect the author’s perspective, not financial advice. Technical patterns and indicators discussed are subject to market volatility and may or may not yield the anticipated results. Investors are advised to exercise caution, conduct independent research, and make decisions aligned with their individual risk tolerance.