The good days for the bulls are over. Bitcoin soared to a near two-week high of $79,438 on April 23, but has been bleeding ever since. By around 9 AM on April 28, it plummeted to a low of $76,324, currently quoted at $76,563, with a 24-hour drop of 3.26%. Ethereum is in even worse shape, crashing from yesterday's intraday high near $2,400 down to a low of $2,263, breaching the $2,300 mark decisively, and as of the time of writing, it's priced at $2,283, reflecting a 24-hour decline of about 4.01%. This widespread downturn has resulted in many long positions getting liquidated.
Behind this sharp sell-off, at least three forces are at play simultaneously. First is the pressure from the upcoming FOMC meeting. The Federal Reserve is holding a decision-making meeting from April 28 to 29, with results to be announced in the early hours of April 30 Beijing time. Currently, the market is pricing in a 99.9% probability of maintaining interest rates at 3.5%-3.75%. However, the concern is not about an interest rate hike but rather that Powell's stance may lean hawkish in his last meeting before stepping down on May 15, especially with the shadow of March's CPI-induced stagflation still looming; any hawkish remarks could suppress risk assets.
Additionally, geopolitical risks are rising. The US-Iran nuclear talks, previously hoped to be mediated by Pakistan, have now stalled. Tensions in the Strait of Hormuz are escalating, causing international oil prices to spike to $107 per barrel. This has led to increased risk aversion, with funds shifting to tangible commodities, putting pressure on the crypto market first.
Lastly, there's the issue of ETF buying. In April, Bitcoin spot ETFs saw an inflow of $2.43 billion, which sounds impressive, but a closer look reveals that the ETF buying is acting as an outlet for liquidity. It's providing an exit window for short-term holders rather than bringing in real long-term funds.
Market sentiment is changing rapidly. The Fear and Greed Index dropped from a neutral 47 yesterday to a fearful 33 today, matching levels from a week ago. This indicates that last week's brief recovery confidence has been completely wiped out by this sharp decline.
Bitcoin 4-hour chart
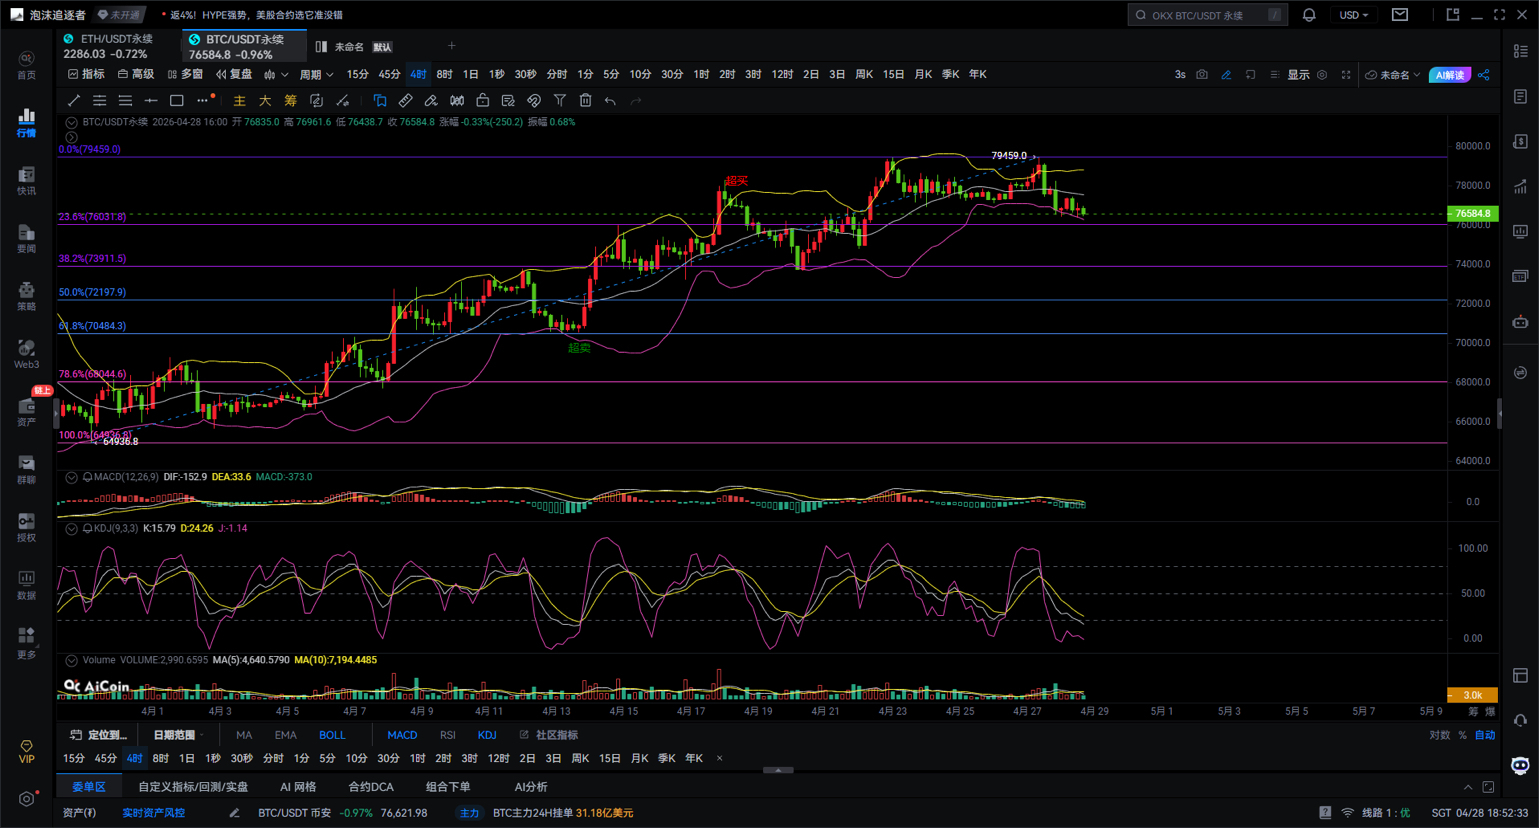
Currently, Bitcoin is priced around 76584, having previously surged to 79459 before retreating. The overall trend remains within a 4-hour bullish channel, and we are currently experiencing a normal pullback for correction, not a trend reversal. The main wave from 64936 to 79459 has completed, and we are now entering a high-level consolidation phase.
The MACD death cross has formed, with the red bars shrinking and turning green, while both DIF and DEA are trending down. This suggests that short-term funds are taking profits at highs, and the 4-hour level is entering a consolidation phase. Thus, we should be cautious in chasing longs until the MACD forms a new golden cross.
Currently, the KDJ lines are clearly downward: K value is 15, D value is 24, and the J value has approached negative territory. This indicates that the short-term has entered oversold territory, and the bears are nearing the end of their release. Typically, such positions are prone to technical rebounds, meaning further drops are limited, but a reversal needs further confirmation.
The current price has retraced near the middle band of the Bollinger Bands, and the upper band is starting to flatten. This indicates that upward momentum is weakening, and the market is entering a consolidation phase. The outcome around the middle band will determine the next direction. If it stabilizes above the middle band, we might see another rally; if it breaks below, we need to watch the lower band for support.
Based on the swing from 64936 to 79459, the 23.6% retracement level is at 76031, 38.2% at 73911, 50% at 72197, and 61.8% at 70484. The current price is oscillating near the 23.6% level, which indicates that the first support has been reached, and whether it can hold is crucial.
Future market trend prediction (key focus)
1. If 76000 holds (bullish bias). If the 4-hour close reclaims the range of 76800 to 77000, the market may again challenge 78000 and the previous high of 79459. A breakout above the previous high would target a new high of 80000.
2. If 76000 is lost (bearish bias). If it breaks below 76000 with volume, it may retrace to the strong support of 73900 or even the extreme level of 72197. This will be an opportunity for bulls to re-enter.
Suggestions are for reference only.
1. Short in batches in the 76850-77200 range, with a stop loss above 77680. First target is 76050, second target is 75200. If the price directly and effectively breaks below 76000, and a 15-minute close shows a solid bearish candle, then go short directly with a stop at 76350, targeting 75200-73900.
2. If a 15-minute bullish engulfing candlestick appears near 75200 during a pullback, we can consider a small position long, with a stop loss at 74800, targeting 76000-76800.
In summary, Daxian states that Bitcoin's 4-hour chart is currently in a bullish trend correction. The critical short-term line is at 76000; if it holds, we expect further highs, but if it breaks, we may need to look for opportunities around 73900.
Instead of giving you a 100% accurate suggestion, it's better to provide you with a correct mindset and trend. Teaching someone to fish is better than just giving them fish; a suggestion may earn you a quick profit, but a learned mindset will earn you for a lifetime!
Drafted on: (2026-04-28, 18:50)
(Note: Daxian's crypto insights) Disclaimer: Online information may be delayed; the above suggestions are for reference only. Investing carries risks; proceed with caution!$BTC
