The cryptocurrency market kicked off the second quarter of 2026 with a subtle balance. Bitcoin closed at 68300 USD on March 31, achieving its first monthly positive growth since September 2025. However, data shows that confidence has not fully returned behind this rebound.
The panic index fell to 8 yesterday, a level that has only been seen 7 times since 2018, and today it has slightly rebounded to 12, with market sentiment still frozen in the extreme fear zone. Against this backdrop, Bitcoin fluctuated from a daily high of 69171 to around 66230. The 24-hour decline is 2.63%. Ethereum followed a similar trend, dropping to around 2032, with a 24-hour decline of 1.13%, reflecting a contradictory market of 'high fear and low volatility.'
Bitcoin four-hour chart
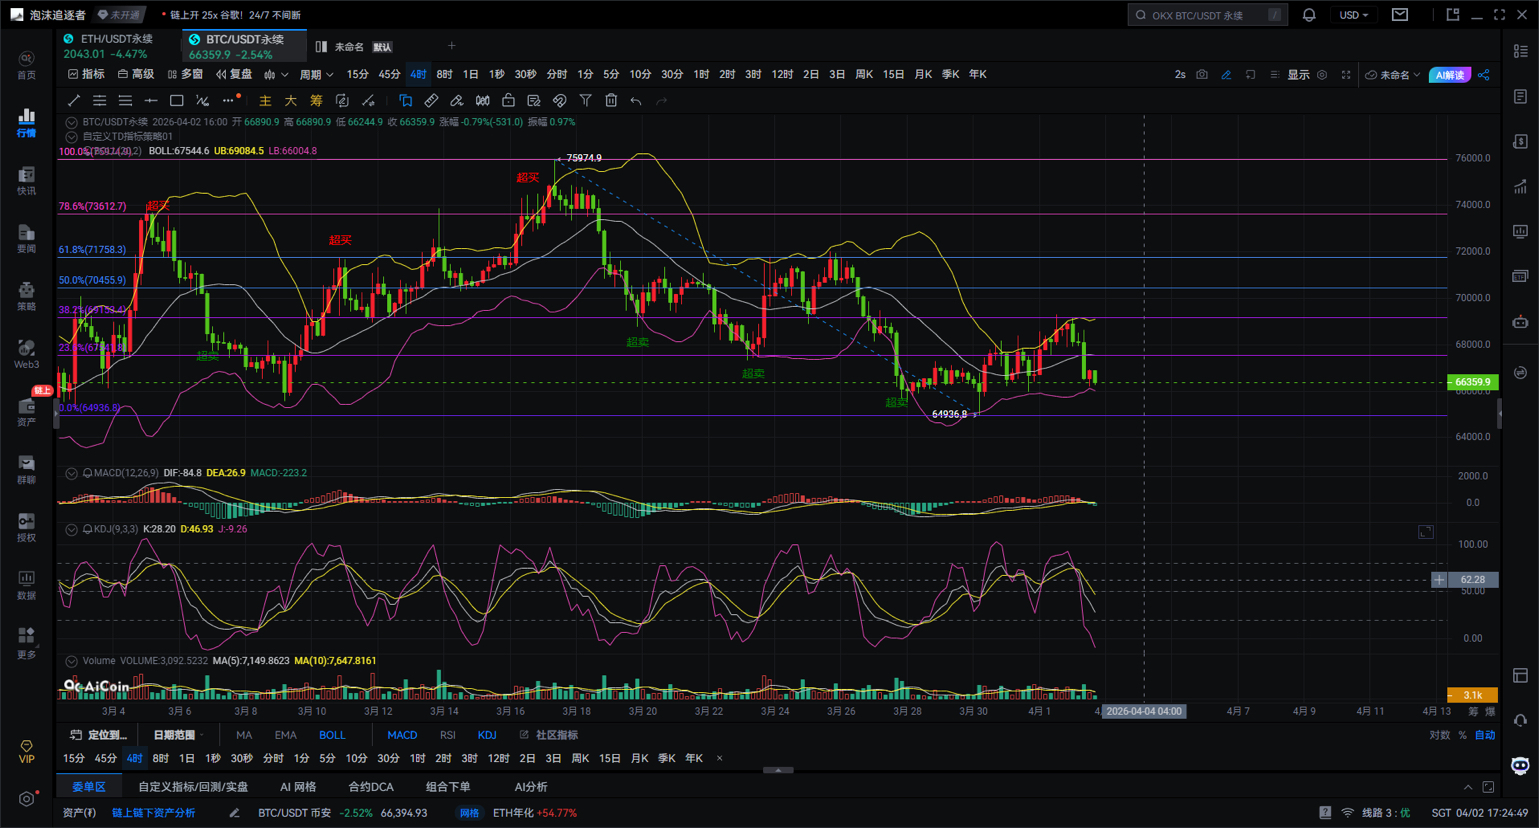
Let’s look at the specific analysis. First, using the Fibonacci retracement, I pulled the line from 75974-64936 for this pullback. The key positions are: 0.236 at 67541, 0.382 at 69173, 0.5 at 70455, 0.618 at 71758, and 0.786 at 73612. The current price is around 66359, just hovering near the support level at 0.236. Let me tell you directly: this is a short-term support. If it breaks down, we’ll have to look at the support below 64936. There is heavy resistance above during the rebound, mainly at positions 69173 and 70455, so it’s not easy to rush up.
Looking at the Bollinger Bands, the price is currently closely touching the lower band, the middle band is relatively flat and slightly downward, and the upper band pressure is very obvious. The conclusion is clear: there may be a short-term rebound, but the upper band pressure is high, making it unsuitable to chase highs.
On the MACD indicator, the DIF line has crossed down through the DEA line, forming a dead cross. The MACD green histogram is expanding, indicating that bearish strength is still present, and there has not been a reversal golden cross signal. My judgment is: the bearish rhythm has not changed, and the current rebound is merely an adjustment.
In terms of the KDJ indicator, both the K line and the D line are moving downwards, and the J value has dropped near the 0 axis. This indicates that the short-term trend is still leaning towards bearish, with insufficient momentum for a rebound, and the possibility of continuing to retest is quite high.
Everyone must remember the key operational positions. The support level is seen in the range of 64936-65500. The resistance levels are those Fibonacci positions: 67541, 69173, 70455. The short-term strategy can be summed up in one sentence: do not chase highs, patiently wait for the price to pull back to near the support level, and then see if there are opportunities for low absorption.
In summary, Bitcoin is currently in the stage of corrective rebound after a decline, but the strength of the rebound is relatively limited. I can summarize it for you in one sentence: it’s a sideways digestion combined with a slight rebound, the bearish trend is still present, and the true bullish strength has not yet emerged. First, the rebound has already encountered resistance levels, and the bearish trend remains. Second, absolutely do not chase highs or take risks. Third, near the support level, observe if there are any signals for low absorption, but it must be accompanied by volume.
Ethereum four-hour chart
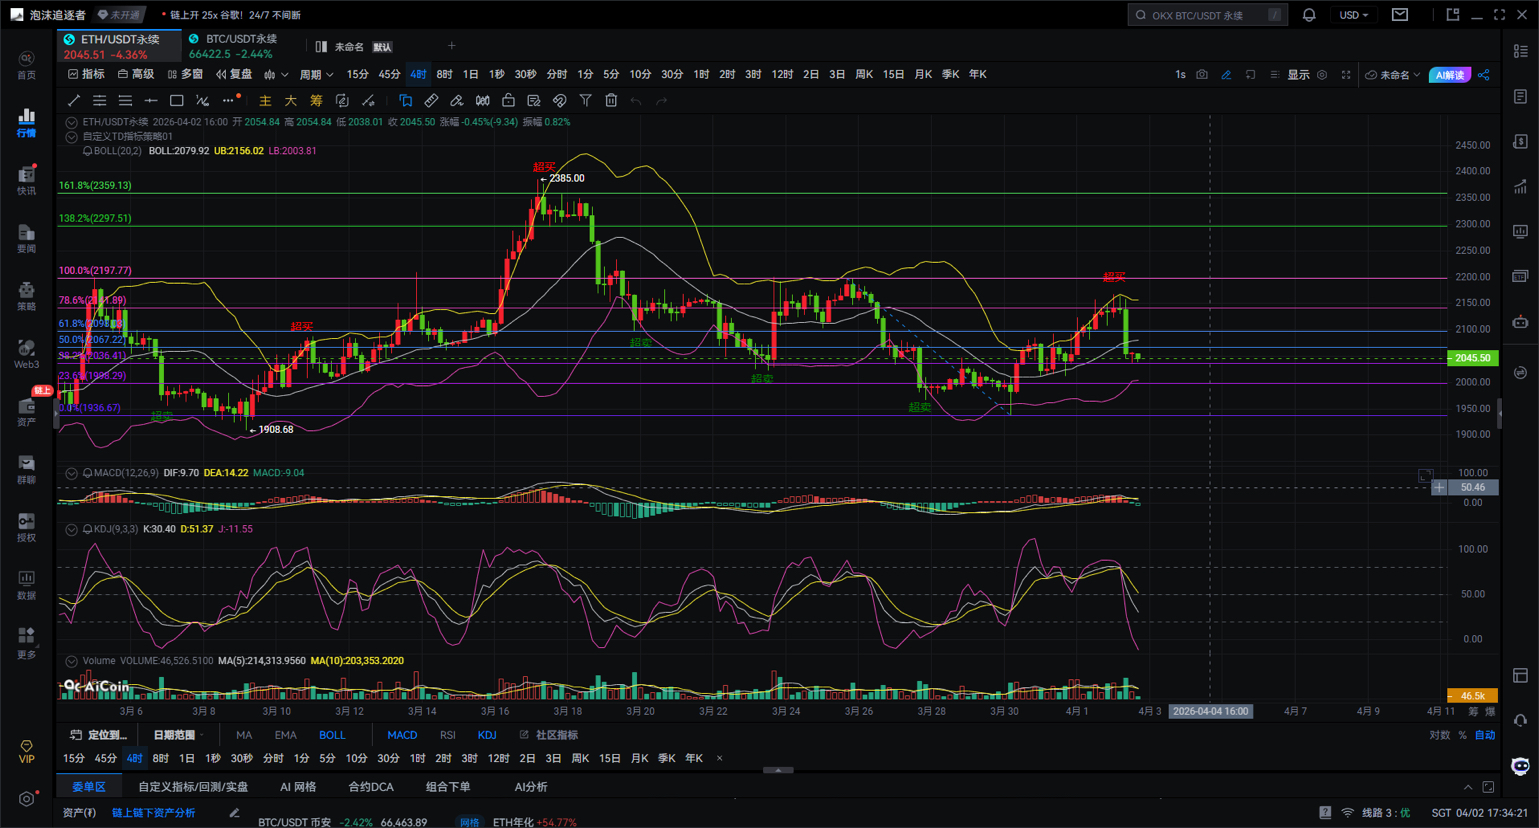
From the Fibonacci retracement lines drawn on the chart, several key numbers are: 2114, 2098, 2067, 2036, 1998, 1936. The current price is around 2045, having already broken below the 2067 support level at 0.5, and is now hovering near the 2036 support level at 0.382. Let me tell you directly, the 2036 position is a relatively strong support in the short term. If it can't hold here, the price is likely to continue downward, testing the area between 1998-1936, which is the true bottom area for the next phase.
Let’s take another look at the Bollinger Bands indicator. The price previously slid down quickly from the upper band and middle band area and is now below the middle band. The upper band exerts a clear pressure on the price, while there is still space below the lower band, indicating substantial pressure for a pullback adjustment. Therefore, the conclusion is that this rebound is basically over, and the next pullback is the main theme; it’s not suitable to chase after buying up.
The MACD indicator also confirms this judgment. The fast line DIF has crossed down through the slow line DEA, forming a dead cross, and the MACD histogram representing bearish energy is still expanding, indicating sufficient bearish strength. Currently, there are no signs of a bottom golden cross formation. Therefore, the bearish rhythm has not changed temporarily, and the pullback may continue for a while.
The KDJ indicator also shows a bearish short-term trend. After the K line and D line formed a dead cross, they moved downwards, and the J line has quickly dipped, indicating that the trend of short-term pullbacks is quite clear. The bulls temporarily cannot regain strength and cannot organize an effective counterattack.
Based on this analysis, let’s look at the key operational positions. The support levels below are 2036, then 1998, and further down is the earlier stage low at 1936. The resistance levels above, conversely, are 2067, 2098, and 2114. The short-term trading strategy can be summed up in one sentence: don’t rush to chase the rise, and don’t rush to chase the short. Patiently wait for the price to pull back to the range of 2036-1998 and see if there are signs of a rebound, or simply stabilize there before considering whether to look for low absorption opportunities.
In summary, Ethereum is currently in a short-term rebound after a wave of decline, which is nearly over, and is beginning to enter a sideways and retreating state. Simply put, the pressure for a short-term pullback is quite significant. We need to see it drop to key support levels and stabilize before there might be a relatively safe opportunity to enter. Three points: First, this rebound has encountered pressure, and the bearish trend remains. Second, when trading short-term, do not chase highs; focus on looking for pullbacks. Third, the key is patience. Wait for the market to reach key support levels and give confirmation signals, and ideally have volume to support it; only then should you act for a more secure outcome.
Lastly, let me remind you: market trends move step by step, not straight up or down. If you get anxious, your actions can easily become distorted, and you can easily be washed out in the fluctuations. In this market, many times, patience and grasping the rhythm are far more important than simply predicting rises and falls.
Instead of giving you a 100% accurate piece of advice, it’s better to provide you with a correct mindset and trend. Teaching someone to fish is better than giving them fish; the advice may earn a moment, but learning the mindset can earn a lifetime!
Drafting time: (2026-04-02, 17:25)
(Written by - Daxian says coin) This is to declare: there is a delay in online publishing, and the above suggestions are for reference only. Investment carries risks; enter the market with caution!#BTC行情 $BTC
