
The fear index is 15, with a range of extreme fear lasting for 46 days. Bitcoin is still at 70772, this scene is very absurd, yet it is the most real snapshot of the cryptocurrency market this morning. Last Friday, Bitcoin rebounded sharply from the panic low of 67400 to 71000, and today it is consolidating in a narrow range of 68970-71300. Ethereum is currently priced at 2610. In the last 24 hours, it has slightly increased by 1%, temporarily holding the support at 2100.
Today, the total market liquidation amount is estimated to be between 234 million within 24 hours, belonging to a dual explosion. About 87,000 people were liquidated. Compared to last week's dramatic fluctuations in liquidation scale -- on March 23, Trump's threat to blow up the Iranian power plant within 48 hours caused 170,000 people to be liquidated, totaling 330 million USD; on March 19, after the FOMC hawkish meeting, 135,000 people were liquidated for 452 million USD. Today, the market has obviously entered a breathing mode but has not yet escaped fear.
The reason why risk appetite has not yet rebounded is due to three macro factors simultaneously weighing down. Rising oil prices directly strengthen inflation expectations; the US-Iran tensions have entered the fourth week; although Trump's 48-hour threat has not materialized, the market has not completely ruled out the possibility of escalation; the Federal Reserve maintained its hawkish stance on interest rates at 3.5%-3.75% during last week's FOMC, and oil prices and geopolitical issues continue to drag down risk assets.
The next catalyst for the cryptocurrency market will be locked in on March 28 (Friday) with the release of the Fed's preferred inflation indicator PCE data. If the PCE exceeds expectations, the interest rate cut timeline will be delayed again, and at that time, Bitcoin's support and pressure test will be unavoidable.
Bitcoin 4-hour chart
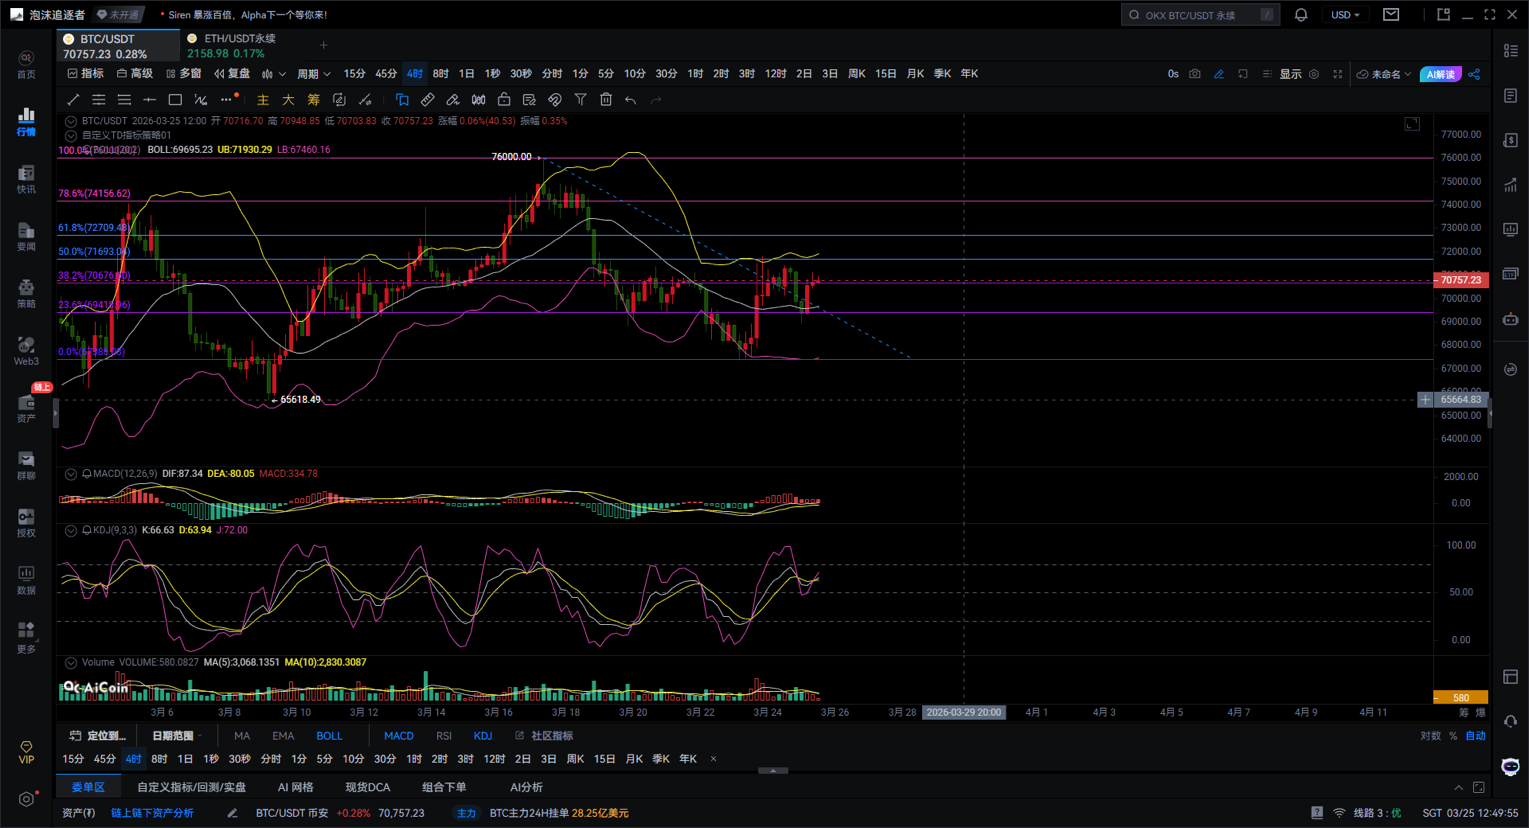
Bitcoin is currently in a oscillation pattern coexisting between rebound repair and upper pressure, with a weak short-term trend, but the mid-term structure has not yet deteriorated.
From the core structure at the four-hour level, there is a descending trend line forming resistance above, and prices show hesitation after rebounding near this trend line. This indicates that the bearish power has not dissipated; the current upward movement leans more toward a technical rebound of the bulls rather than a trend reversal.
Observing the Bollinger Bands indicator, where the bands have become the current key boundary reference. The upper band has begun to flatten out and has not further expanded, with prices oscillating around the middle band. In short, the Bollinger Bands are currently in a contracting state, indicating that the market is about to make a directional choice. If the price cannot stabilize around the middle band, the trend may lean toward bearish oscillation; if it can effectively stabilize around the middle band, then there will be space for further upward movement.
At the key Fibonacci levels, three key points need to be focused on: the 0.382 position (around 70600) is the core area of the current long-short game; the 0.5 position (around 71600) constitutes strong resistance; the 0.618 position (around 72700) can be seen as the watershed between long and short. Currently, the price is hovering around 0.382, indicating that this area is a tug-of-war zone between bulls and bears, not the starting point for a new round of market movement.
Looking at the MACD indicator, its histogram has turned from green to red, indicating a market rebound. However, the red bars have not continued to expand; instead, they have started to flatten out, while the DIF and DEA lines are sticking together. This directly indicates that the current rebound momentum is weakening, and the market does not have the conditions for accelerated upward movement.
In terms of short-term rhythm, the KDJ indicator has reached a mid-high range (around 60-70) and is showing signs of turning downward. This suggests that short-term prices are not low, and there is a certain technical demand for a pullback in the market.
Comprehensive analysis indicates that the most likely scenario currently is a weak oscillation, repeatedly oscillating within the 70000-71600 range to grind the bottom, during which there may be false breakouts followed by pullbacks. The corresponding operational idea can adopt a high short and low long strategy, but it leans more toward high shorts. If the market chooses to break upward, it must meet three conditions: a volume breakout above 71600, stabilizing above the 0.5 Fibonacci level, and the MACD red bars expanding again; only then can the target look at 72700 or even higher. Otherwise, any upward movements may only be false breakouts. Another scenario to be wary of is a downward break; if the price falls below 70000 and the middle band of the Bollinger Bands, while the MACD green bars expand again, the market may further drop to 69000 or even the previous low around 67000.
Key advice: the current price level is not a position to chase up, but rather a waiting observation point for clear directional indicators. If planning to go long, patiently wait for the price to pull back to the 69000-70000 range and show clear signs of bottoming out before entering. If considering to short, wait for the price to rebound to the 71000-71600 area, and look for signs of weakness in the K-line when it encounters resistance before laying out a strategy.
For Ethereum, shorting can be done around 2200, with a stop loss set at 2246.
Giving you a 100% accurate suggestion is not as good as providing you with a correct mindset and trend; teaching someone to fish is better than giving them fish. It's suggested to earn for a moment, but learning the mindset will allow you to earn for a lifetime!
Drafting time: (2026-03-25, 12:50)
(Written by - Master Daxian) It is hereby stated: Online publications have delays, and the above suggestions are for reference only. Investment carries risks, and one must be cautious when entering the market!#特朗普称对伊战争已胜利 $BTC
