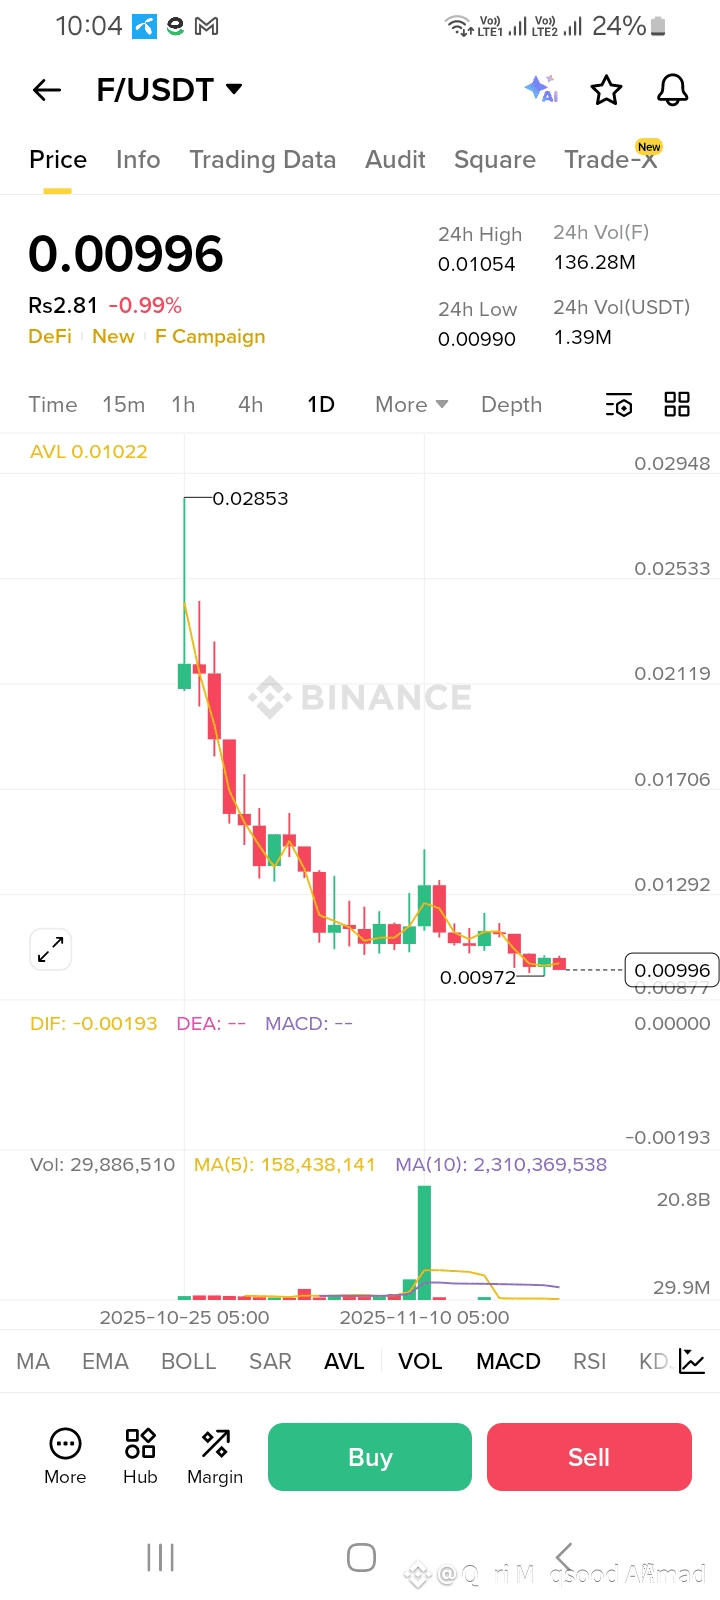
The chart is showing early signs of a potential bullish reversal following a controlled pullback into a strong support zone. Price is attempting to reclaim the mid-Bollinger Band, signaling weakening bearish momentum. EMA lines are beginning to level out, hinting at a shift in trend, while the MACD is curling upward—often an early indicator of a bullish phase. Increasing volume near the lows suggests accumulation, adding confidence to a possible breakout.
LONG ENTRY
Enter after a confirmed breakout above the nearest short-term resistance zone.
TAKE PROFIT TARGETS
TP1: Initial resistance level
TP2: Mid-range supply area
TP3: Higher swing resistance
STOP LOSS
Set SL below the latest structural support for proper downside protection.
RISK MANAGEMENT
Risk only 1–2% per position, maintain a consistent SL, and avoid overleveraging.
#TechnicalAnalysis #FUSDT #BullishSetup #CryptoCharts #MarketPullback