♨️Chart patterns are shapes formed by price movements that help traders anticipate future market trends.
These patterns fall into two main categories:
Reversal patterns, which signal that a current trend may change direction
Continuation patterns, which suggest the trend will likely resume after a brief pause.
They stem from market psychology, where emotions like fear, greed and uncertainty drive collective trading behavior and create recognizable shapes on charts.
Here are five common patterns every crypto investor, including beginners, should know:
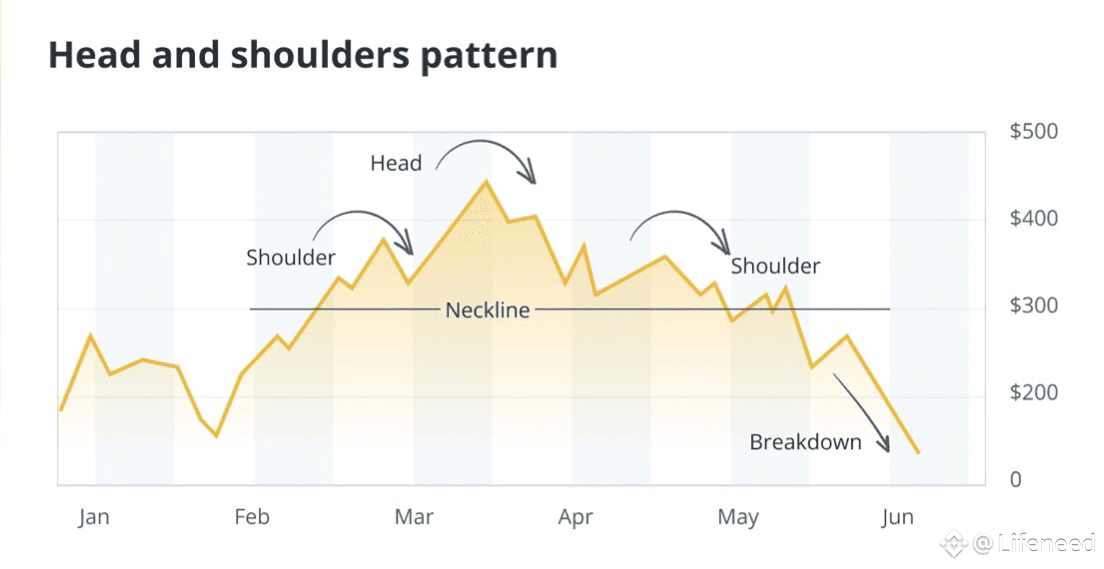
1. Head and shoulders:
The head-and-shoulders pattern features three peaks, with a higher middle peak (the head) between two smaller ones (the shoulders), all connected by a "neckline." The inverse version indicates a potential bullish reversal.
How to read:
A decline in volume on the right shoulder signals weakening momentum. A price break below the neckline confirms a bearish reversal, while a break above it confirms a bullish inverse. Measure the distance from the head to the neckline, then project that distance from the breakout point to estimate the target move.
• Stop-loss: Place it above the right shoulder for bearish setups or below it for bullish ones.
Example: This pattern often appears during altcoin corrections after major hype cycles, such as following a token's listing on a major exchange like Binance. In early 2025, Cardano (ADA $0.67) formed a head-and-shoulders pattern during a correction phase after its governance upgrade buzz, signaling a temporary bearish move.
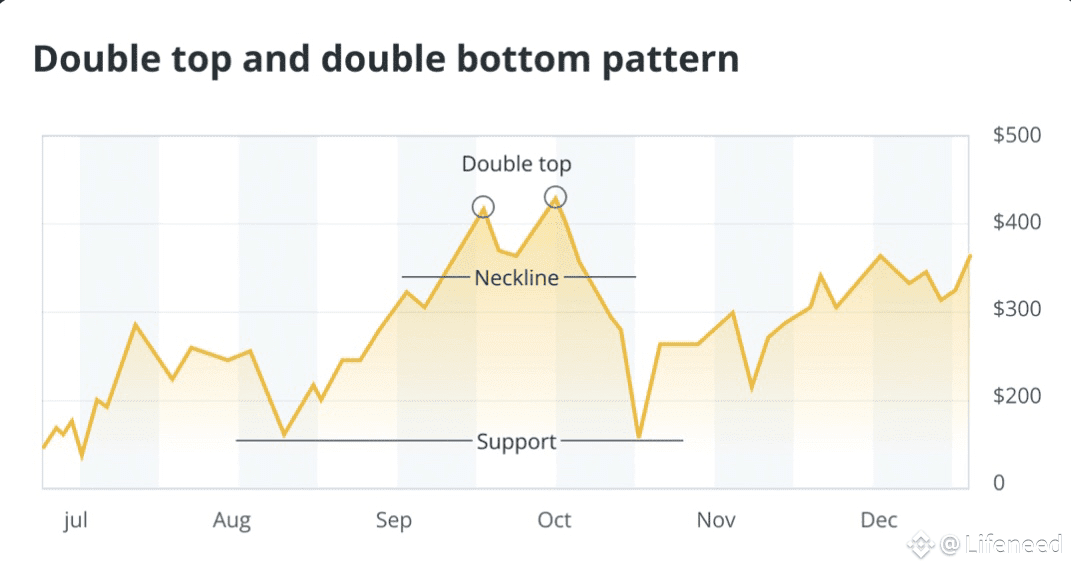
2. Double top and double bottom:
Double tops form an "M" shape near resistance, signaling a potential bearish reversal. Double bottoms form a "W" shape near support, signaling a potential bullish reversal.
How to read:
These patterns show two failed attempts to break resistance (top) or support (bottom). Confirmation occurs when the price crosses the neckline: bearish for double tops and bullish for double bottoms. Measure the height from the neckline to the peaks or troughs, then project it from the breakout point to estimate the move.
• Stop-loss: Place it above the top peaks or below the bottom troughs.
• Example: This pattern often appears in memecoin pump-and-dumps. For instance, Dogecoin (DOGE $0.20) formed a double top in mid-2025 after a social media-driven surge, followed by a sharp correction.
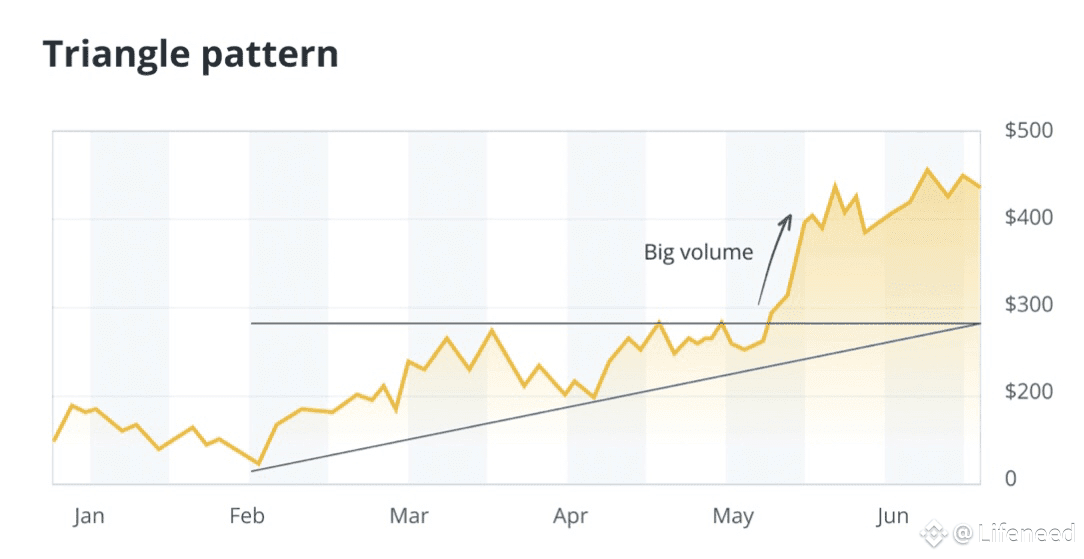
3. Triangle:
Triangle patterns form when price movements create converging trendlines, resulting in a triangular shape. The three main types are ascending (bullish), descending (bearish) and symmetrical (neutral).
How to read:
Breakouts often follow the existing trend but can occasionally reverse it. Estimate the price target by measuring the base width of the triangle and projecting it from the breakout point. A breakout upward in an uptrend is typically bullish, while a breakdown in a downtrend is bearish. To avoid false signals, use a 1%-2% filter before confirming a move.
• Stop-loss: Place it below the triangle for bullish setups or above it for bearish ones.
• Example: During periods of market uncertainty, asset charts often display triangle formations. In early 2025, Ether's (ETH $3989.00) price action formed a symmetrical triangle amid uncertainty surrounding decentralized finance (DeFi) regulations. The price later broke out bullishly as regulatory clarity improved.
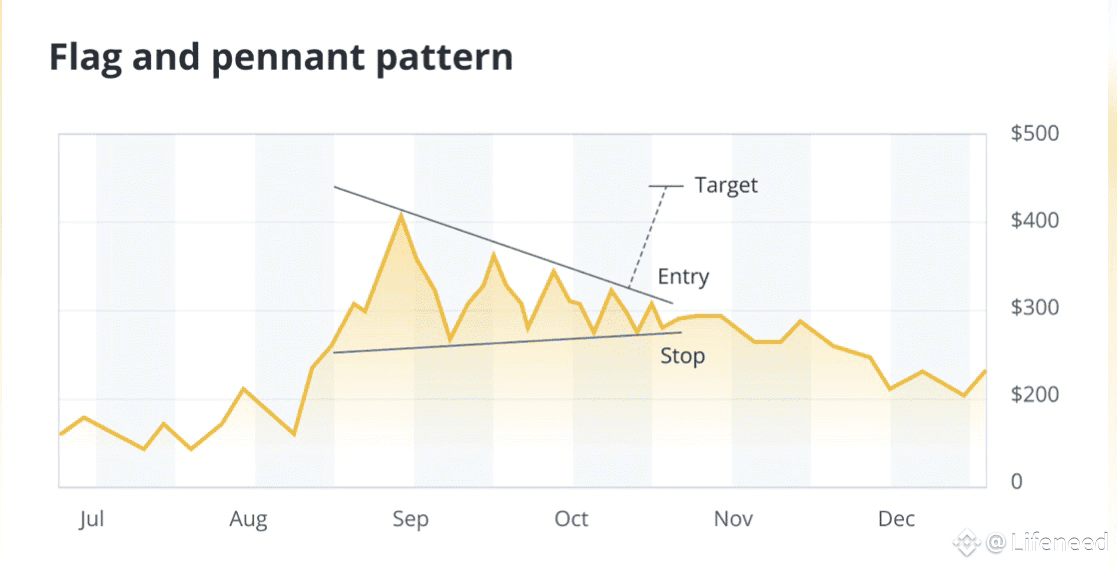
4. Flag and pennant:
Flag and pennant patterns form after sharp price moves. Flags appear as small, parallel channels, while pennants look like compact triangles. Both signal brief pauses before the prevailing trend continues.
How to read:
A steep "pole" followed by a short consolidation suggests that the trend is likely to resume. These patterns are bullish in uptrends and bearish in downtrends.
Traders often enter on a pullback within the flag or pennant to improve risk-reward.
• Stop-loss: Place it below the flag or pennant's low for bullish setups, or above the high for bearish ones.
• Example: During bullish market phases, tokens often display flag or pennant formations. In 2025, Solana's (SOL $194.57) price action formed a bullish flag pattern amid rapid ecosystem growth, including new DeFi protocol launches. This setup signaled the continuation of its upward trend.
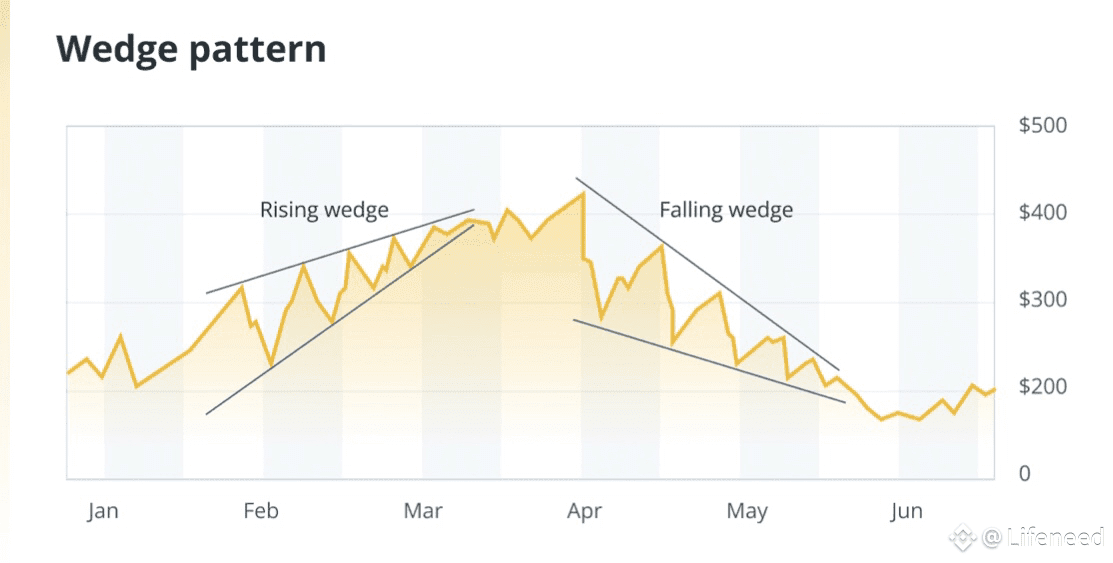
5. Wedge:
Wedge patterns form when price action creates converging trendlines that slope either upward (rising wedge, typically bearish) or downward (falling wedge, typically bullish).
How to read:
A rising wedge in an uptrend often signals a potential reversal as momentum weakens, while a falling wedge in a downtrend points to a possible bullish reversal. These patterns can also act as continuation signals when aligned with the prevailing trend. Measure the wedge's height and project it from the breakout point to estimate the target move.
• Stop-loss: Place it outside the wedge's opposite trendline.
• Example: Wedge patterns can help identify potential market tops during overheated conditions. In 2025, during a period of heightened speculation, Arbitrum's (ARB) price action formed a rising wedge pattern, which was later followed by a market correction.
Follow for more updates.


