

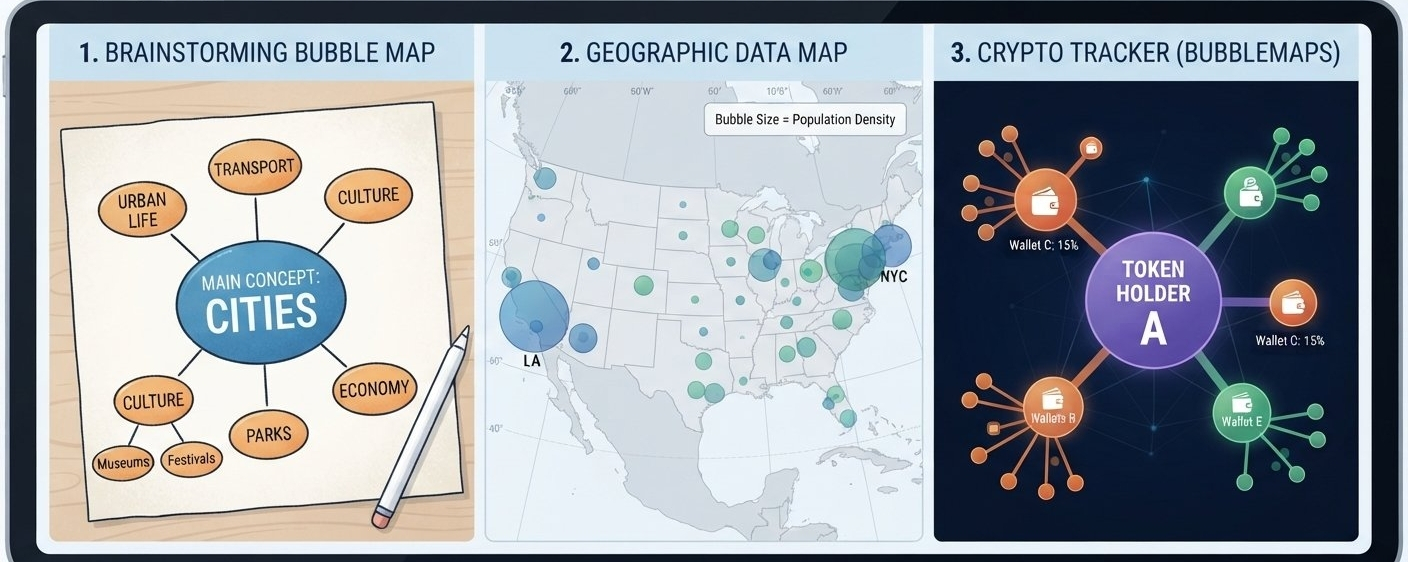

tool that maps out connections using circles and lines. Depending on what you are working on, it usually means one of three things:
1. A Brainstorming Tool
If you are planning an essay or trying to map out a messy idea, this is the classic bubble map. You put your main idea in a central circle, and then draw lines out to smaller bubbles containing adjectives, traits, or sub-topics. It is essentially a mind map that helps you break down a big concept into bite-sized details.
2. A Data Map
If you are looking at a literal map of the world or a specific country, a bubble map is used to show data visually. Instead of just shading in a state or country, data analysts drop bubbles over specific locations. The bigger the bubble, the higher the number—like showing where a company gets the most sales or which cities have the highest populations.
3. A Crypto Tracker
In the cryptocurrency world, Bubblemaps is a popular piece of software used to investigate blockchain data. Each bubble represents a digital wallet, and the size shows how many tokens that wallet holds. If two wallets send crypto back and forth, the map links them together. It is a clever way for investors to spot insider trading or see if a few people secretly control a whole token supply.#BTC🔥🔥🔥🔥🔥