$SOL
📊 SOL DAILY TECHNICAL ANALYSIS
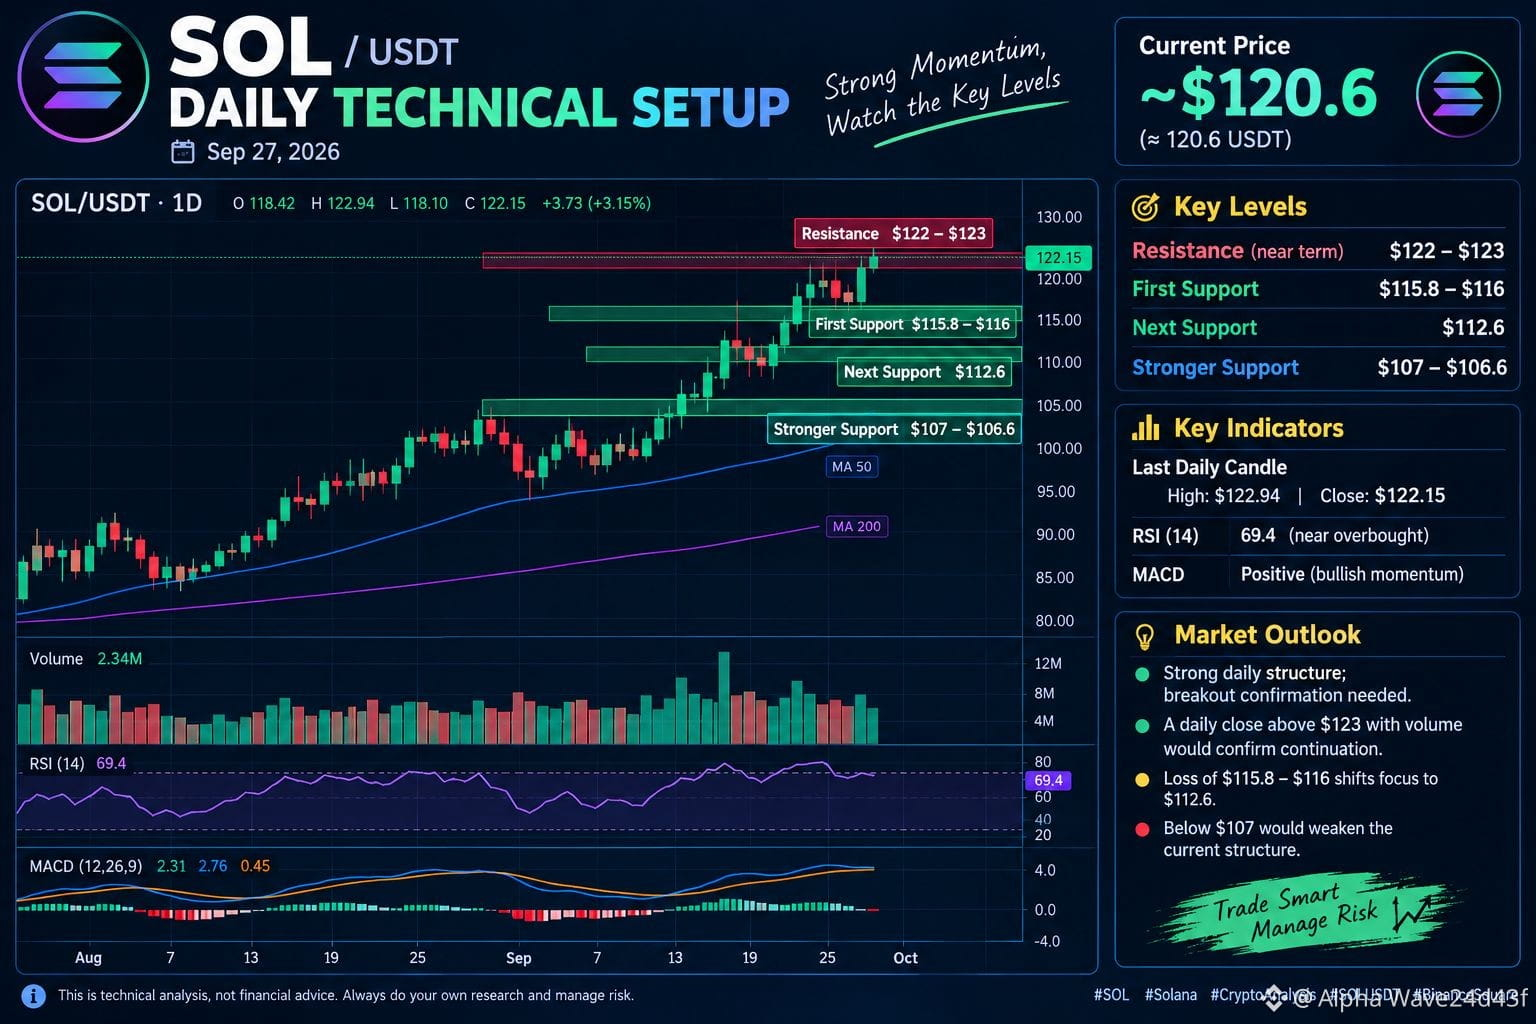
Solana is holding near the $120–$121 zone after a strong upward move. Price is now testing an important resistance area around $122–$123, so the next daily close could be important.
🔹 Resistance: $122–$123
🔹 First Support: $115.8–$116
🔹 Next Support: $112.6
🔹 Stronger Support: $107–$106.6
📈 Momentum Check:
The daily structure remains constructive, with SOL trading above its major moving-average levels. RSI is around 69, showing strong momentum but also that price is getting close to the traditional overbought area. MACD remains positive.
🟢 Bullish Scenario:
A strong daily candle close above $123 with good volume would provide confirmation that buyers are pushing through the current resistance.
🟡 Pullback Scenario:
If SOL gets rejected around $122–$123, watch $115.8–$116 first. Holding this zone would keep the current structure intact.
🔴 Risk Level:
A clear move below $112.6 would weaken the short-term setup and shift attention toward the $107–$106.6 area.
⚠️ Key Point:
SOL has strong momentum, but price is also near resistance. Wait for candle + volume confirmation rather than chasing a breakout.
#sol
#SolanaUSTD
#CryptoAnalysis
📊 SOL DAILY TECHNICAL ANALYSIS
Solana is holding near the $120–$121 zone after a strong upward move. Price is now testing an important resistance area around $122–$123, so the next daily close could be important.
🔹 Resistance: $122–$123
🔹 First Support: $115.8–$116
🔹 Next Support: $112.6
🔹 Stronger Support: $107–$106.6
📈 Momentum Check:
The daily structure remains constructive, with SOL trading above its major moving-average levels. RSI is around 69, showing strong momentum but also that price is getting close to the traditional overbought area. MACD remains positive.
🟢 Bullish Scenario:
A strong daily candle close above $123 with good volume would provide confirmation that buyers are pushing through the current resistance.
🟡 Pullback Scenario:
If SOL gets rejected around $122–$123, watch $115.8–$116 first. Holding this zone would keep the current structure intact.
🔴 Risk Level:
A clear move below $112.6 would weaken the short-term setup and shift attention toward the $107–$106.6 area.
⚠️ Key Point:
SOL has strong momentum, but price is also near resistance. Wait for candle + volume confirmation rather than chasing a breakout.
#sol
#SolanaUSTD
#CryptoAnalysis