ACE long setup: the levels I'm watching
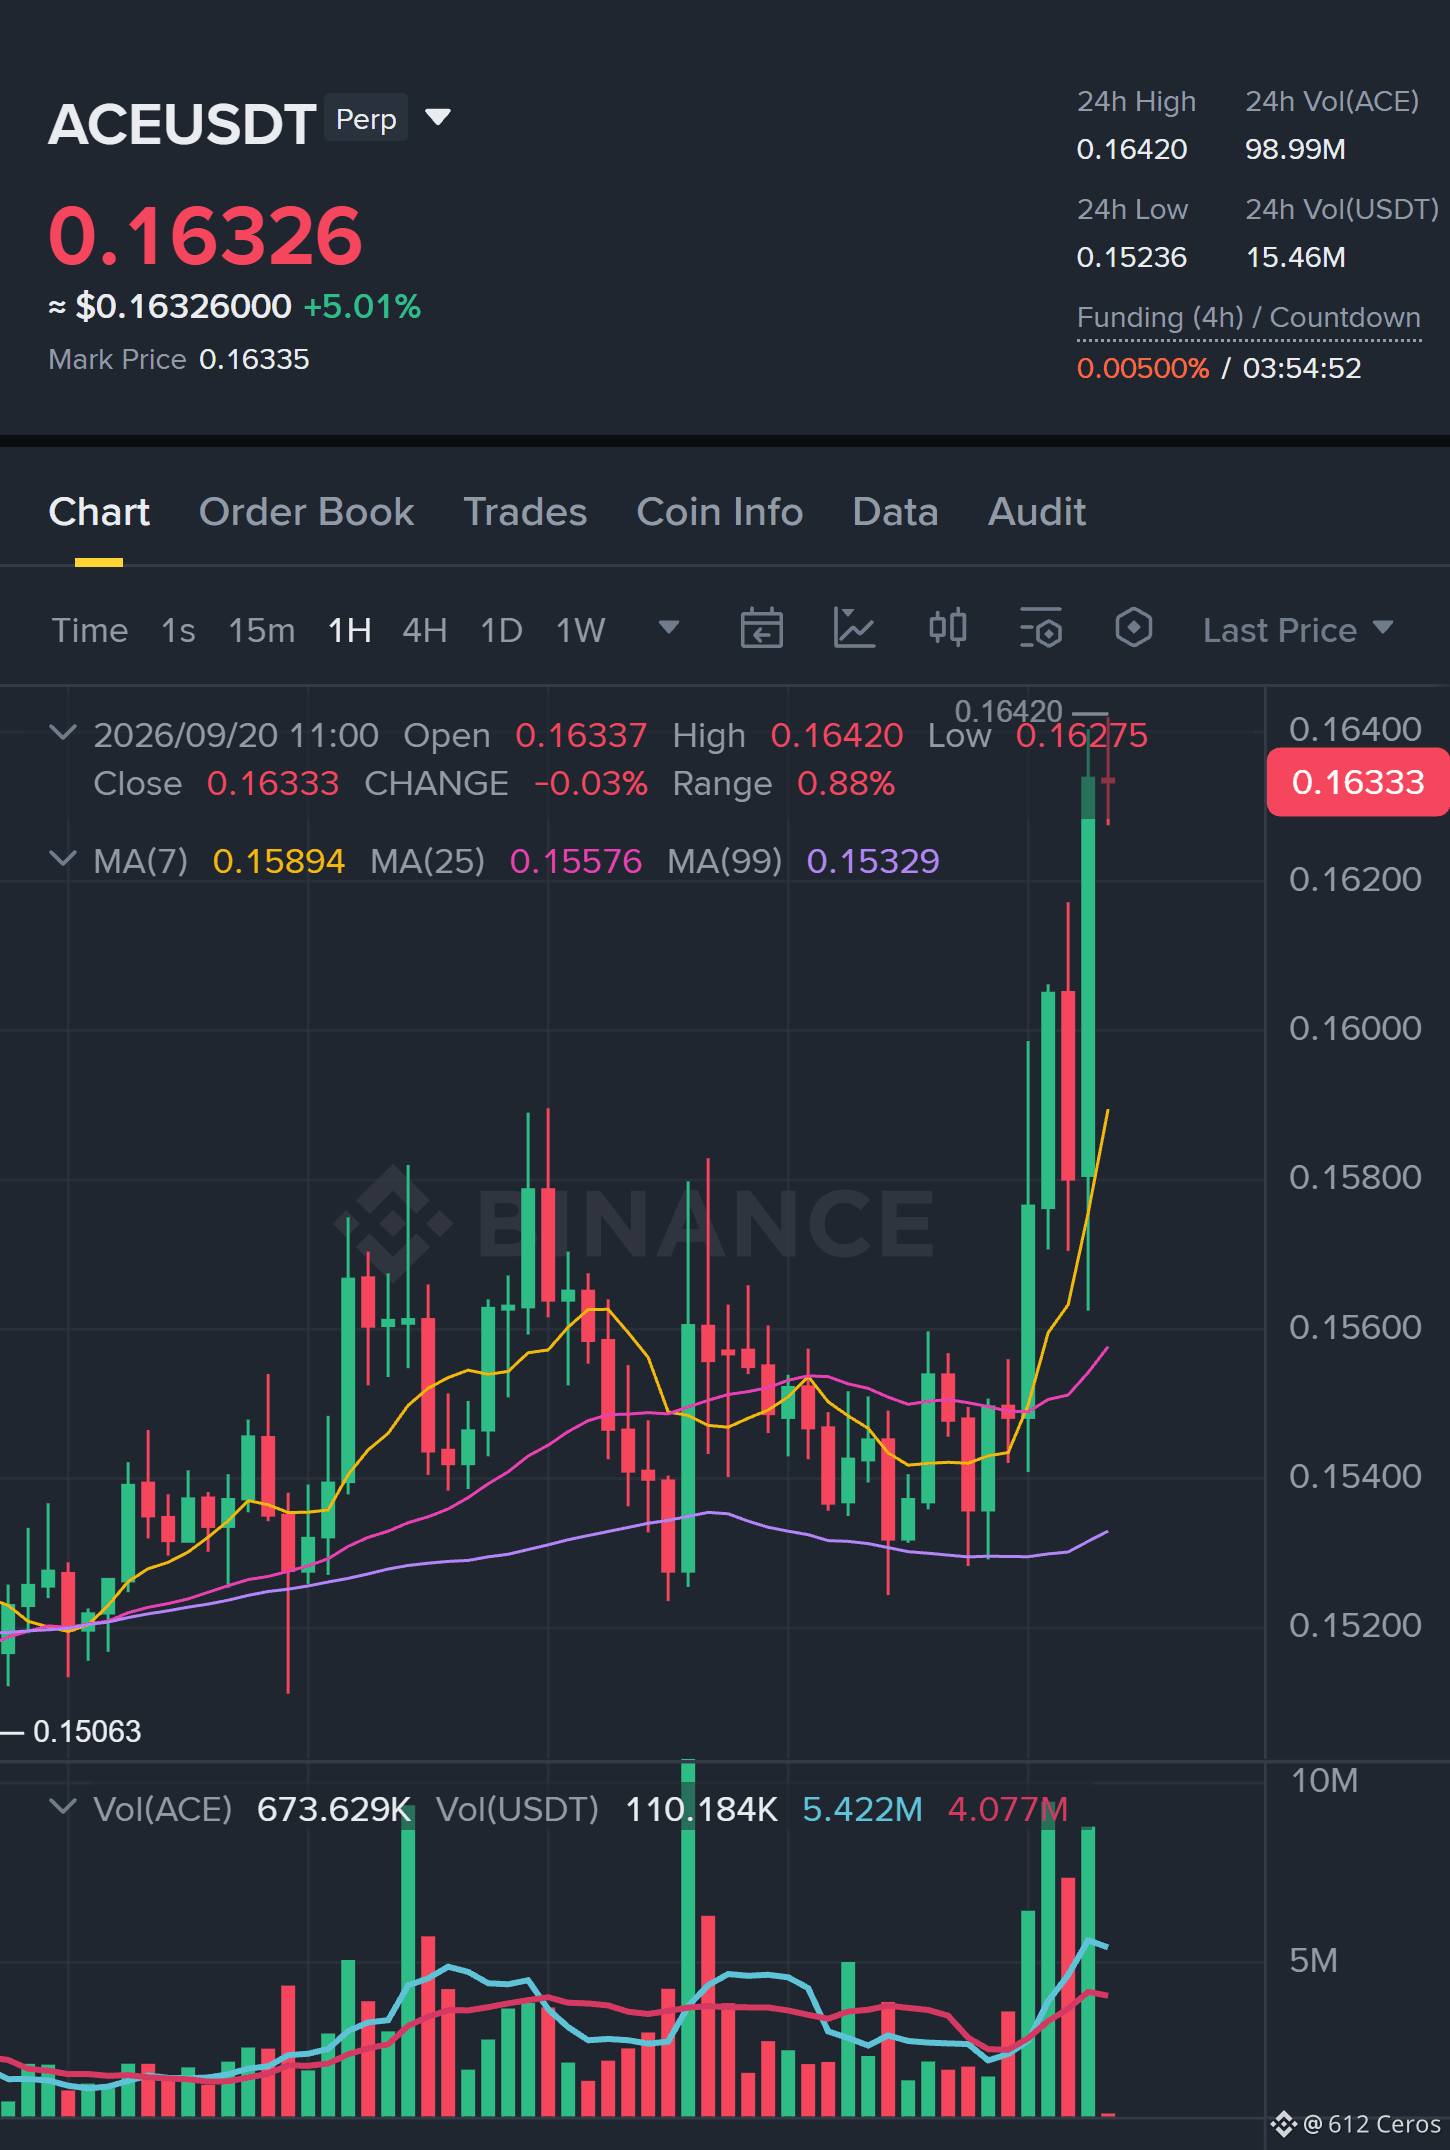
🟢 $ACE /USDT | Bias: LONG (Strong) | 6/12 signals aligned
Technical verdict: STRONG LONG. 6 of 12 signals aligned, 1 against.
What supports it (6):
• Daily trend: price > EMA50 > EMA200, bullish stack
• Trend strength (ADX/DI, 15m): ADX 32.2 with buyers in control (DI+ 33.9 vs DI− 13.6)
• 4h RSI: 63.4, bullish momentum (above 55)
• 1h RSI: 69.1, bullish momentum (above 55)
• Short-term momentum (15m): RSI z-score +1.61, last candle +0.80%, buyers pressing
• Relative strength vs BTC: outperforming, +6.31% vs BTC over the last day
What argues against (1):
• Distance from 1h EMA50: +3.2 ATR from the 1h EMA50, overextended with pullback risk
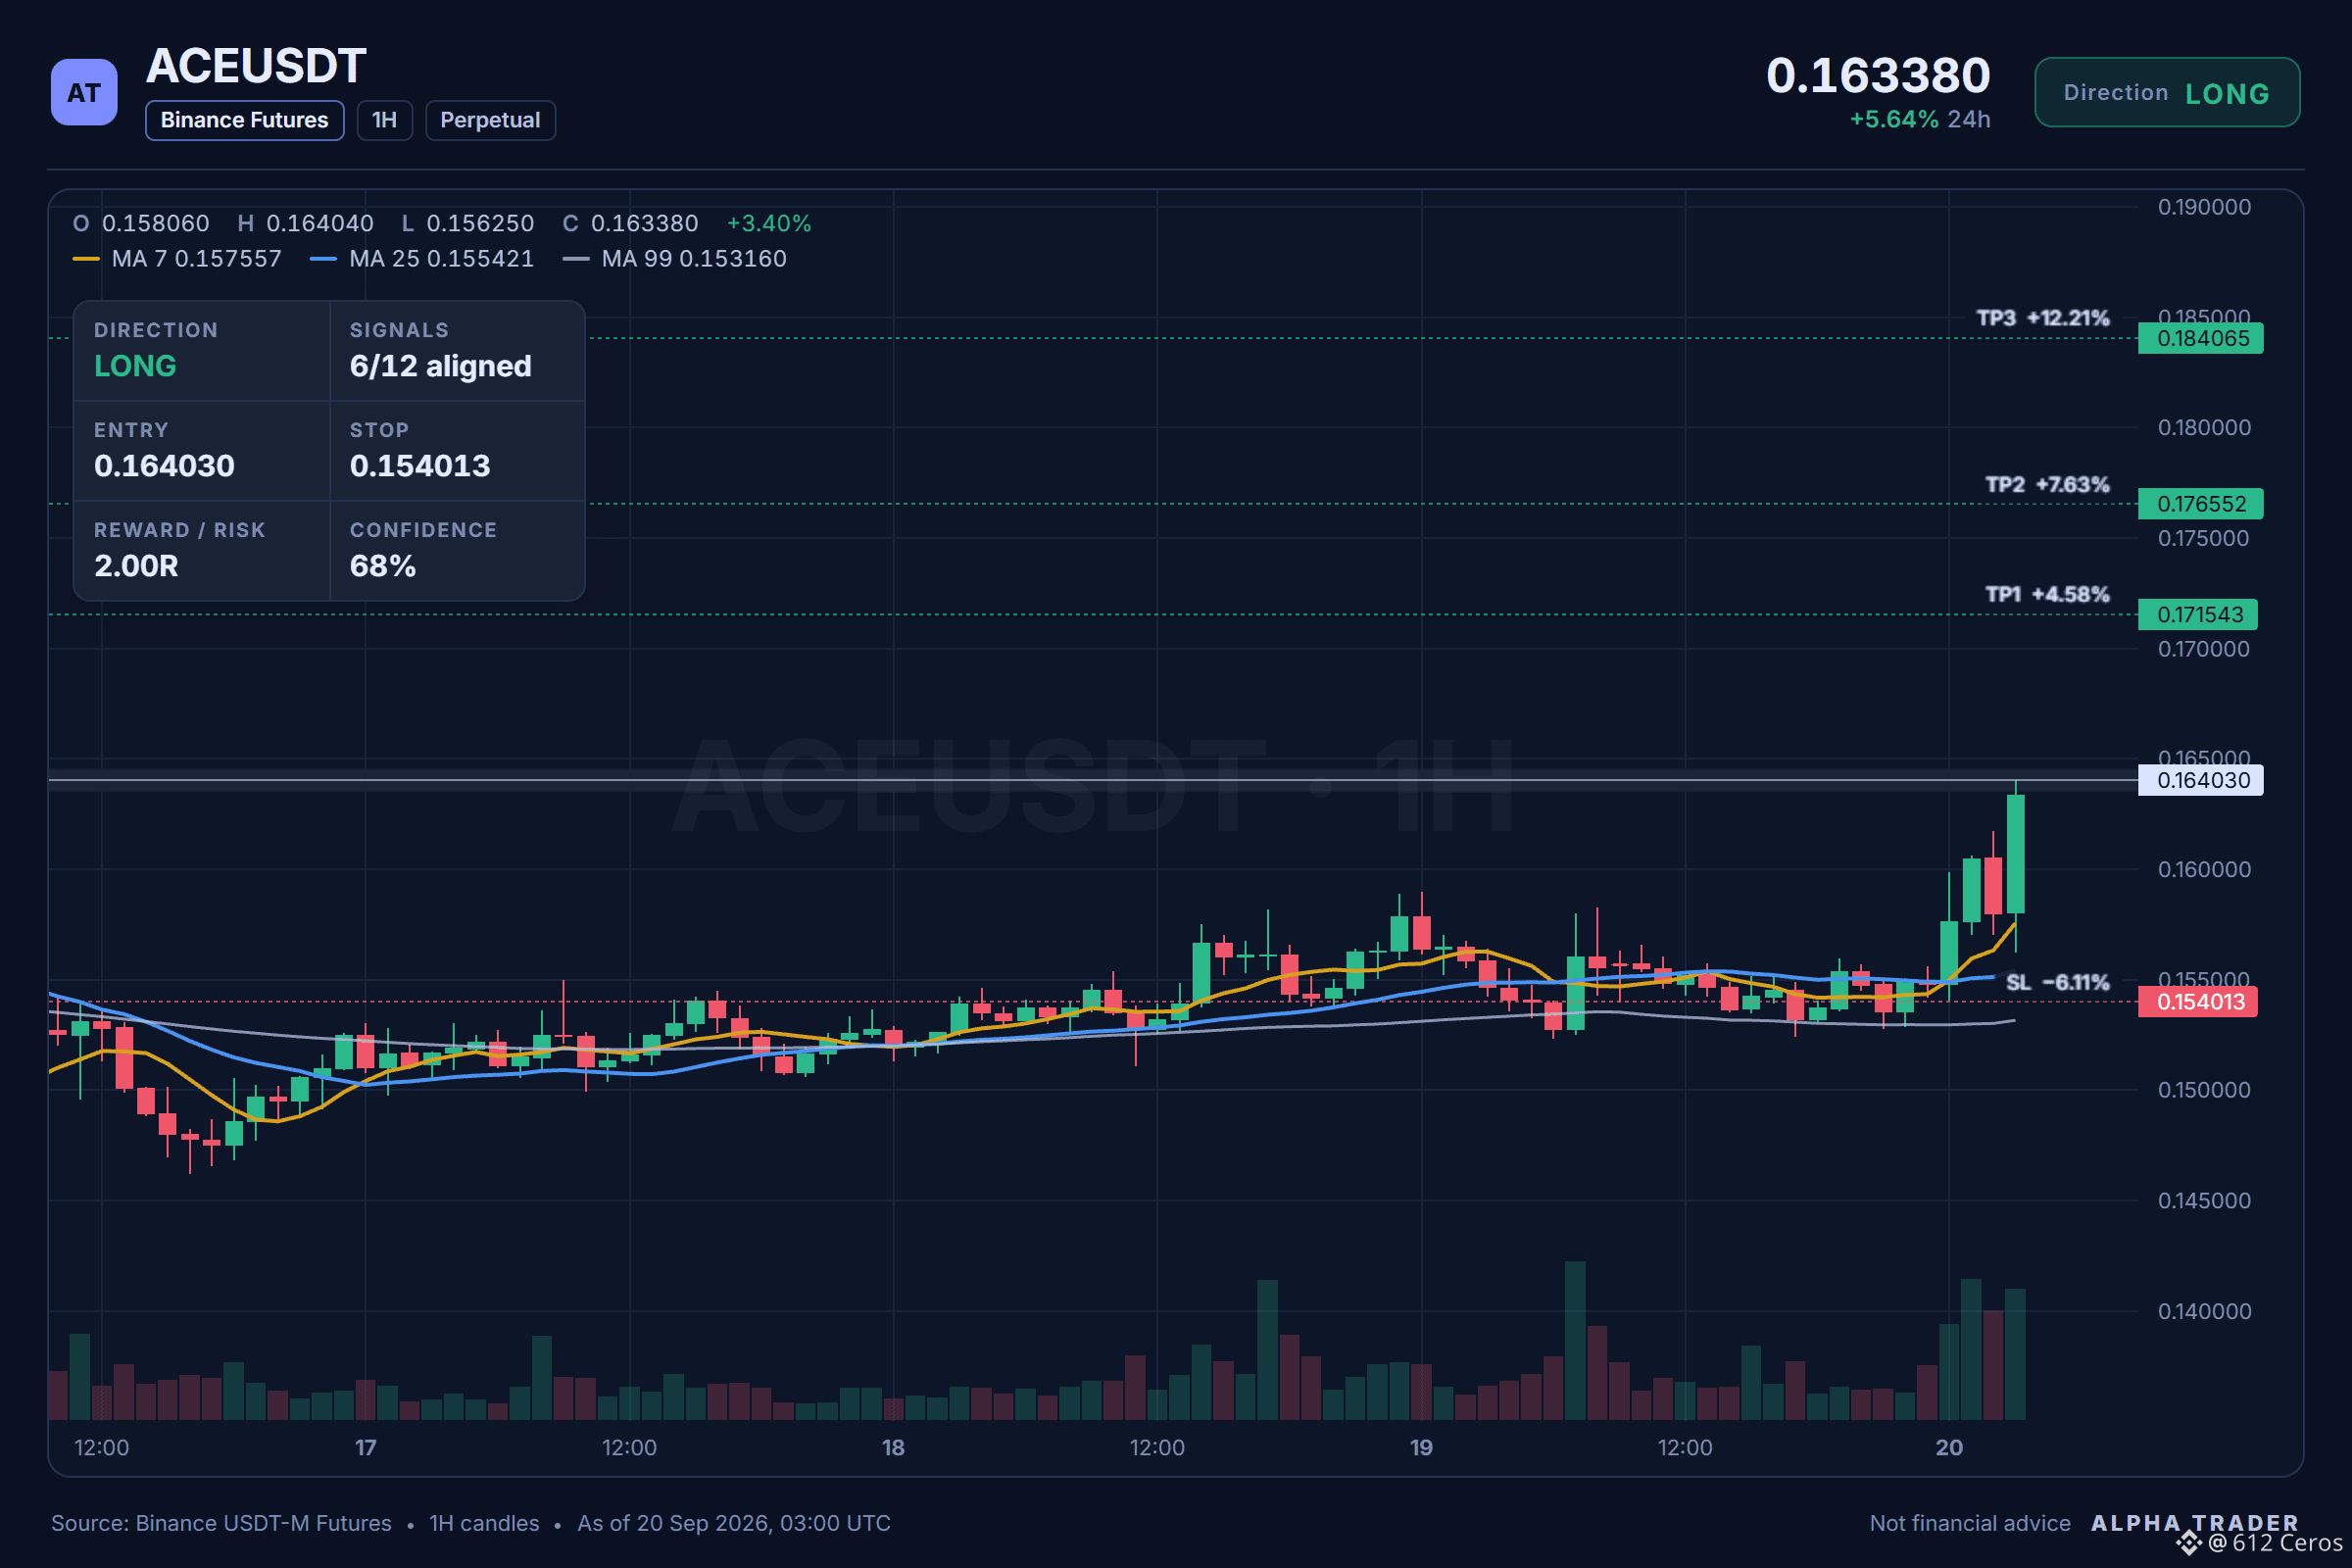
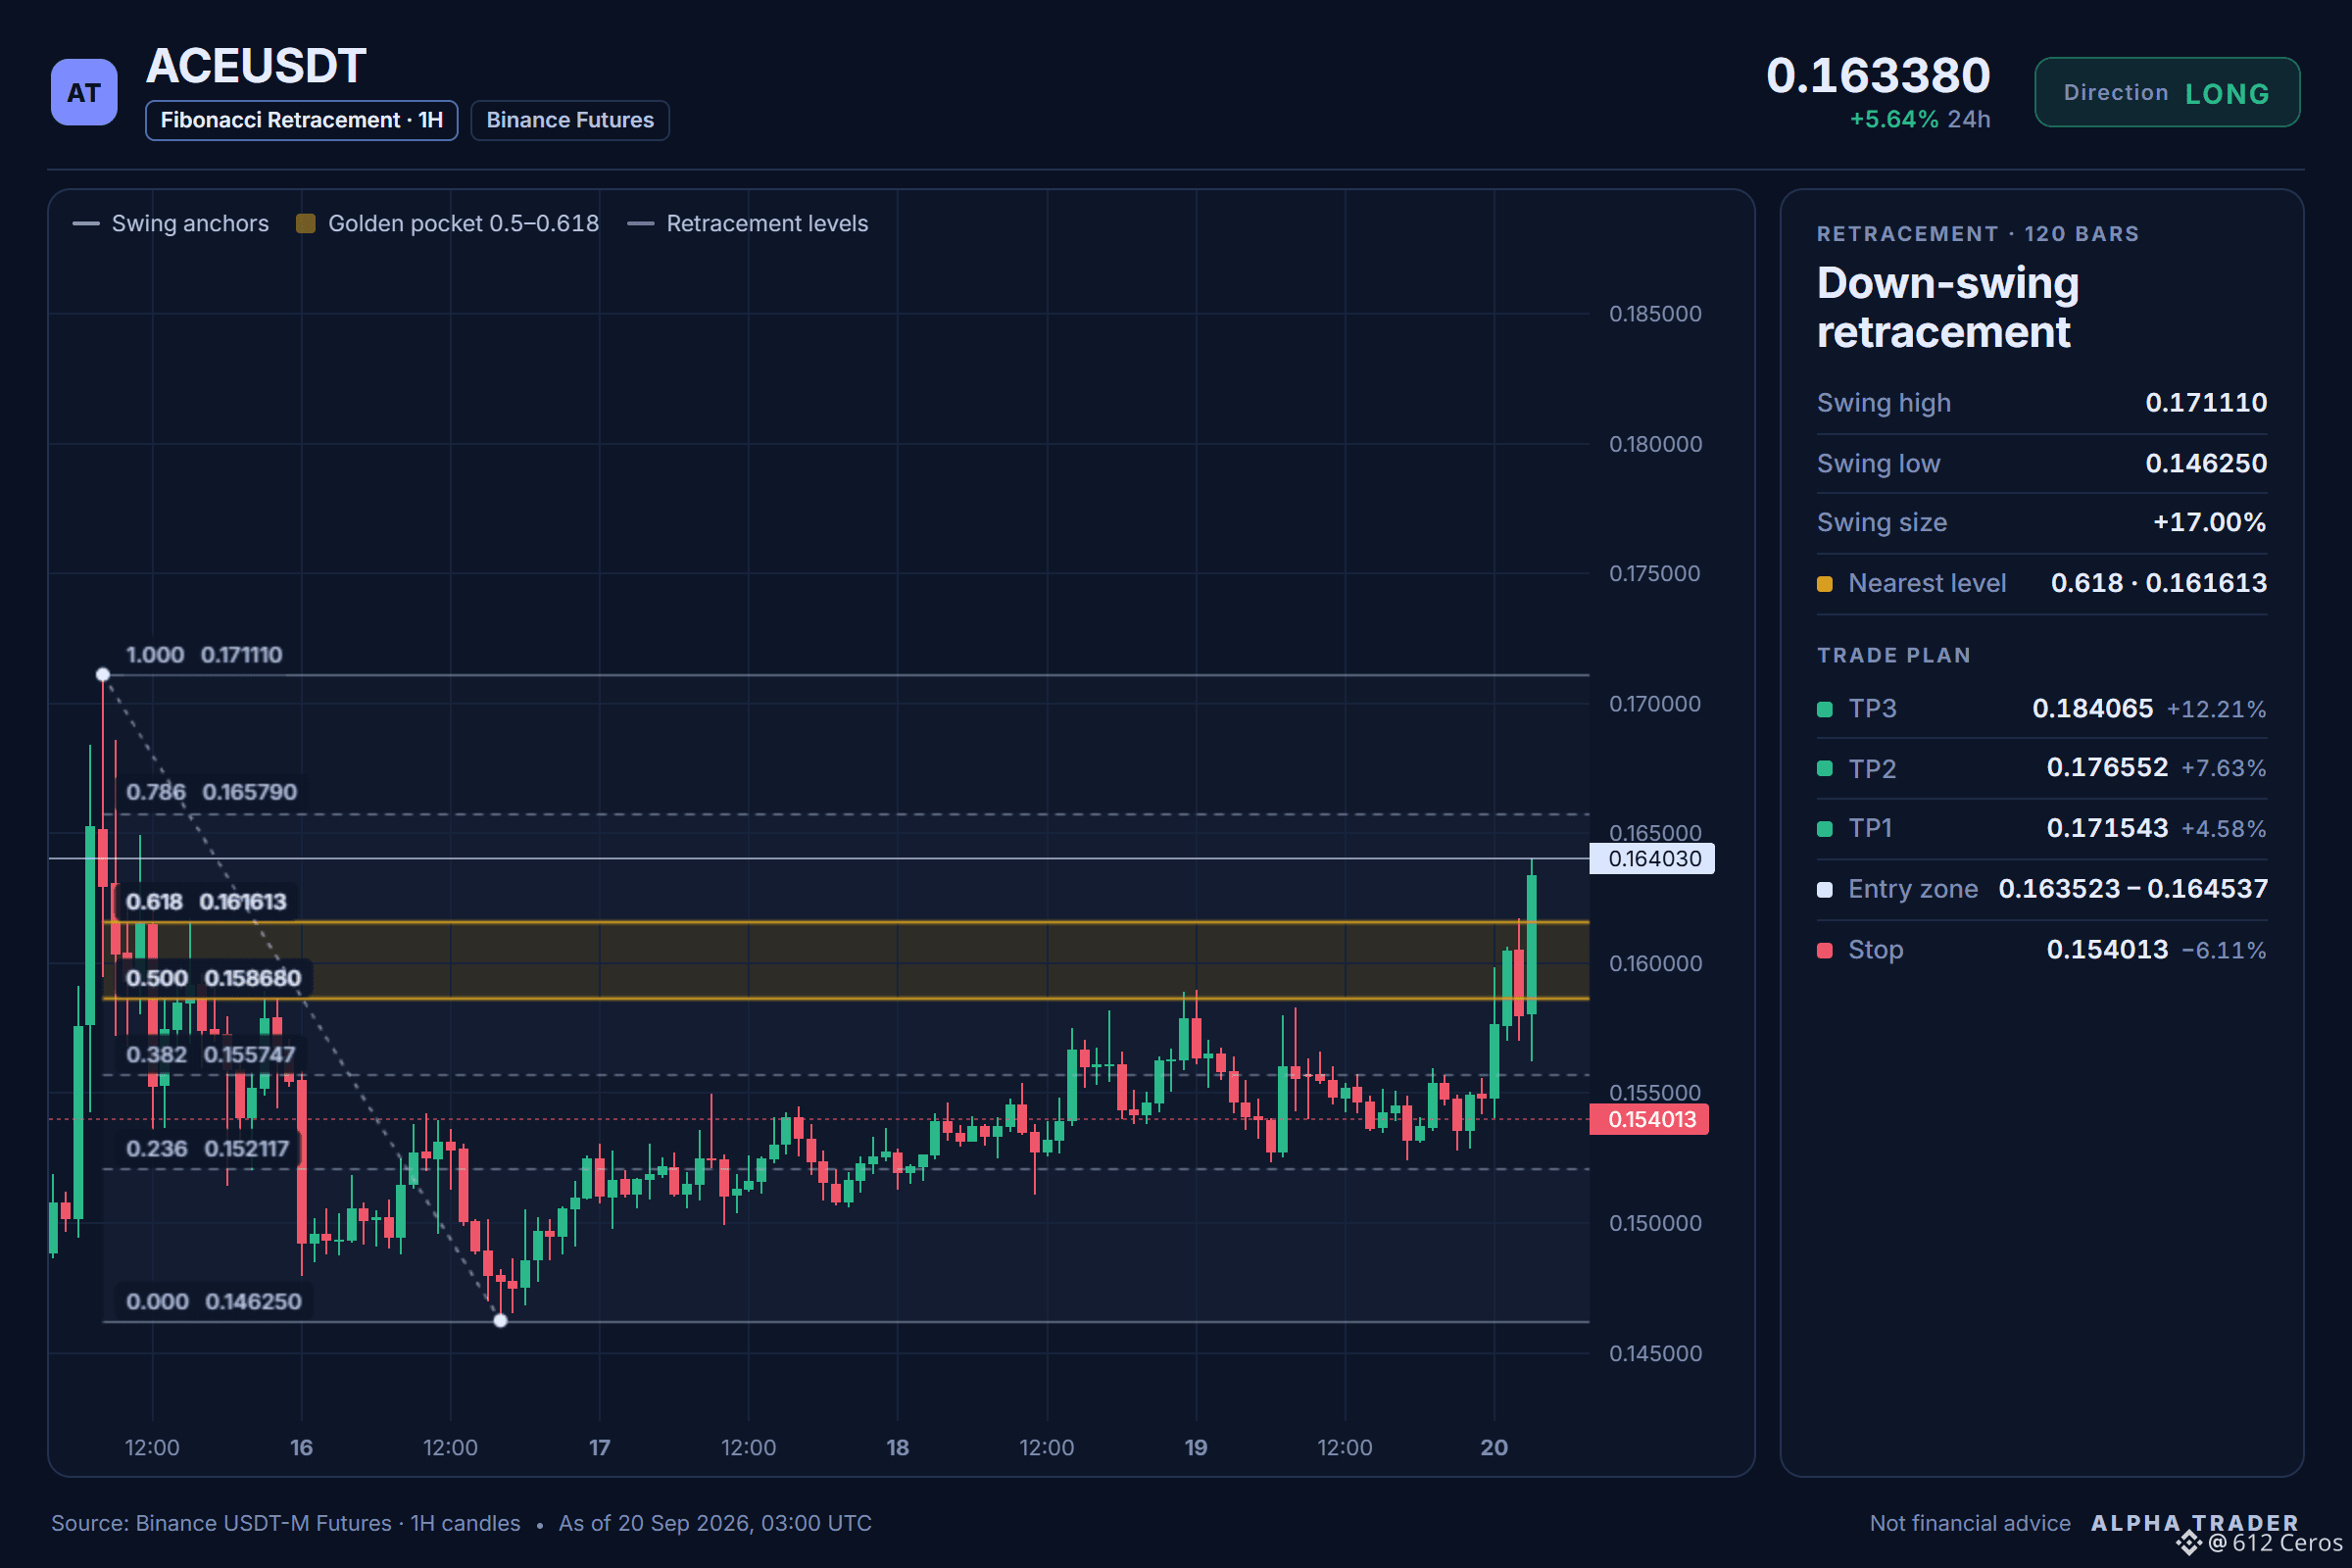
📍 Entry: 0.163523 – 0.164537
🎯 TP1: 0.171543 | TP2: 0.176552 | TP3: 0.184065
🛑 SL: 0.154013
The reasoning:
The daily trend reads bullish, and 6/12 signals aligned favour the long side. The plan is to work the 0.163523 – 0.164537 zone, scale out at 0.171543 and 0.176552, and stay patient for 0.184065. A move through 0.154013 means the idea is wrong and the stop does its job.
💬 Does ACE tag 0.171543 first, or the stop?
Levels mapped on the chart below 👇
⚠️ Personal market analysis only. NFA — manage risk and DYOR.
Educational content, not investment advice or a recommendation to buy, sell, deposit, or withdraw any asset. No paid promotion or referral/affiliate links.
🟢 $ACE /USDT | Bias: LONG (Strong) | 6/12 signals aligned
Technical verdict: STRONG LONG. 6 of 12 signals aligned, 1 against.
What supports it (6):
• Daily trend: price > EMA50 > EMA200, bullish stack
• Trend strength (ADX/DI, 15m): ADX 32.2 with buyers in control (DI+ 33.9 vs DI− 13.6)
• 4h RSI: 63.4, bullish momentum (above 55)
• 1h RSI: 69.1, bullish momentum (above 55)
• Short-term momentum (15m): RSI z-score +1.61, last candle +0.80%, buyers pressing
• Relative strength vs BTC: outperforming, +6.31% vs BTC over the last day
What argues against (1):
• Distance from 1h EMA50: +3.2 ATR from the 1h EMA50, overextended with pullback risk
📍 Entry: 0.163523 – 0.164537
🎯 TP1: 0.171543 | TP2: 0.176552 | TP3: 0.184065
🛑 SL: 0.154013
The reasoning:
The daily trend reads bullish, and 6/12 signals aligned favour the long side. The plan is to work the 0.163523 – 0.164537 zone, scale out at 0.171543 and 0.176552, and stay patient for 0.184065. A move through 0.154013 means the idea is wrong and the stop does its job.
💬 Does ACE tag 0.171543 first, or the stop?
Levels mapped on the chart below 👇
⚠️ Personal market analysis only. NFA — manage risk and DYOR.
Educational content, not investment advice or a recommendation to buy, sell, deposit, or withdraw any asset. No paid promotion or referral/affiliate links.