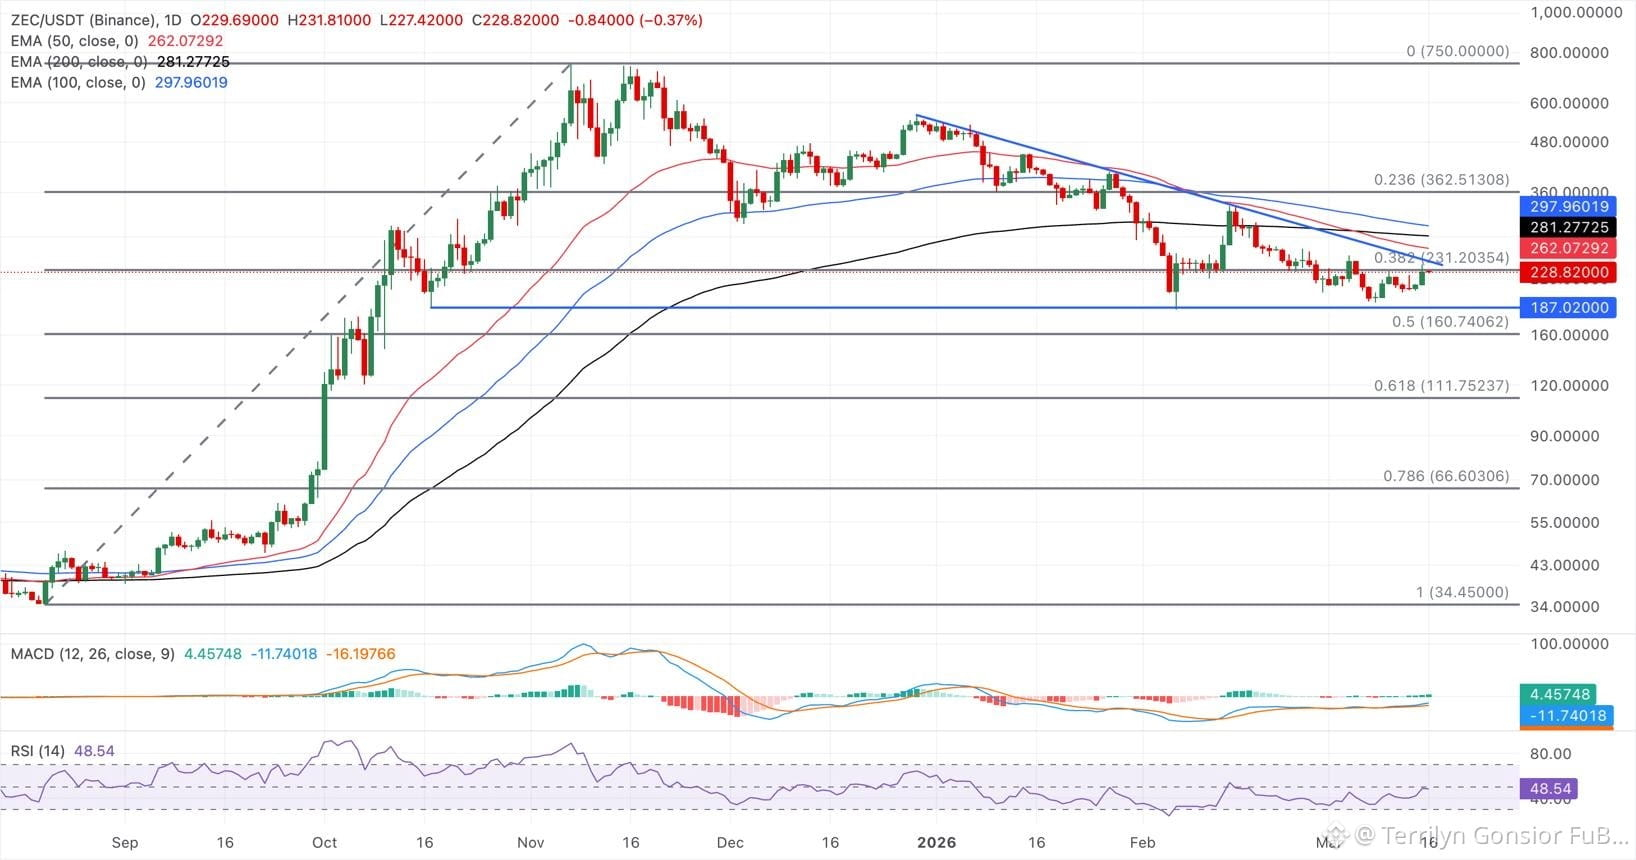
$ZEC : around $1,550, after a sharp recent rally.
📈 Trend: Strong bullish structure; price remains above key moving averages.
⚠️ Resistance: $1,535–$1,550 area.
🛡️ Support: around $1,420, with $1,100–$1,130 as a deeper technical area.
🔥 RSI: ~72.6 on the daily timeframe, indicating overbought conditions and increased pullback risk.
Summary: ZEC remains strongly bullish, but volatility is very high and the current momentum is stretched. A break above recent highs or a pullback toward support are key levels to watch.
#BTCBreaks80K #SOLJumpsAbout10% #SanDiskToJoinSP100OnSep21 #TRMReportsYouTubeScamStole274.6ETH #SECReceivesAmendedInjectiveETFFiling
📈 Trend: Strong bullish structure; price remains above key moving averages.
⚠️ Resistance: $1,535–$1,550 area.
🛡️ Support: around $1,420, with $1,100–$1,130 as a deeper technical area.
🔥 RSI: ~72.6 on the daily timeframe, indicating overbought conditions and increased pullback risk.
Summary: ZEC remains strongly bullish, but volatility is very high and the current momentum is stretched. A break above recent highs or a pullback toward support are key levels to watch.
#BTCBreaks80K #SOLJumpsAbout10% #SanDiskToJoinSP100OnSep21 #TRMReportsYouTubeScamStole274.6ETH #SECReceivesAmendedInjectiveETFFiling