Moving Average Compression and the $70 Liquidity Test: $DASH 15-Minute Market Structure
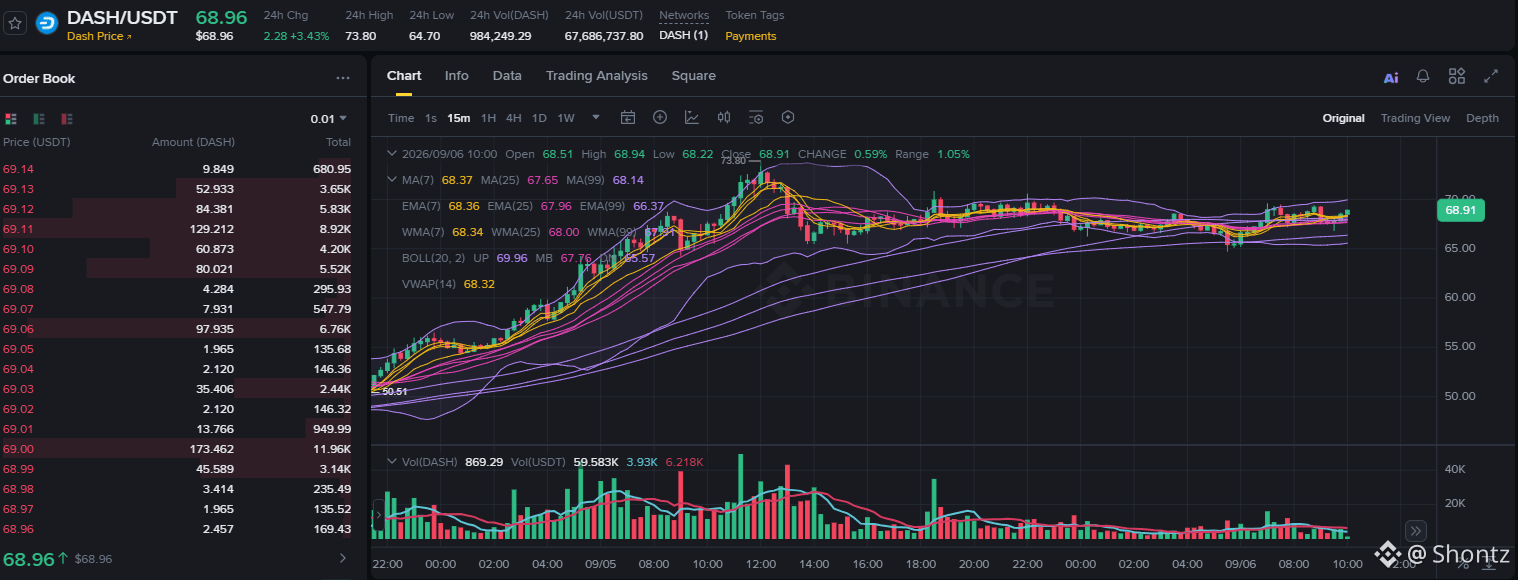
Dash has transitioned from an aggressive impulse into a tight consolidation phase on the 15-minute timeframe, trading around $68.96 (+3.43% 24h) after printing a swing high of $73.80.
The order book and short-term indicators point to significant range compression following the recent volatility expansion:
Moving Average Squeeze: Short-term moving averages are flattening and converging tightly between $67.90 and $68.40 (EMA 7 at $68.36, MA 25 at $67.95, and MA 99 at $68.14). Price is holding directly above the volume-weighted average price (VWAP) at $68.32, signaling that buyers are absorbing supply on shallow pullbacks.
Bollinger Band Squeeze: The Bollinger Bands (Upper: $69.96, Lower: $67.76) have pinched considerably after the rejection from $73.80. Volatility contraction at this level typically precedes a decisive momentum breakout.
Order Book Resistance at $69.00–$69.15: The depth chart reveals clustered sell walls spanning from $69.00 (173.4 DASH) up to $69.11 (129.2 DASH). Clearing this immediate ask liquidity is necessary to initiate a clean retest of the $70.00 psychological barrier and the $73.80 high.
Key Support Zone: On the downside, the confluence of the MA 99 and the lower Bollinger band near $67.70–$68.00 forms the primary defense line. A sustained breakdown below $67.70 risks a deeper retracement toward the $65.00 demand shelf.
Do you expect $DASH to absorb the $69.00 ask wall and retest $73.80, or will it break below $67.70 for a deeper range reset?
Dash has transitioned from an aggressive impulse into a tight consolidation phase on the 15-minute timeframe, trading around $68.96 (+3.43% 24h) after printing a swing high of $73.80.
The order book and short-term indicators point to significant range compression following the recent volatility expansion:
Moving Average Squeeze: Short-term moving averages are flattening and converging tightly between $67.90 and $68.40 (EMA 7 at $68.36, MA 25 at $67.95, and MA 99 at $68.14). Price is holding directly above the volume-weighted average price (VWAP) at $68.32, signaling that buyers are absorbing supply on shallow pullbacks.
Bollinger Band Squeeze: The Bollinger Bands (Upper: $69.96, Lower: $67.76) have pinched considerably after the rejection from $73.80. Volatility contraction at this level typically precedes a decisive momentum breakout.
Order Book Resistance at $69.00–$69.15: The depth chart reveals clustered sell walls spanning from $69.00 (173.4 DASH) up to $69.11 (129.2 DASH). Clearing this immediate ask liquidity is necessary to initiate a clean retest of the $70.00 psychological barrier and the $73.80 high.
Key Support Zone: On the downside, the confluence of the MA 99 and the lower Bollinger band near $67.70–$68.00 forms the primary defense line. A sustained breakdown below $67.70 risks a deeper retracement toward the $65.00 demand shelf.
Do you expect $DASH to absorb the $69.00 ask wall and retest $73.80, or will it break below $67.70 for a deeper range reset?