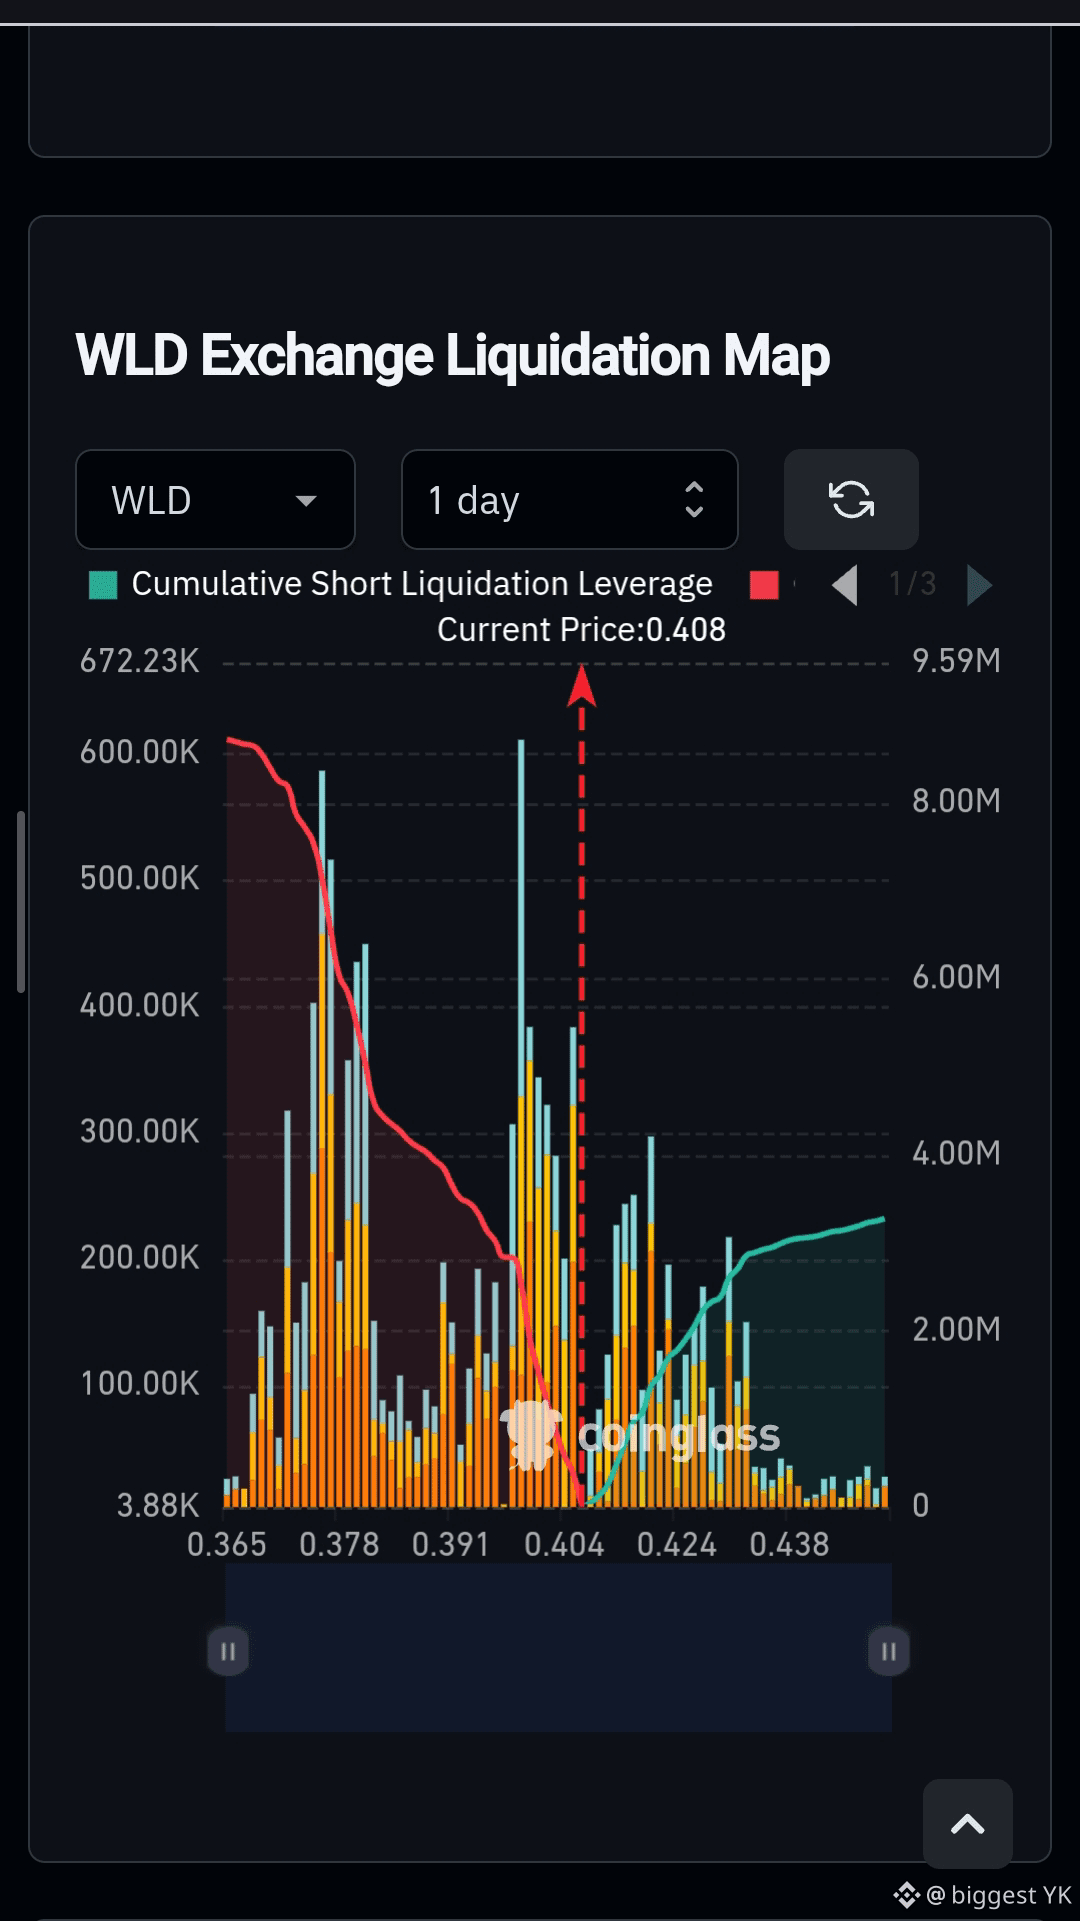
$WLD LIQUIDATION MAP IS GETTING INTERESTING 👀
WLD is currently around $0.408.
The 1-day Coinglass liquidation map shows a clear battle around the current price.
🔴 Below $0.408:
A large amount of long liquidation liquidity is stacked around $0.378–$0.404.
🟢 Above $0.408:
Short liquidation liquidity starts building, with notable clusters around $0.414–$0.431.
This creates two obvious liquidity zones:
📉 $0.378–$0.404 → long liquidation zone
📈 $0.414–$0.431 → short squeeze zone
If WLD breaks above $0.414 with momentum, shorts could start getting squeezed toward the higher liquidity clusters.
But if $0.404 fails, the larger long-liquidation pool below could become the magnet.
One thing to remember:
Liquidation maps don't predict direction. They show where leverage can amplify the next move.
I'm watching $0.404 and $0.414 closely.
Which side do you think WLD hunts first? 👇
WLD is currently around $0.408.
The 1-day Coinglass liquidation map shows a clear battle around the current price.
🔴 Below $0.408:
A large amount of long liquidation liquidity is stacked around $0.378–$0.404.
🟢 Above $0.408:
Short liquidation liquidity starts building, with notable clusters around $0.414–$0.431.
This creates two obvious liquidity zones:
📉 $0.378–$0.404 → long liquidation zone
📈 $0.414–$0.431 → short squeeze zone
If WLD breaks above $0.414 with momentum, shorts could start getting squeezed toward the higher liquidity clusters.
But if $0.404 fails, the larger long-liquidation pool below could become the magnet.
One thing to remember:
Liquidation maps don't predict direction. They show where leverage can amplify the next move.
I'm watching $0.404 and $0.414 closely.
Which side do you think WLD hunts first? 👇