

612 Ceros
24.9k Publications

612 Ceros
 Compte Square Vérifié+
Signaler
Bloquer l’utilisateur
📊 Crypto strategist | Market signals daily | Trade smart, not emotional. Find me on X: @612Ceros
Trade fréquemment
5 an(s)
12 Suivis
177.8K+ Abonnés
226.2K J’aime
Publications
Tous
Citations
PINNED
·
--
Haussier
🚀 Master the Market. Elevate Your Edge with 612 Ceros Futures Prime.
The crypto market does not forgive mistakes. Navigating the immense volatility of Binance Futures requires more than just luck or intuition—it demands a proven system, strict discipline, and a deep understanding of market mechanics.
If you are tired of trading in the dark and ready to take your strategy to the next level, welcome to 612 Ceros Futures Prime.
We built this community for one specific purpose: to help serious traders sharpen their edge. We don't rely on hype, noise, or gambling. Instead, we focus on actionable data, objective market analysis, and executing high-probability setups.
What you gain inside Prime:
📊 Deep Market Analysis: Real-time breakdowns of price action, volume shifts, and key structural levels on Binance Futures.
🛡️ Risk & Leverage Control: Professional strategies to protect your portfolio from unexpected liquidations and optimize your leverage. 🧠 A High-Level Trading Environment: Discuss real setups, review trade executions, and grow alongside a network of driven, like-minded individuals.
Success in futures trading comes down to who you trade with and the information you process. Whether you are looking to refine your current strategies or want to be part of a sharp, highly focused community, you belong here.
👉 Step into 612 Ceros Futures Prime today:
[https://app.binance.com/uni-qr/9prSvcJT](https://app.binance.com/uni-qr/9prSvcJT)
👇 Drop a comment or send a DM if you have any questions about joining!
🚀 Master the Market. Elevate Your Edge with 612 Ceros Futures Prime.
The crypto market does not forgive mistakes. Navigating the immense volatility of Binance Futures requires more than just luck or intuition—it demands a proven system, strict discipline, and a deep understanding of market mechanics.
If you are tired of trading in the dark and ready to take your strategy to the next level, welcome to 612 Ceros Futures Prime.
We built this community for one specific purpose: to help serious traders sharpen their edge. We don't rely on hype, noise, or gambling. Instead, we focus on actionable data, objective market analysis, and executing high-probability setups.
What you gain inside Prime:
📊 Deep Market Analysis: Real-time breakdowns of price action, volume shifts, and key structural levels on Binance Futures.
🛡️ Risk & Leverage Control: Professional strategies to protect your portfolio from unexpected liquidations and optimize your leverage. 🧠 A High-Level Trading Environment: Discuss real setups, review trade executions, and grow alongside a network of driven, like-minded individuals.
Success in futures trading comes down to who you trade with and the information you process. Whether you are looking to refine your current strategies or want to be part of a sharp, highly focused community, you belong here.
👉 Step into 612 Ceros Futures Prime today:
https://app.binance.com/uni-qr/9prSvcJT
👇 Drop a comment or send a DM if you have any questions about joining!
The crypto market does not forgive mistakes. Navigating the immense volatility of Binance Futures requires more than just luck or intuition—it demands a proven system, strict discipline, and a deep understanding of market mechanics.
If you are tired of trading in the dark and ready to take your strategy to the next level, welcome to 612 Ceros Futures Prime.
We built this community for one specific purpose: to help serious traders sharpen their edge. We don't rely on hype, noise, or gambling. Instead, we focus on actionable data, objective market analysis, and executing high-probability setups.
What you gain inside Prime:
📊 Deep Market Analysis: Real-time breakdowns of price action, volume shifts, and key structural levels on Binance Futures.
🛡️ Risk & Leverage Control: Professional strategies to protect your portfolio from unexpected liquidations and optimize your leverage. 🧠 A High-Level Trading Environment: Discuss real setups, review trade executions, and grow alongside a network of driven, like-minded individuals.
Success in futures trading comes down to who you trade with and the information you process. Whether you are looking to refine your current strategies or want to be part of a sharp, highly focused community, you belong here.
👉 Step into 612 Ceros Futures Prime today:
https://app.binance.com/uni-qr/9prSvcJT
👇 Drop a comment or send a DM if you have any questions about joining!
10
1
17
2.5k
·
--
Haussier
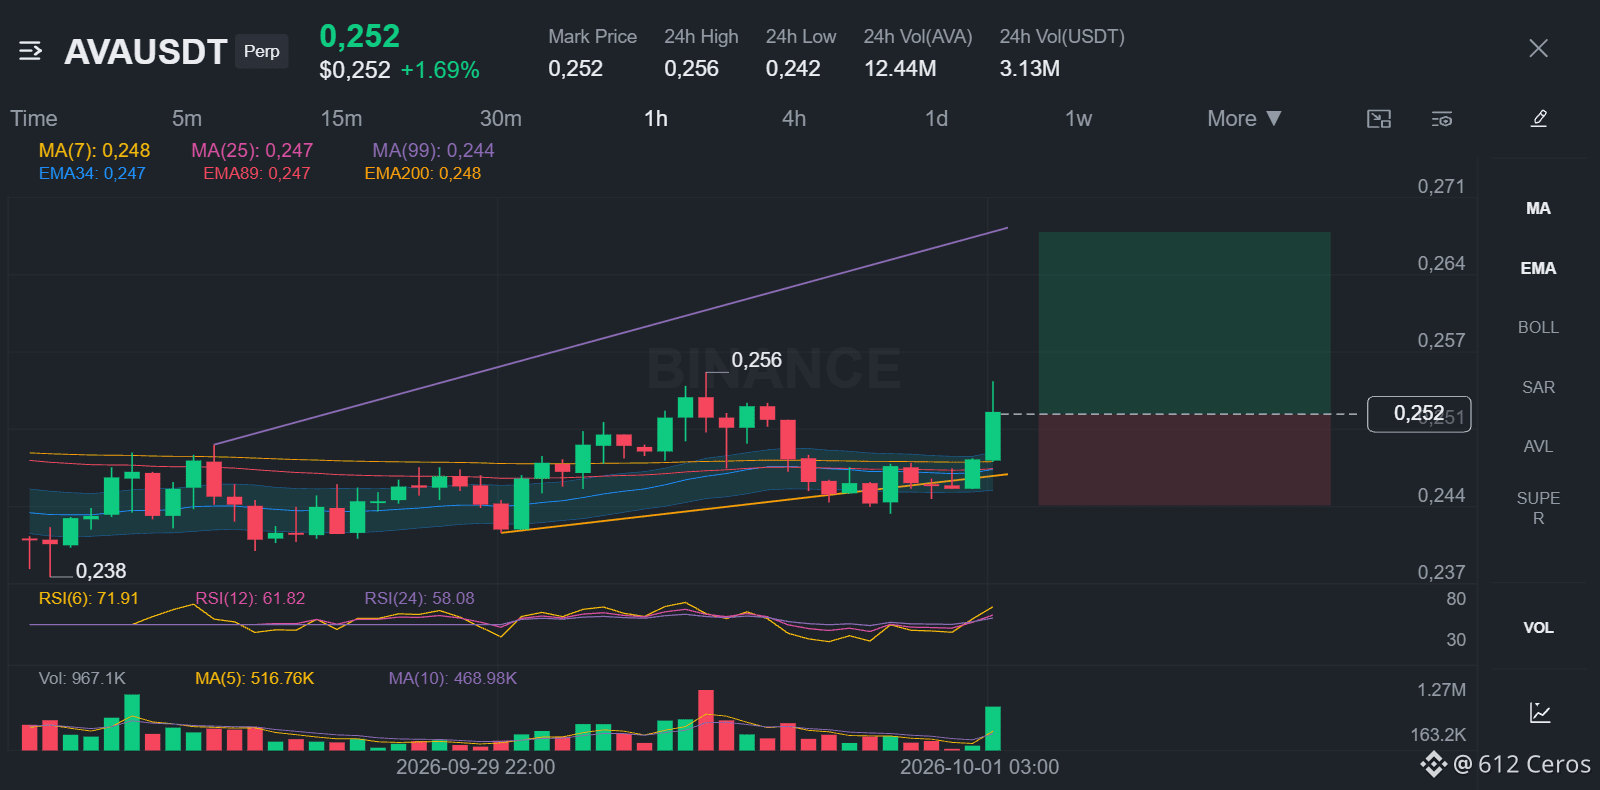
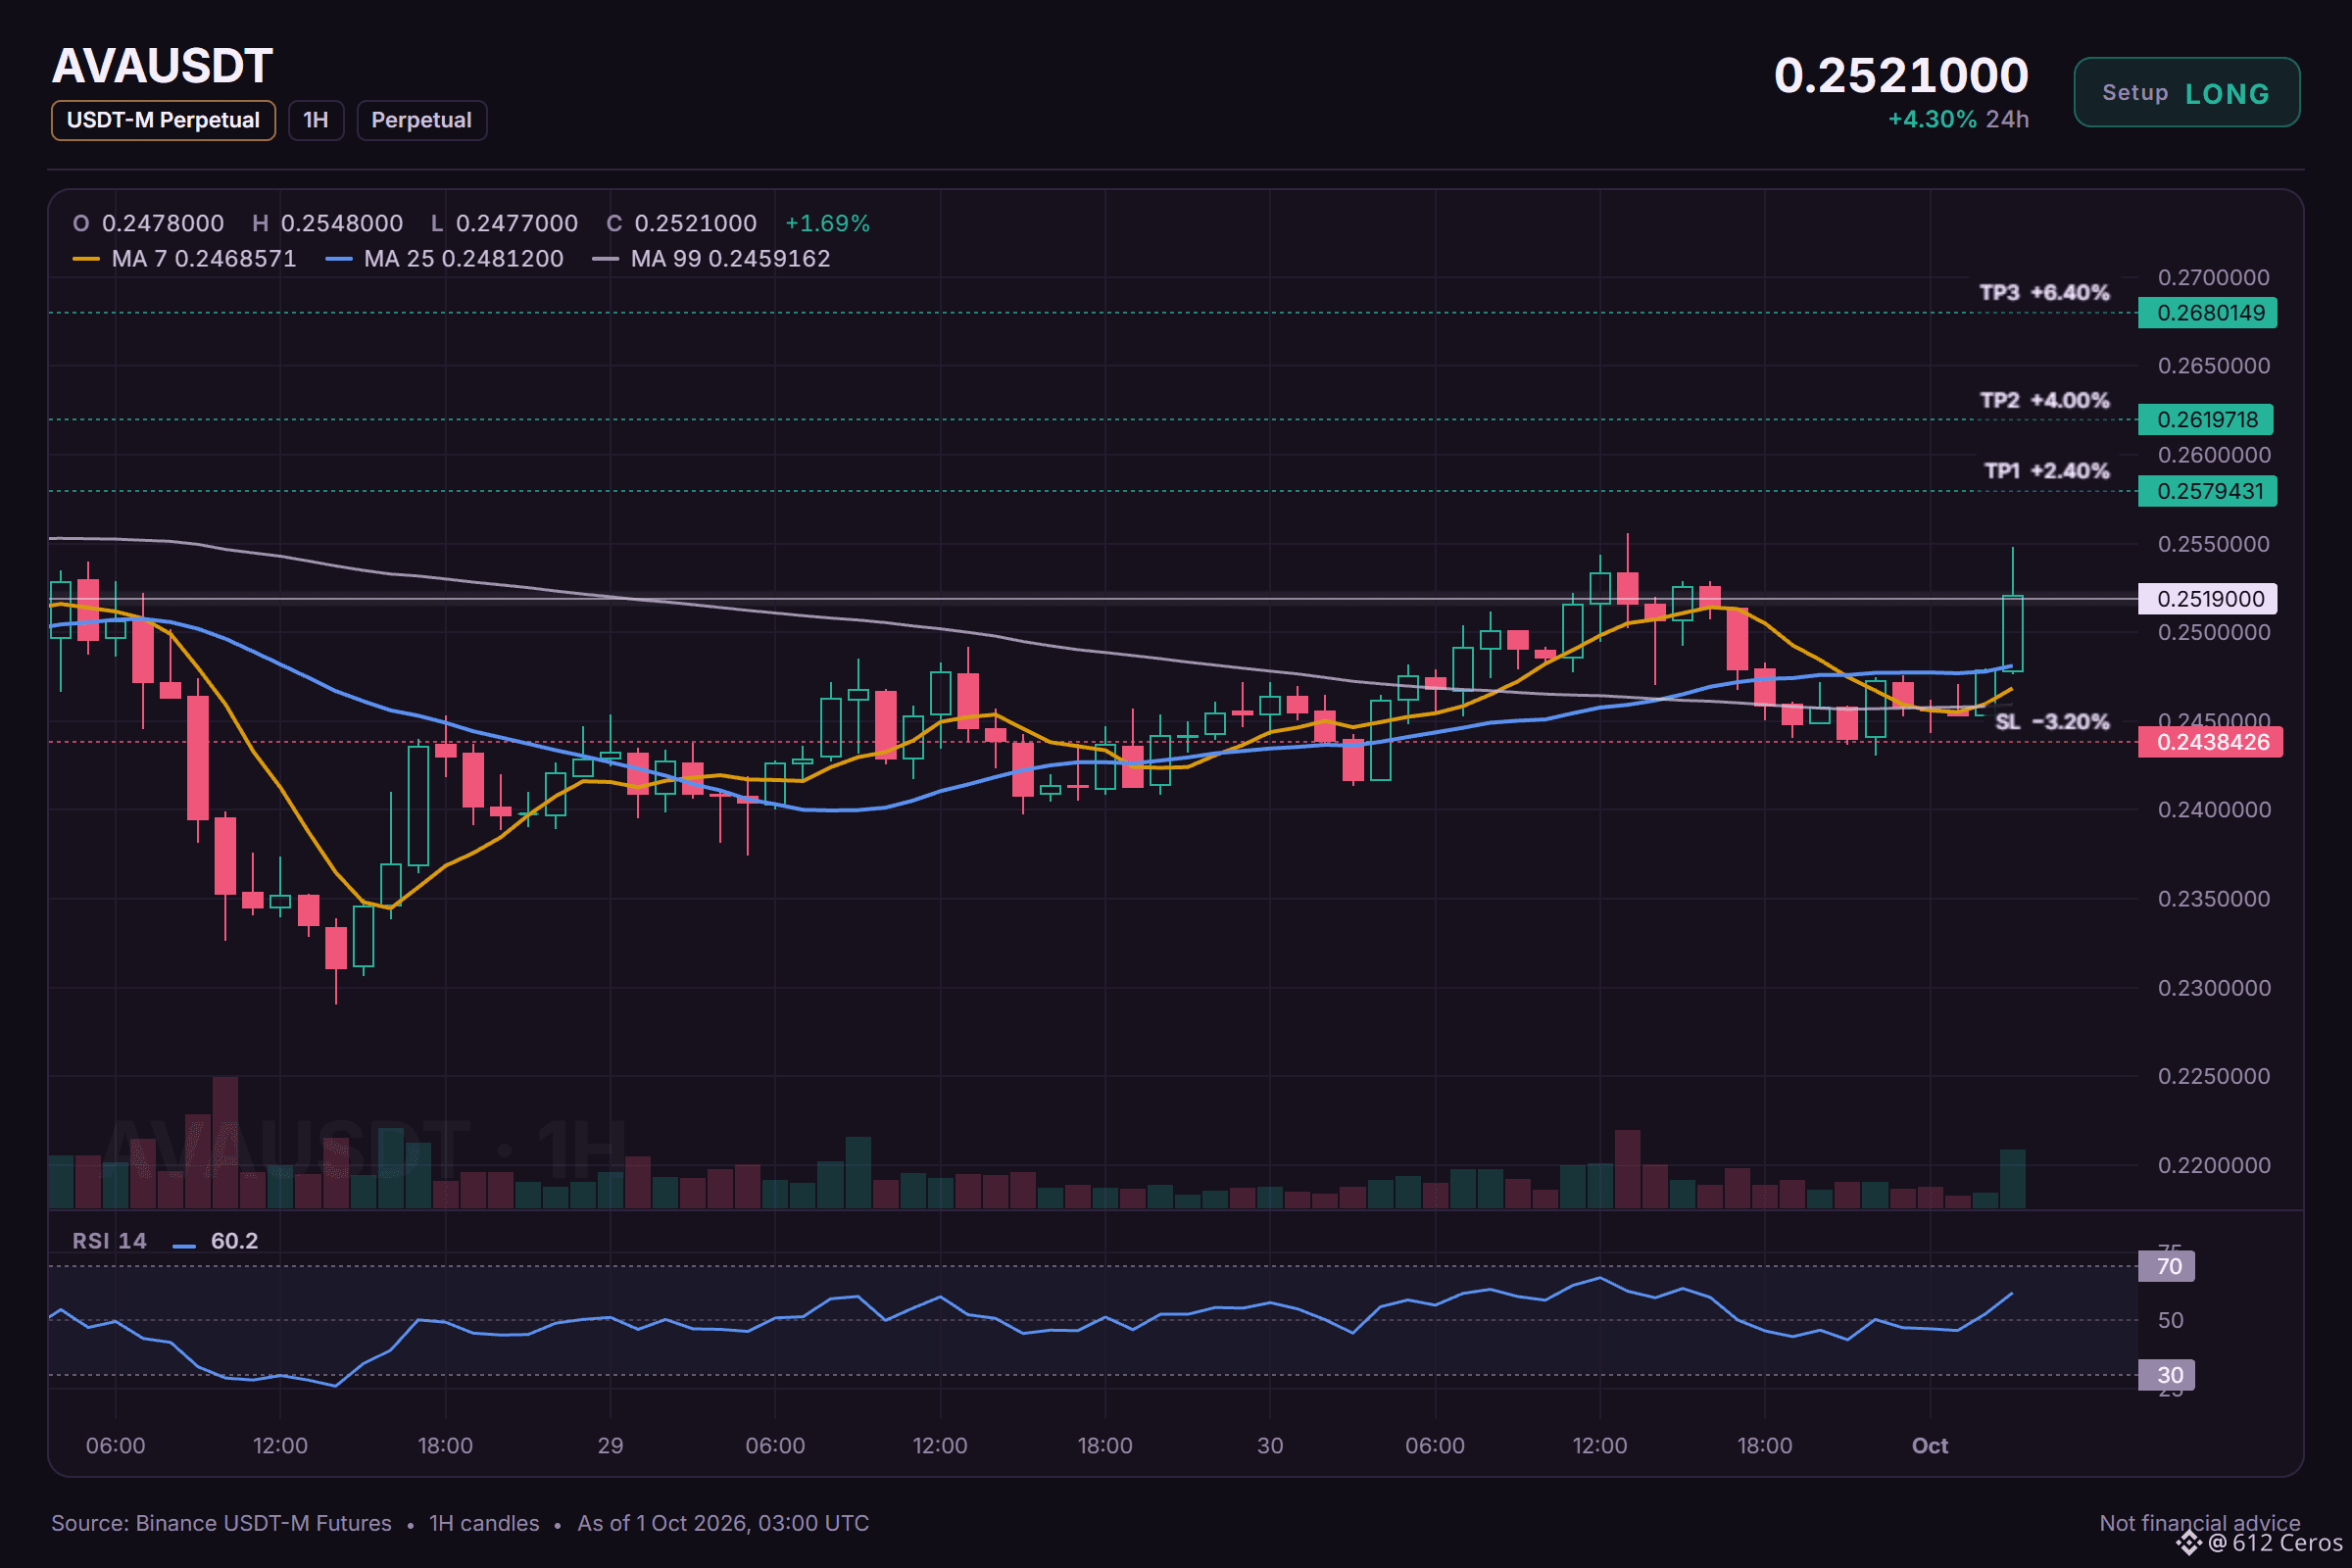
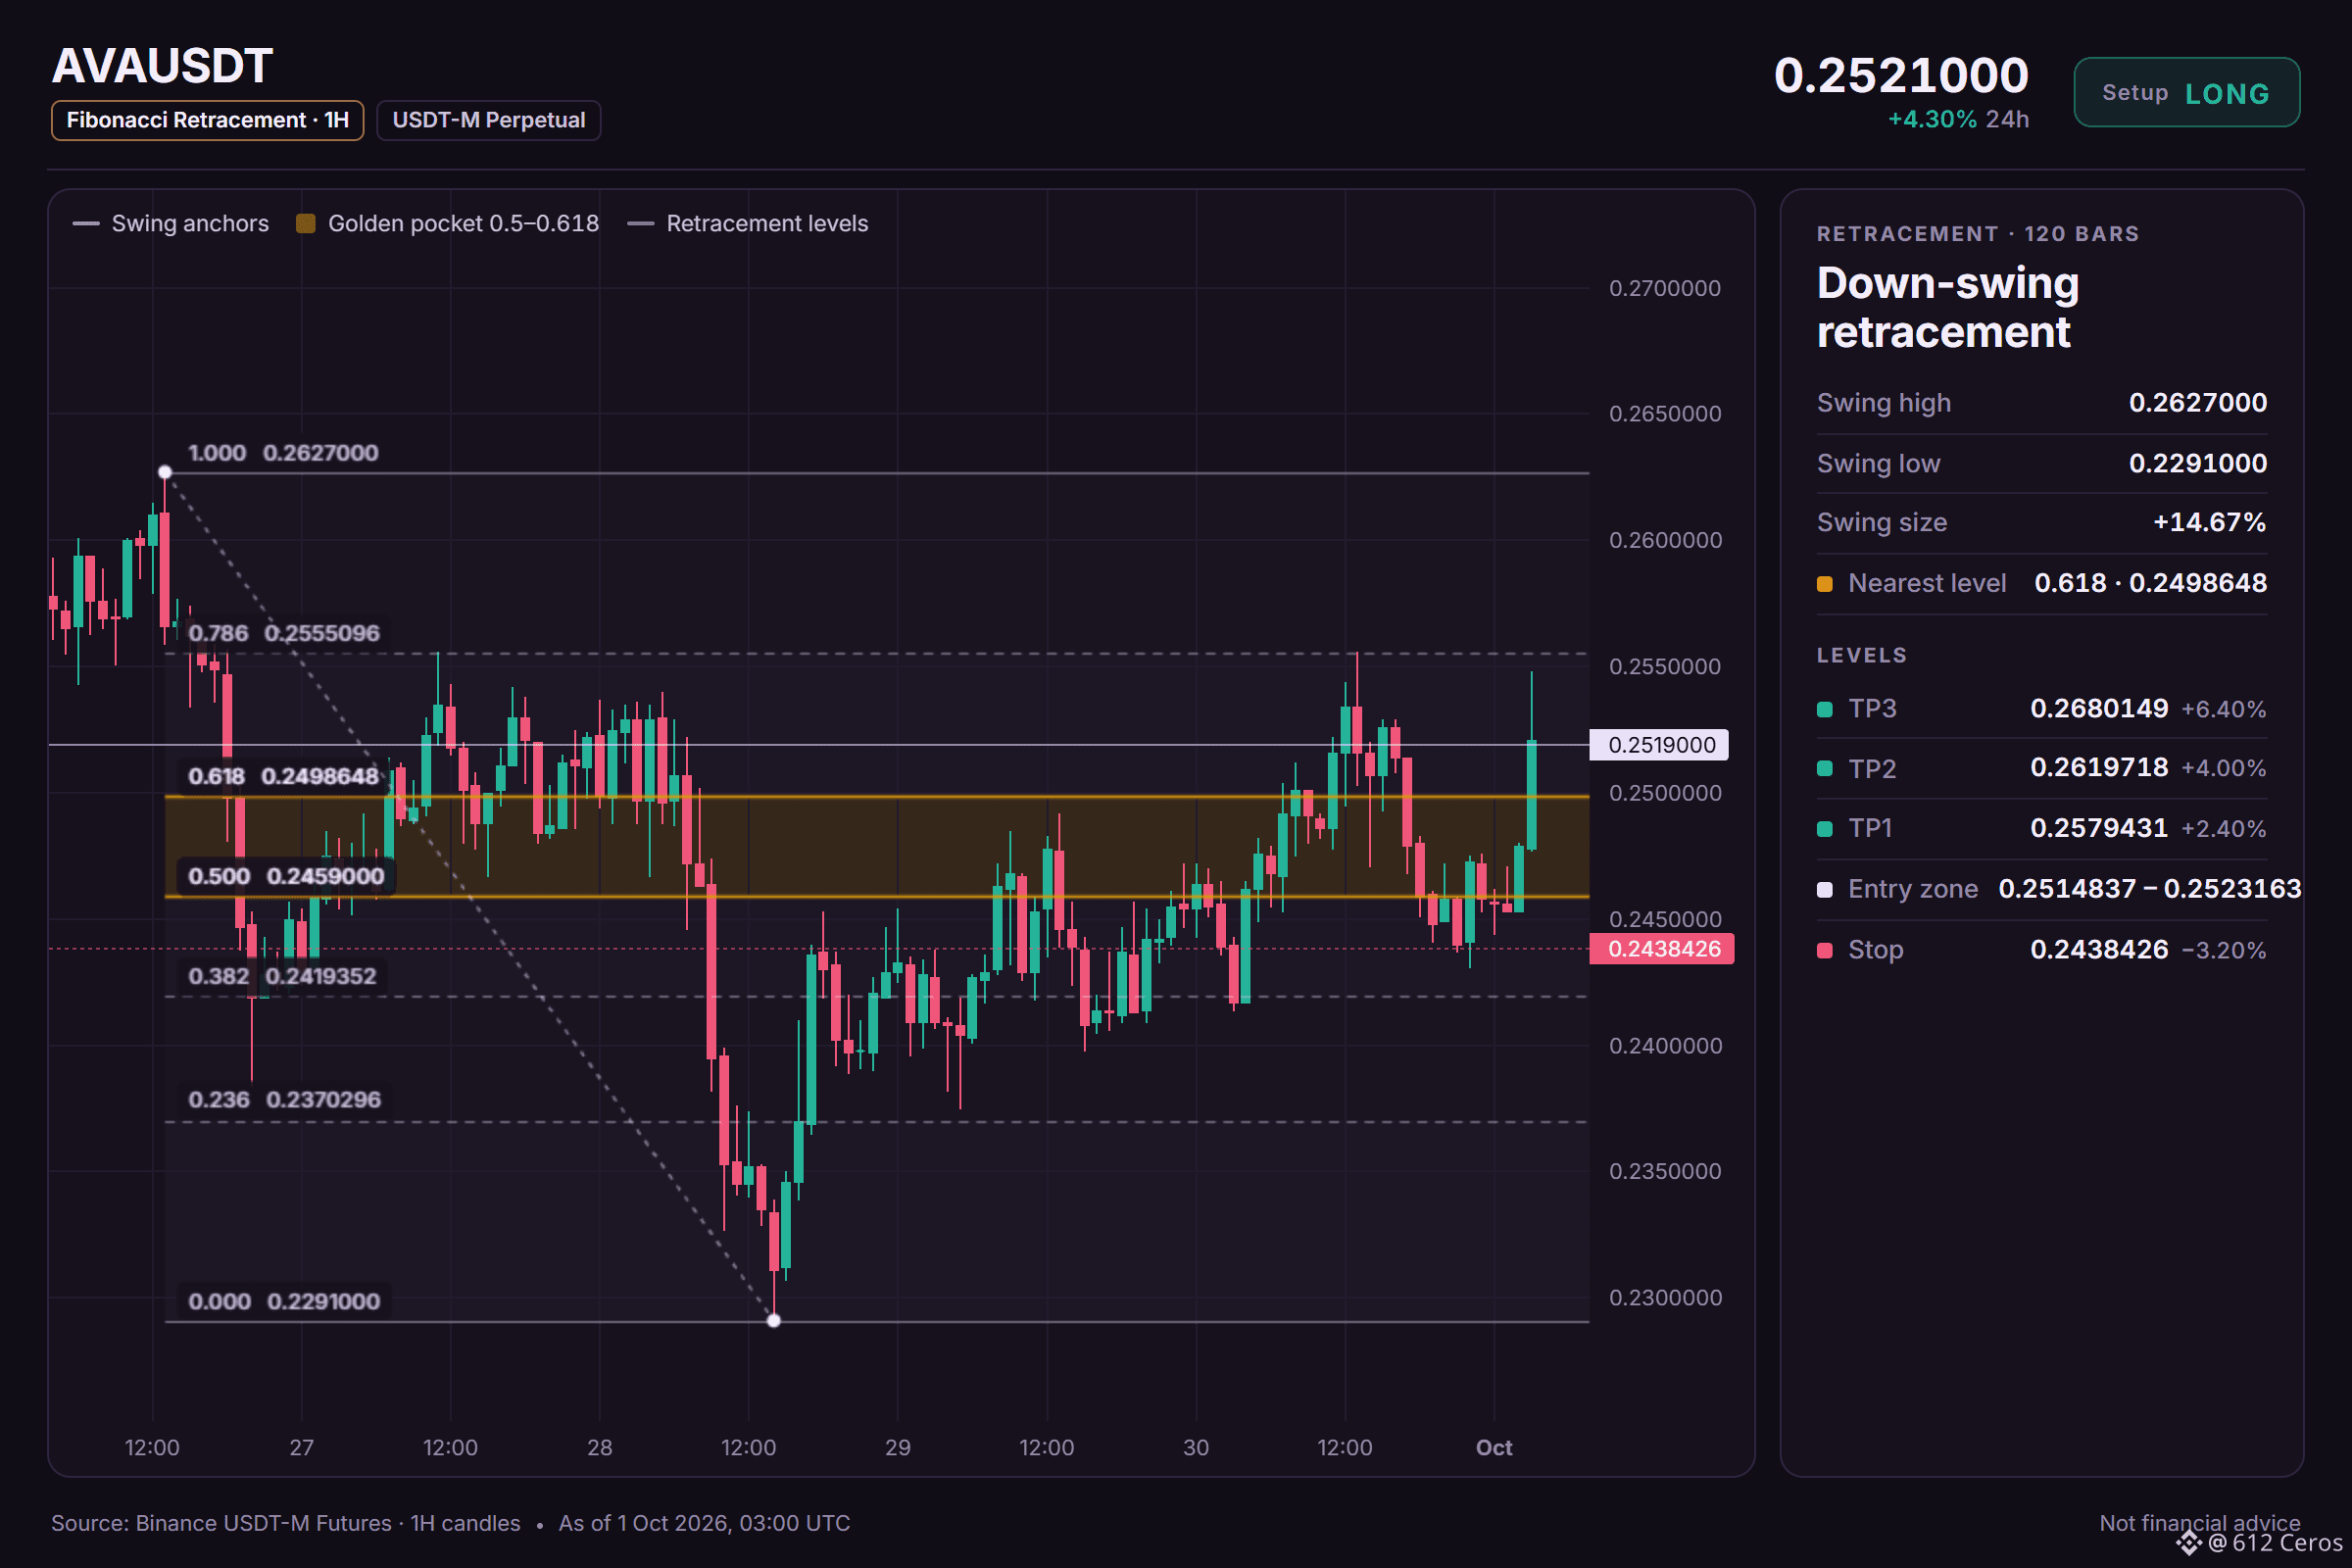
AVA is leaning long while RSI warns of a top
🟢 LONG $AVA /USDT: expecting price to go UP
Bias: LONG · Leaning
📍 Entry: 0.2514837 – 0.2523163
🎯 TP1: 0.2579431 (+2.4%)
🎯 TP2: 0.2619718 (+4.0%)
🎯 TP3: 0.2680149 (+6.4%)
🛑 SL: 0.2438426 (-3.2%)
💡 Enter only inside the zone. Take half at TP1, then move the stop to entry.
⚠️ Moderate conviction only. Keep size light.
Why LONG? Leaning call, 4/12 signals agree, 1 against, 7 undecided.
✅ 4h trend: price > EMA50 > EMA200, bullish stack → the swing trend is up
✅ Trend strength (ADX/DI, 15m): ADX 22.3 with buyers in control (DI+ 38.3 vs DI− 10.0) → buyers are driving the move
✅ 1h RSI: 60.2, bullish momentum (above 55) → buyers have the momentum
⚠️ RSI extreme in a range: RSI z-score +2.20 in a range, fade-the-high risk → top of a range, sellers often step in
📓 Trade note | AVA
I'm watching AVA on the 4h for a long setup. The 4h trend is up with price above both EMAs, which means the swing direction favors buyers. I want to see the 1h RSI hold above 60, because that shows momentum is still with the buyers. The main risk is the 1h RSI z-score at plus 2.20 in a range, which means sellers often step in at the top of a range.
What level would you use to invalidate this long if AVA dips below the entry low?
Chart with every level 👇
{future}(AVAUSDT)
📲 Want more of my latest signals? Join me here:
[https://app.binance.com/uni-qr/D26WbL9t](https://app.binance.com/uni-qr/D26WbL9t)
⚠️ Personal market analysis only. NFA — manage risk and DYOR.
Educational content, not investment advice or a recommendation to buy, sell, deposit, or withdraw any asset. No paid promotion or referral/affiliate links.
AVA is leaning long while RSI warns of a top
🟢 LONG $AVA /USDT: expecting price to go UP
Bias: LONG · Leaning
📍 Entry: 0.2514837 – 0.2523163
🎯 TP1: 0.2579431 (+2.4%)
🎯 TP2: 0.2619718 (+4.0%)
🎯 TP3: 0.2680149 (+6.4%)
🛑 SL: 0.2438426 (-3.2%)
💡 Enter only inside the zone. Take half at TP1, then move the stop to entry.
⚠️ Moderate conviction only. Keep size light.
Why LONG? Leaning call, 4/12 signals agree, 1 against, 7 undecided.
✅ 4h trend: price > EMA50 > EMA200, bullish stack → the swing trend is up
✅ Trend strength (ADX/DI, 15m): ADX 22.3 with buyers in control (DI+ 38.3 vs DI− 10.0) → buyers are driving the move
✅ 1h RSI: 60.2, bullish momentum (above 55) → buyers have the momentum
⚠️ RSI extreme in a range: RSI z-score +2.20 in a range, fade-the-high risk → top of a range, sellers often step in
📓 Trade note | AVA
I'm watching AVA on the 4h for a long setup. The 4h trend is up with price above both EMAs, which means the swing direction favors buyers. I want to see the 1h RSI hold above 60, because that shows momentum is still with the buyers. The main risk is the 1h RSI z-score at plus 2.20 in a range, which means sellers often step in at the top of a range.
What level would you use to invalidate this long if AVA dips below the entry low?
Chart with every level 👇
📲 Want more of my latest signals? Join me here:
https://app.binance.com/uni-qr/D26WbL9t
⚠️ Personal market analysis only. NFA — manage risk and DYOR.
Educational content, not investment advice or a recommendation to buy, sell, deposit, or withdraw any asset. No paid promotion or referral/affiliate links.
🟢 LONG $AVA /USDT: expecting price to go UP
Bias: LONG · Leaning
📍 Entry: 0.2514837 – 0.2523163
🎯 TP1: 0.2579431 (+2.4%)
🎯 TP2: 0.2619718 (+4.0%)
🎯 TP3: 0.2680149 (+6.4%)
🛑 SL: 0.2438426 (-3.2%)
💡 Enter only inside the zone. Take half at TP1, then move the stop to entry.
⚠️ Moderate conviction only. Keep size light.
Why LONG? Leaning call, 4/12 signals agree, 1 against, 7 undecided.
✅ 4h trend: price > EMA50 > EMA200, bullish stack → the swing trend is up
✅ Trend strength (ADX/DI, 15m): ADX 22.3 with buyers in control (DI+ 38.3 vs DI− 10.0) → buyers are driving the move
✅ 1h RSI: 60.2, bullish momentum (above 55) → buyers have the momentum
⚠️ RSI extreme in a range: RSI z-score +2.20 in a range, fade-the-high risk → top of a range, sellers often step in
📓 Trade note | AVA
I'm watching AVA on the 4h for a long setup. The 4h trend is up with price above both EMAs, which means the swing direction favors buyers. I want to see the 1h RSI hold above 60, because that shows momentum is still with the buyers. The main risk is the 1h RSI z-score at plus 2.20 in a range, which means sellers often step in at the top of a range.
What level would you use to invalidate this long if AVA dips below the entry low?
Chart with every level 👇
📲 Want more of my latest signals? Join me here:
https://app.binance.com/uni-qr/D26WbL9t
⚠️ Personal market analysis only. NFA — manage risk and DYOR.
Educational content, not investment advice or a recommendation to buy, sell, deposit, or withdraw any asset. No paid promotion or referral/affiliate links.
53
·
--
Haussier
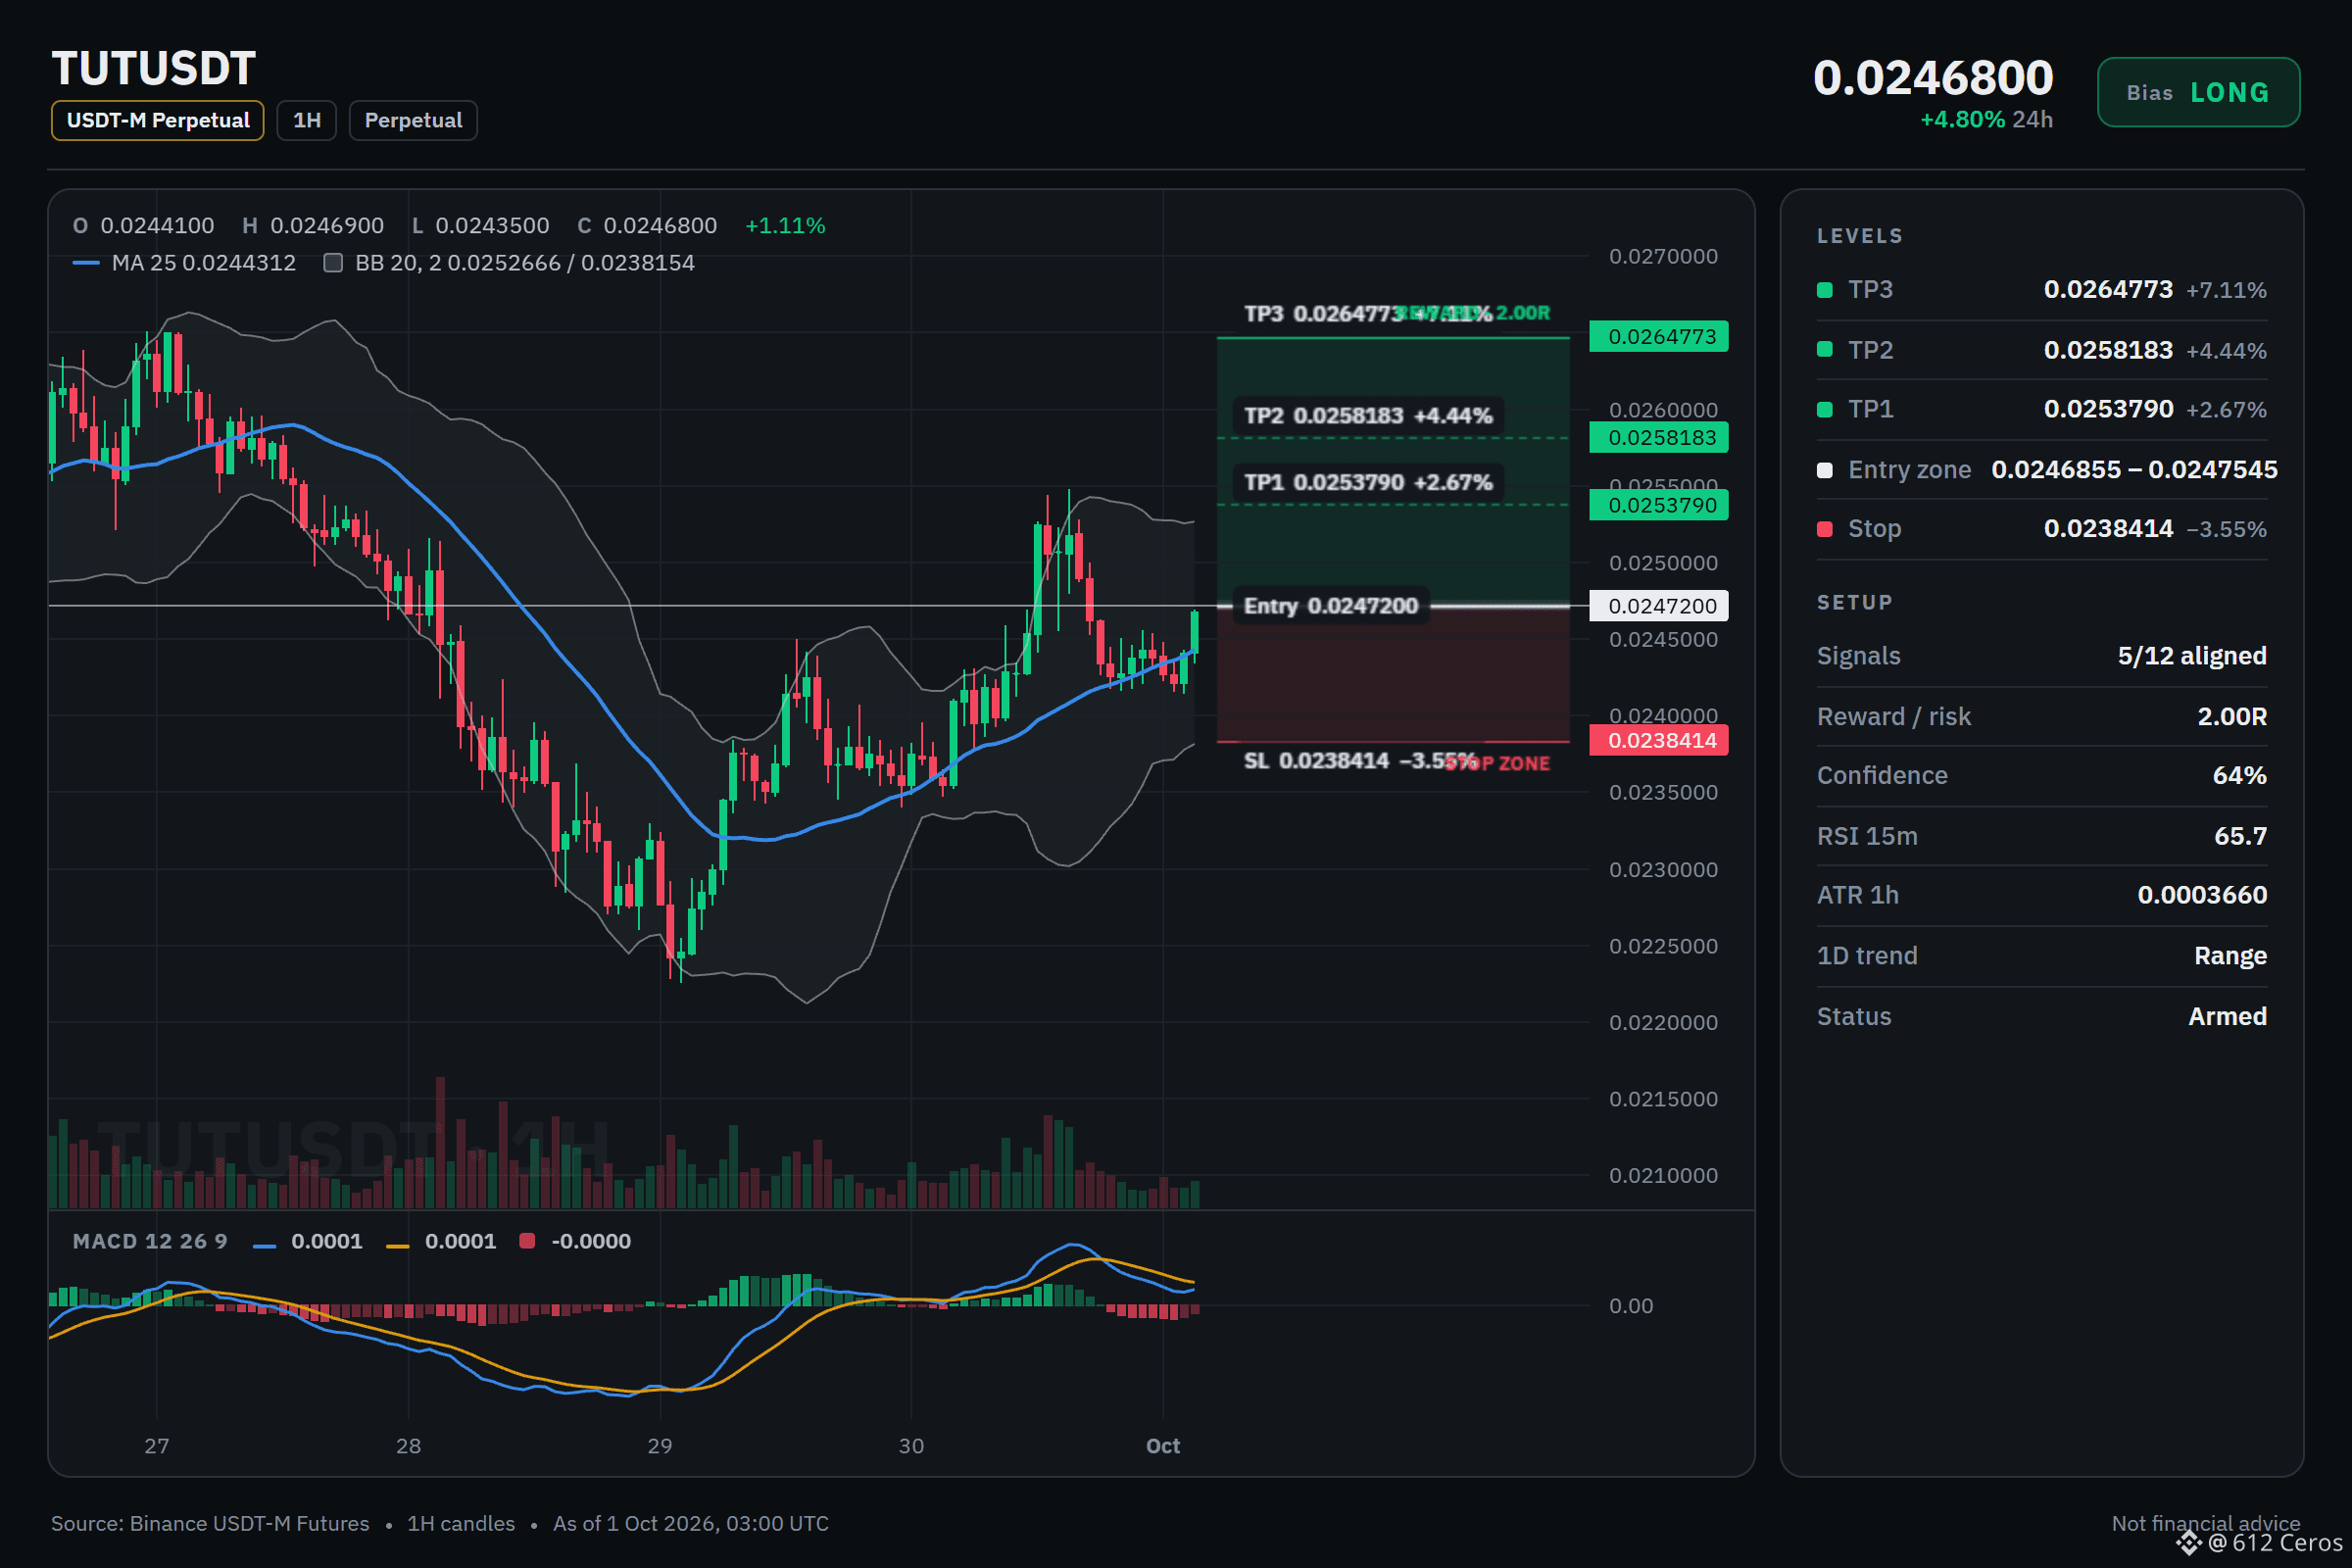
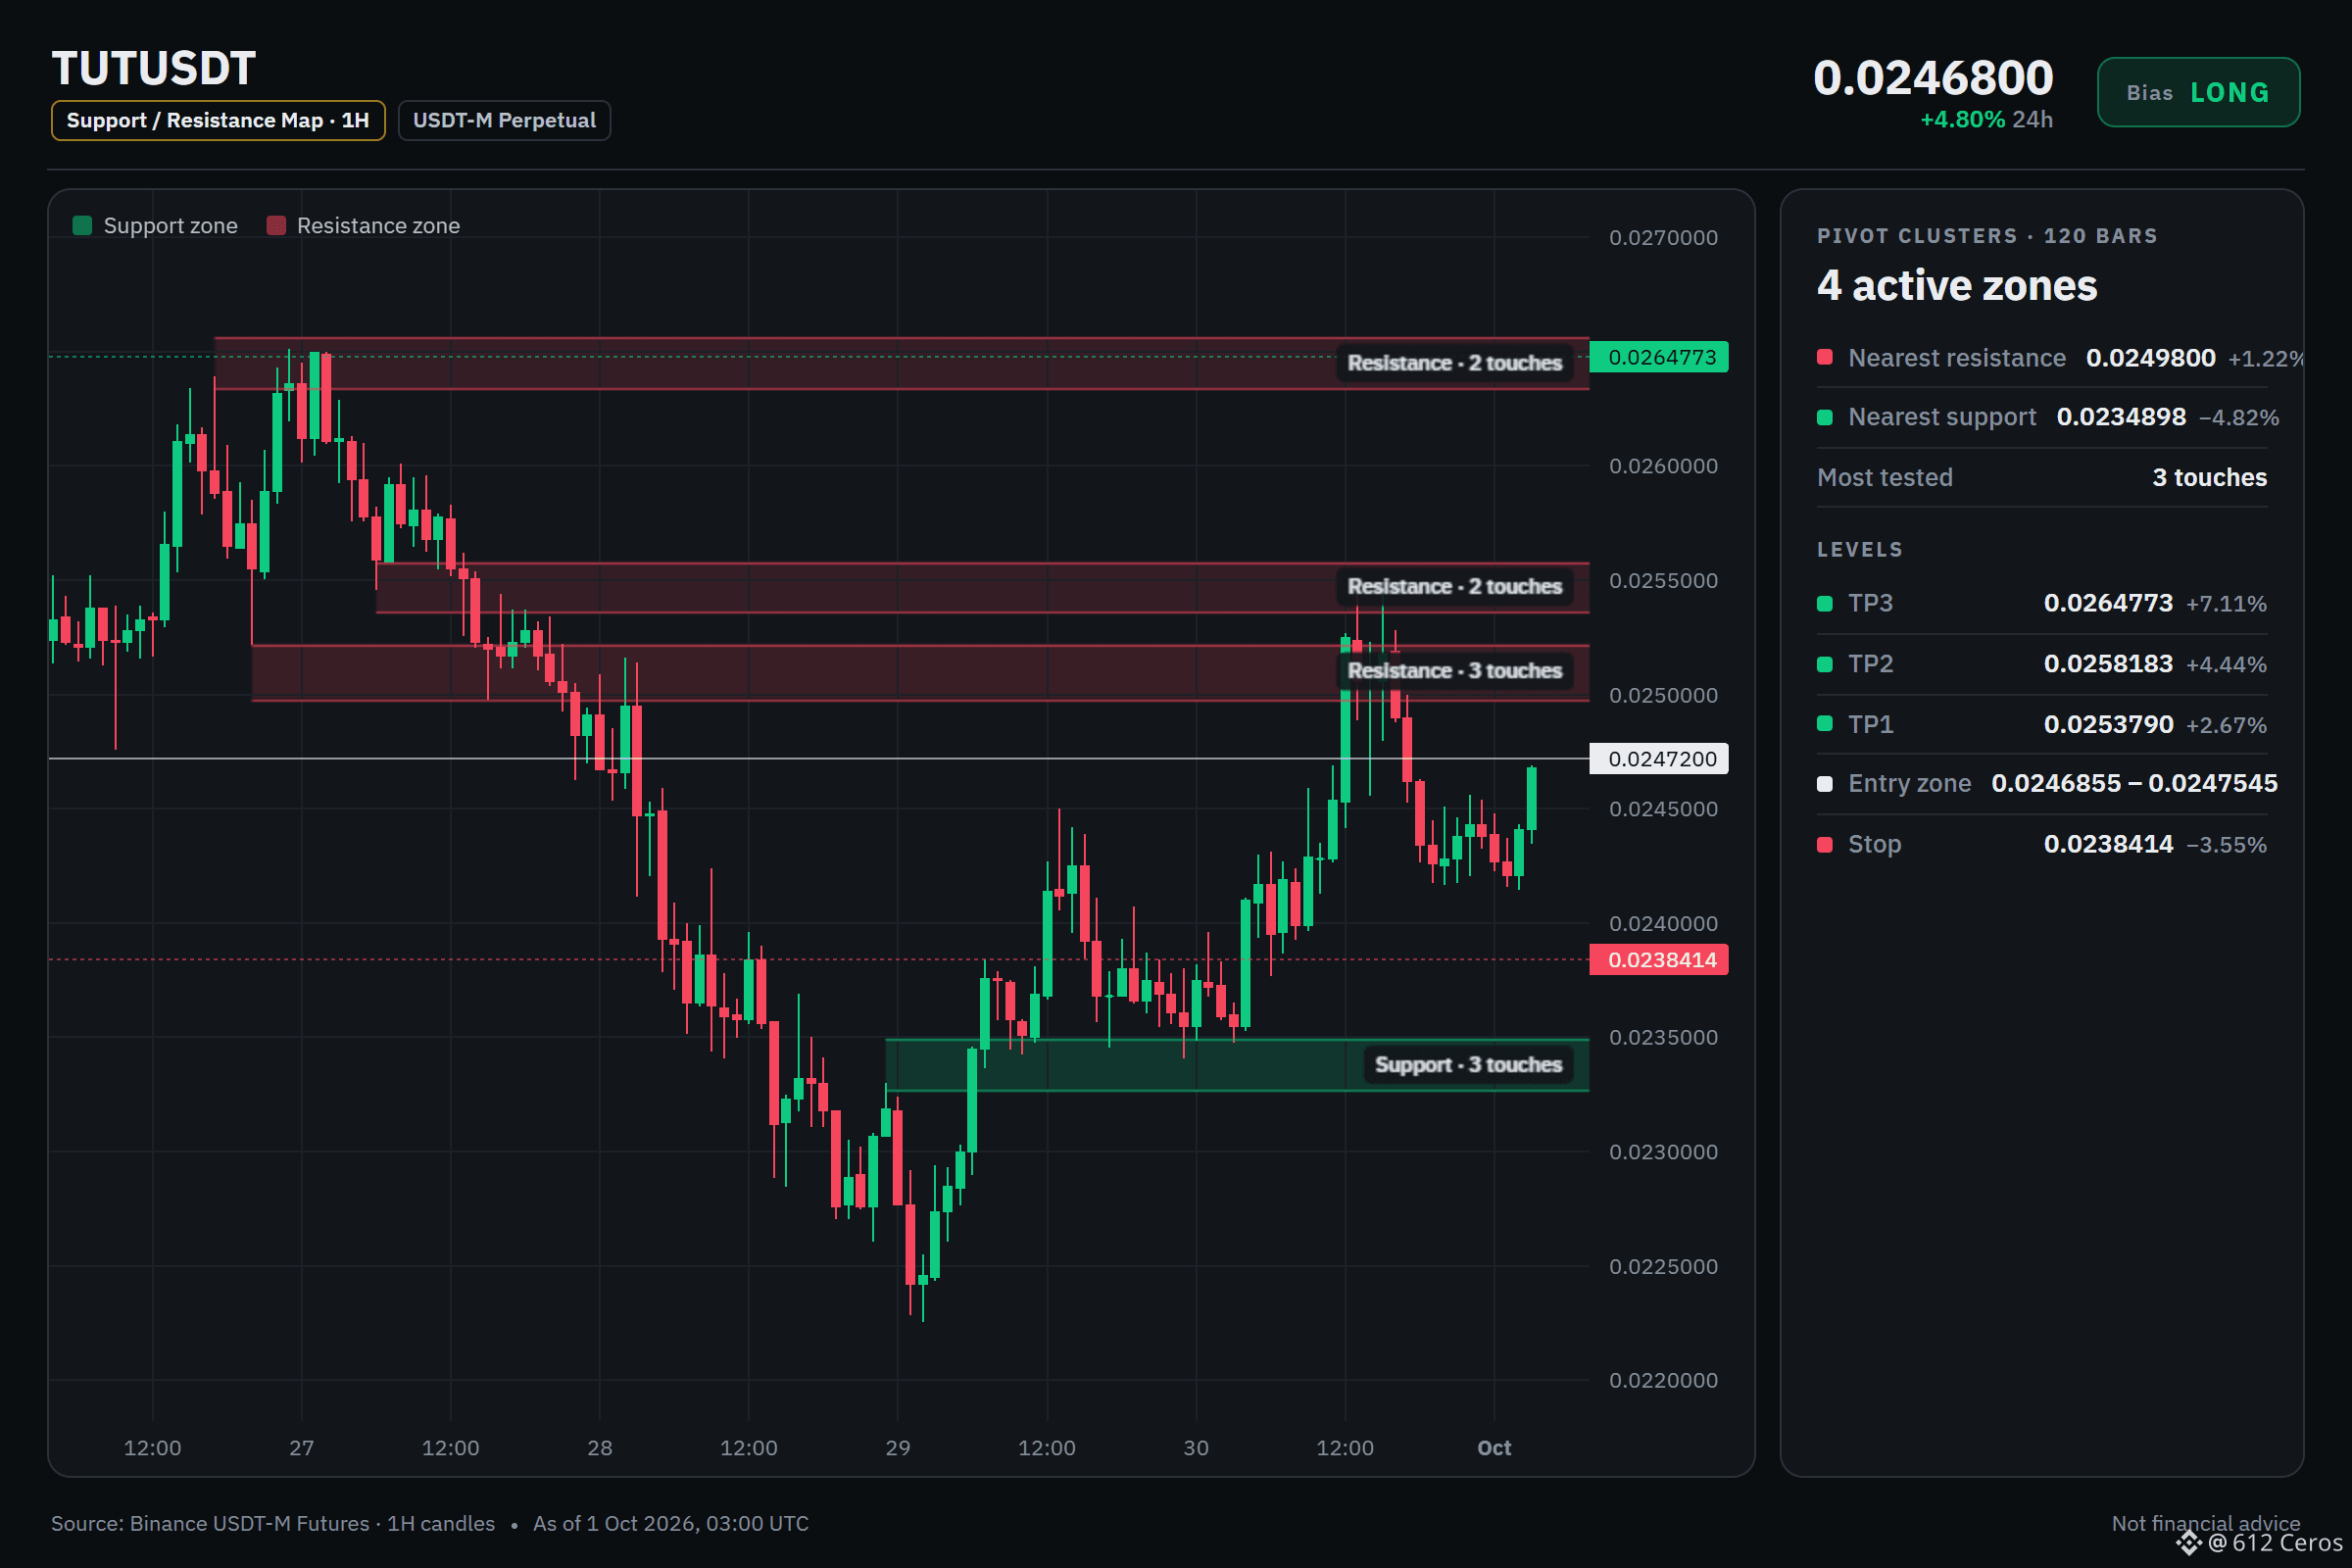
TUT long setup: the levels I'm watching
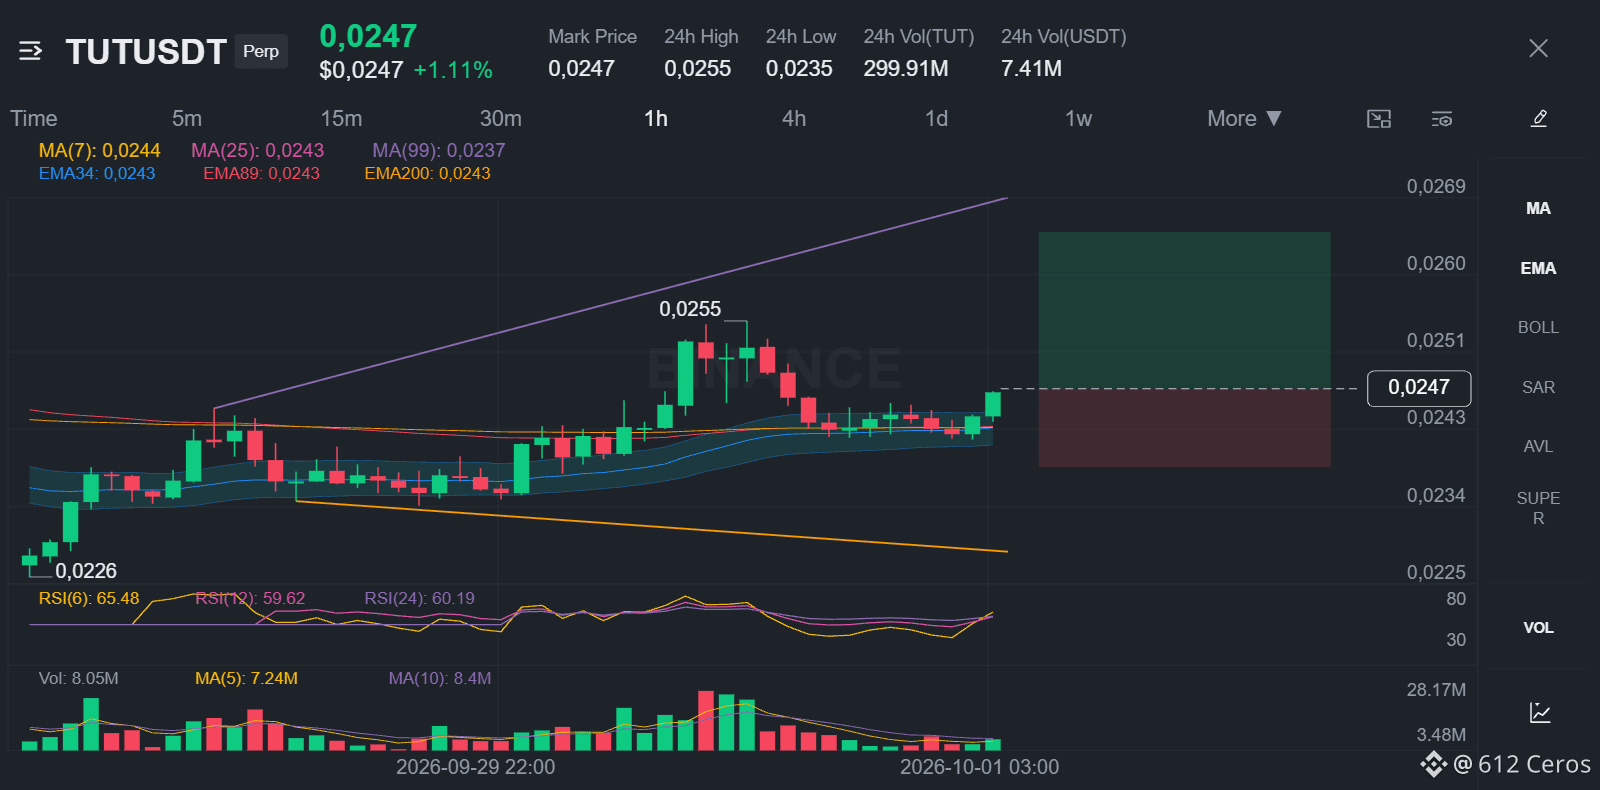
🟢 LONG $TUT /USDT: expecting price to go UP
Bias: LONG · Leaning
📍 Entry: 0.0246855 – 0.0247545
🎯 TP1: 0.0253790 (+2.7%)
🎯 TP2: 0.0258183 (+4.4%)
🎯 TP3: 0.0264773 (+7.1%)
🛑 SL: 0.0238414 (-3.6%)
💡 Enter only inside the zone. Take half at TP1, then move the stop to entry.
⚠️ Moderate conviction only. Keep size light.
Why LONG? Leaning call, 5/12 signals agree, 1 against, 6 undecided.
✅ 1h trend: price > EMA50 > EMA200, bullish stack → the short-term trend is up
✅ Trend strength (ADX/DI, 15m): ADX 20.3 with buyers in control (DI+ 25.0 vs DI− 14.6) → buyers are driving the move
✅ 1h RSI: 58.1, bullish momentum (above 55) → buyers have the momentum
⚠️ RSI extreme in a range: RSI z-score +3.12 in a range, fade-the-high risk → top of a range, sellers often step in
Why I like it:
The daily trend reads range, and 5/12 signals aligned favour the long side. The plan is to work the 0.0246855 – 0.0247545 zone, scale out at 0.0253790 and 0.0258183, and stay patient for 0.0264773. A move through 0.0238414 means the idea is wrong and the stop does its job.
💬 Does TUT tag 0.0253790 first, or the stop?
Full setup on the chart 👇
{future}(TUTUSDT)
📲 Want more of my latest signals? Join me here:
[https://app.binance.com/uni-qr/D26WbL9t](https://app.binance.com/uni-qr/D26WbL9t)
⚠️ Personal market analysis only. NFA — manage risk and DYOR.
Educational content, not investment advice or a recommendation to buy, sell, deposit, or withdraw any asset. No paid promotion or referral/affiliate links.
TUT long setup: the levels I'm watching
🟢 LONG $TUT /USDT: expecting price to go UP
Bias: LONG · Leaning
📍 Entry: 0.0246855 – 0.0247545
🎯 TP1: 0.0253790 (+2.7%)
🎯 TP2: 0.0258183 (+4.4%)
🎯 TP3: 0.0264773 (+7.1%)
🛑 SL: 0.0238414 (-3.6%)
💡 Enter only inside the zone. Take half at TP1, then move the stop to entry.
⚠️ Moderate conviction only. Keep size light.
Why LONG? Leaning call, 5/12 signals agree, 1 against, 6 undecided.
✅ 1h trend: price > EMA50 > EMA200, bullish stack → the short-term trend is up
✅ Trend strength (ADX/DI, 15m): ADX 20.3 with buyers in control (DI+ 25.0 vs DI− 14.6) → buyers are driving the move
✅ 1h RSI: 58.1, bullish momentum (above 55) → buyers have the momentum
⚠️ RSI extreme in a range: RSI z-score +3.12 in a range, fade-the-high risk → top of a range, sellers often step in
Why I like it:
The daily trend reads range, and 5/12 signals aligned favour the long side. The plan is to work the 0.0246855 – 0.0247545 zone, scale out at 0.0253790 and 0.0258183, and stay patient for 0.0264773. A move through 0.0238414 means the idea is wrong and the stop does its job.
💬 Does TUT tag 0.0253790 first, or the stop?
Full setup on the chart 👇
📲 Want more of my latest signals? Join me here:
https://app.binance.com/uni-qr/D26WbL9t
⚠️ Personal market analysis only. NFA — manage risk and DYOR.
Educational content, not investment advice or a recommendation to buy, sell, deposit, or withdraw any asset. No paid promotion or referral/affiliate links.
🟢 LONG $TUT /USDT: expecting price to go UP
Bias: LONG · Leaning
📍 Entry: 0.0246855 – 0.0247545
🎯 TP1: 0.0253790 (+2.7%)
🎯 TP2: 0.0258183 (+4.4%)
🎯 TP3: 0.0264773 (+7.1%)
🛑 SL: 0.0238414 (-3.6%)
💡 Enter only inside the zone. Take half at TP1, then move the stop to entry.
⚠️ Moderate conviction only. Keep size light.
Why LONG? Leaning call, 5/12 signals agree, 1 against, 6 undecided.
✅ 1h trend: price > EMA50 > EMA200, bullish stack → the short-term trend is up
✅ Trend strength (ADX/DI, 15m): ADX 20.3 with buyers in control (DI+ 25.0 vs DI− 14.6) → buyers are driving the move
✅ 1h RSI: 58.1, bullish momentum (above 55) → buyers have the momentum
⚠️ RSI extreme in a range: RSI z-score +3.12 in a range, fade-the-high risk → top of a range, sellers often step in
Why I like it:
The daily trend reads range, and 5/12 signals aligned favour the long side. The plan is to work the 0.0246855 – 0.0247545 zone, scale out at 0.0253790 and 0.0258183, and stay patient for 0.0264773. A move through 0.0238414 means the idea is wrong and the stop does its job.
💬 Does TUT tag 0.0253790 first, or the stop?
Full setup on the chart 👇
📲 Want more of my latest signals? Join me here:
https://app.binance.com/uni-qr/D26WbL9t
⚠️ Personal market analysis only. NFA — manage risk and DYOR.
Educational content, not investment advice or a recommendation to buy, sell, deposit, or withdraw any asset. No paid promotion or referral/affiliate links.
100
·
--
Haussier
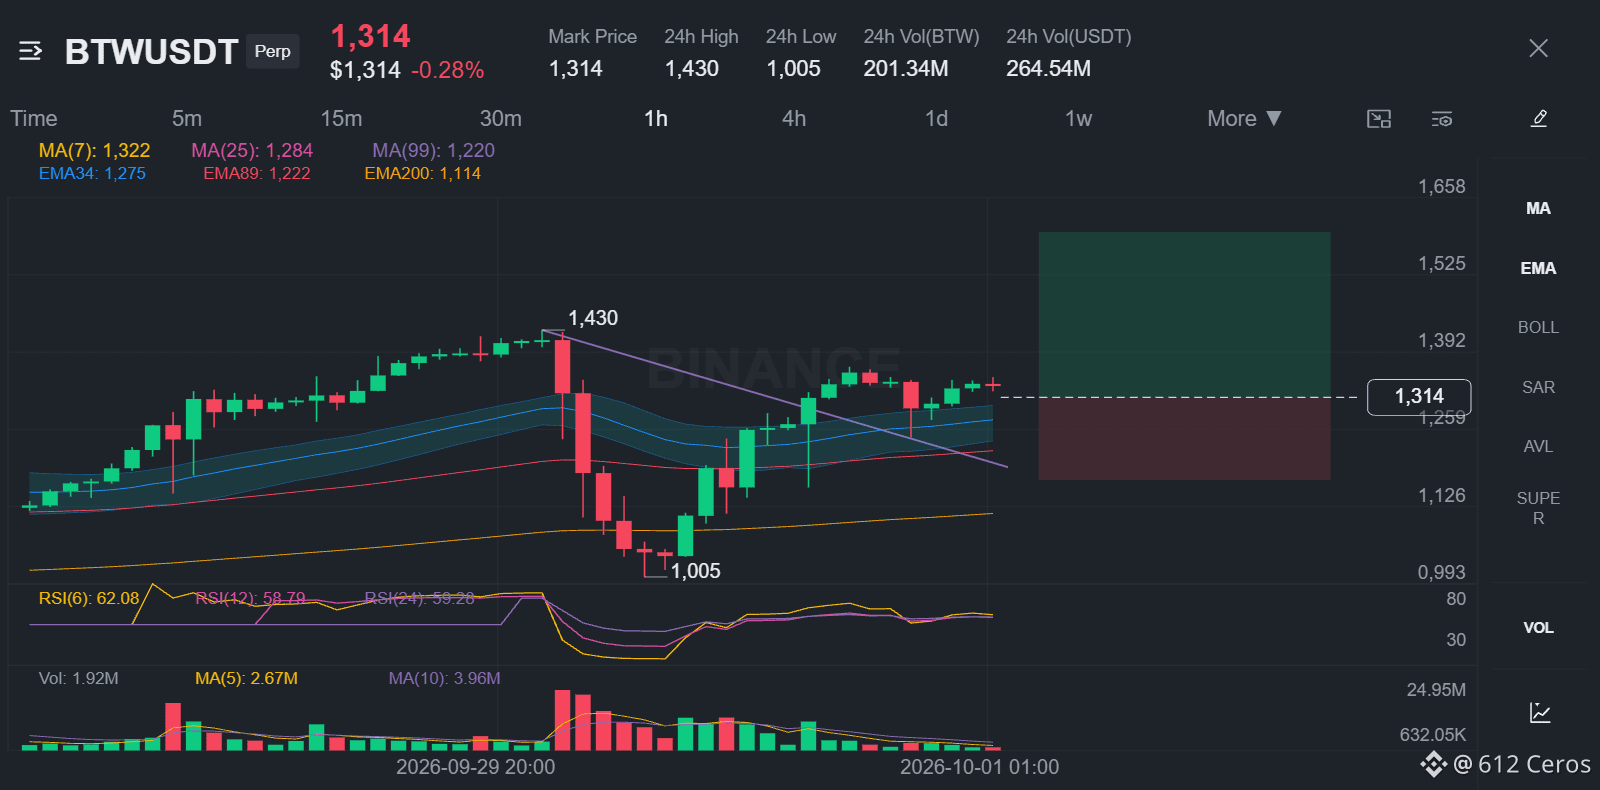
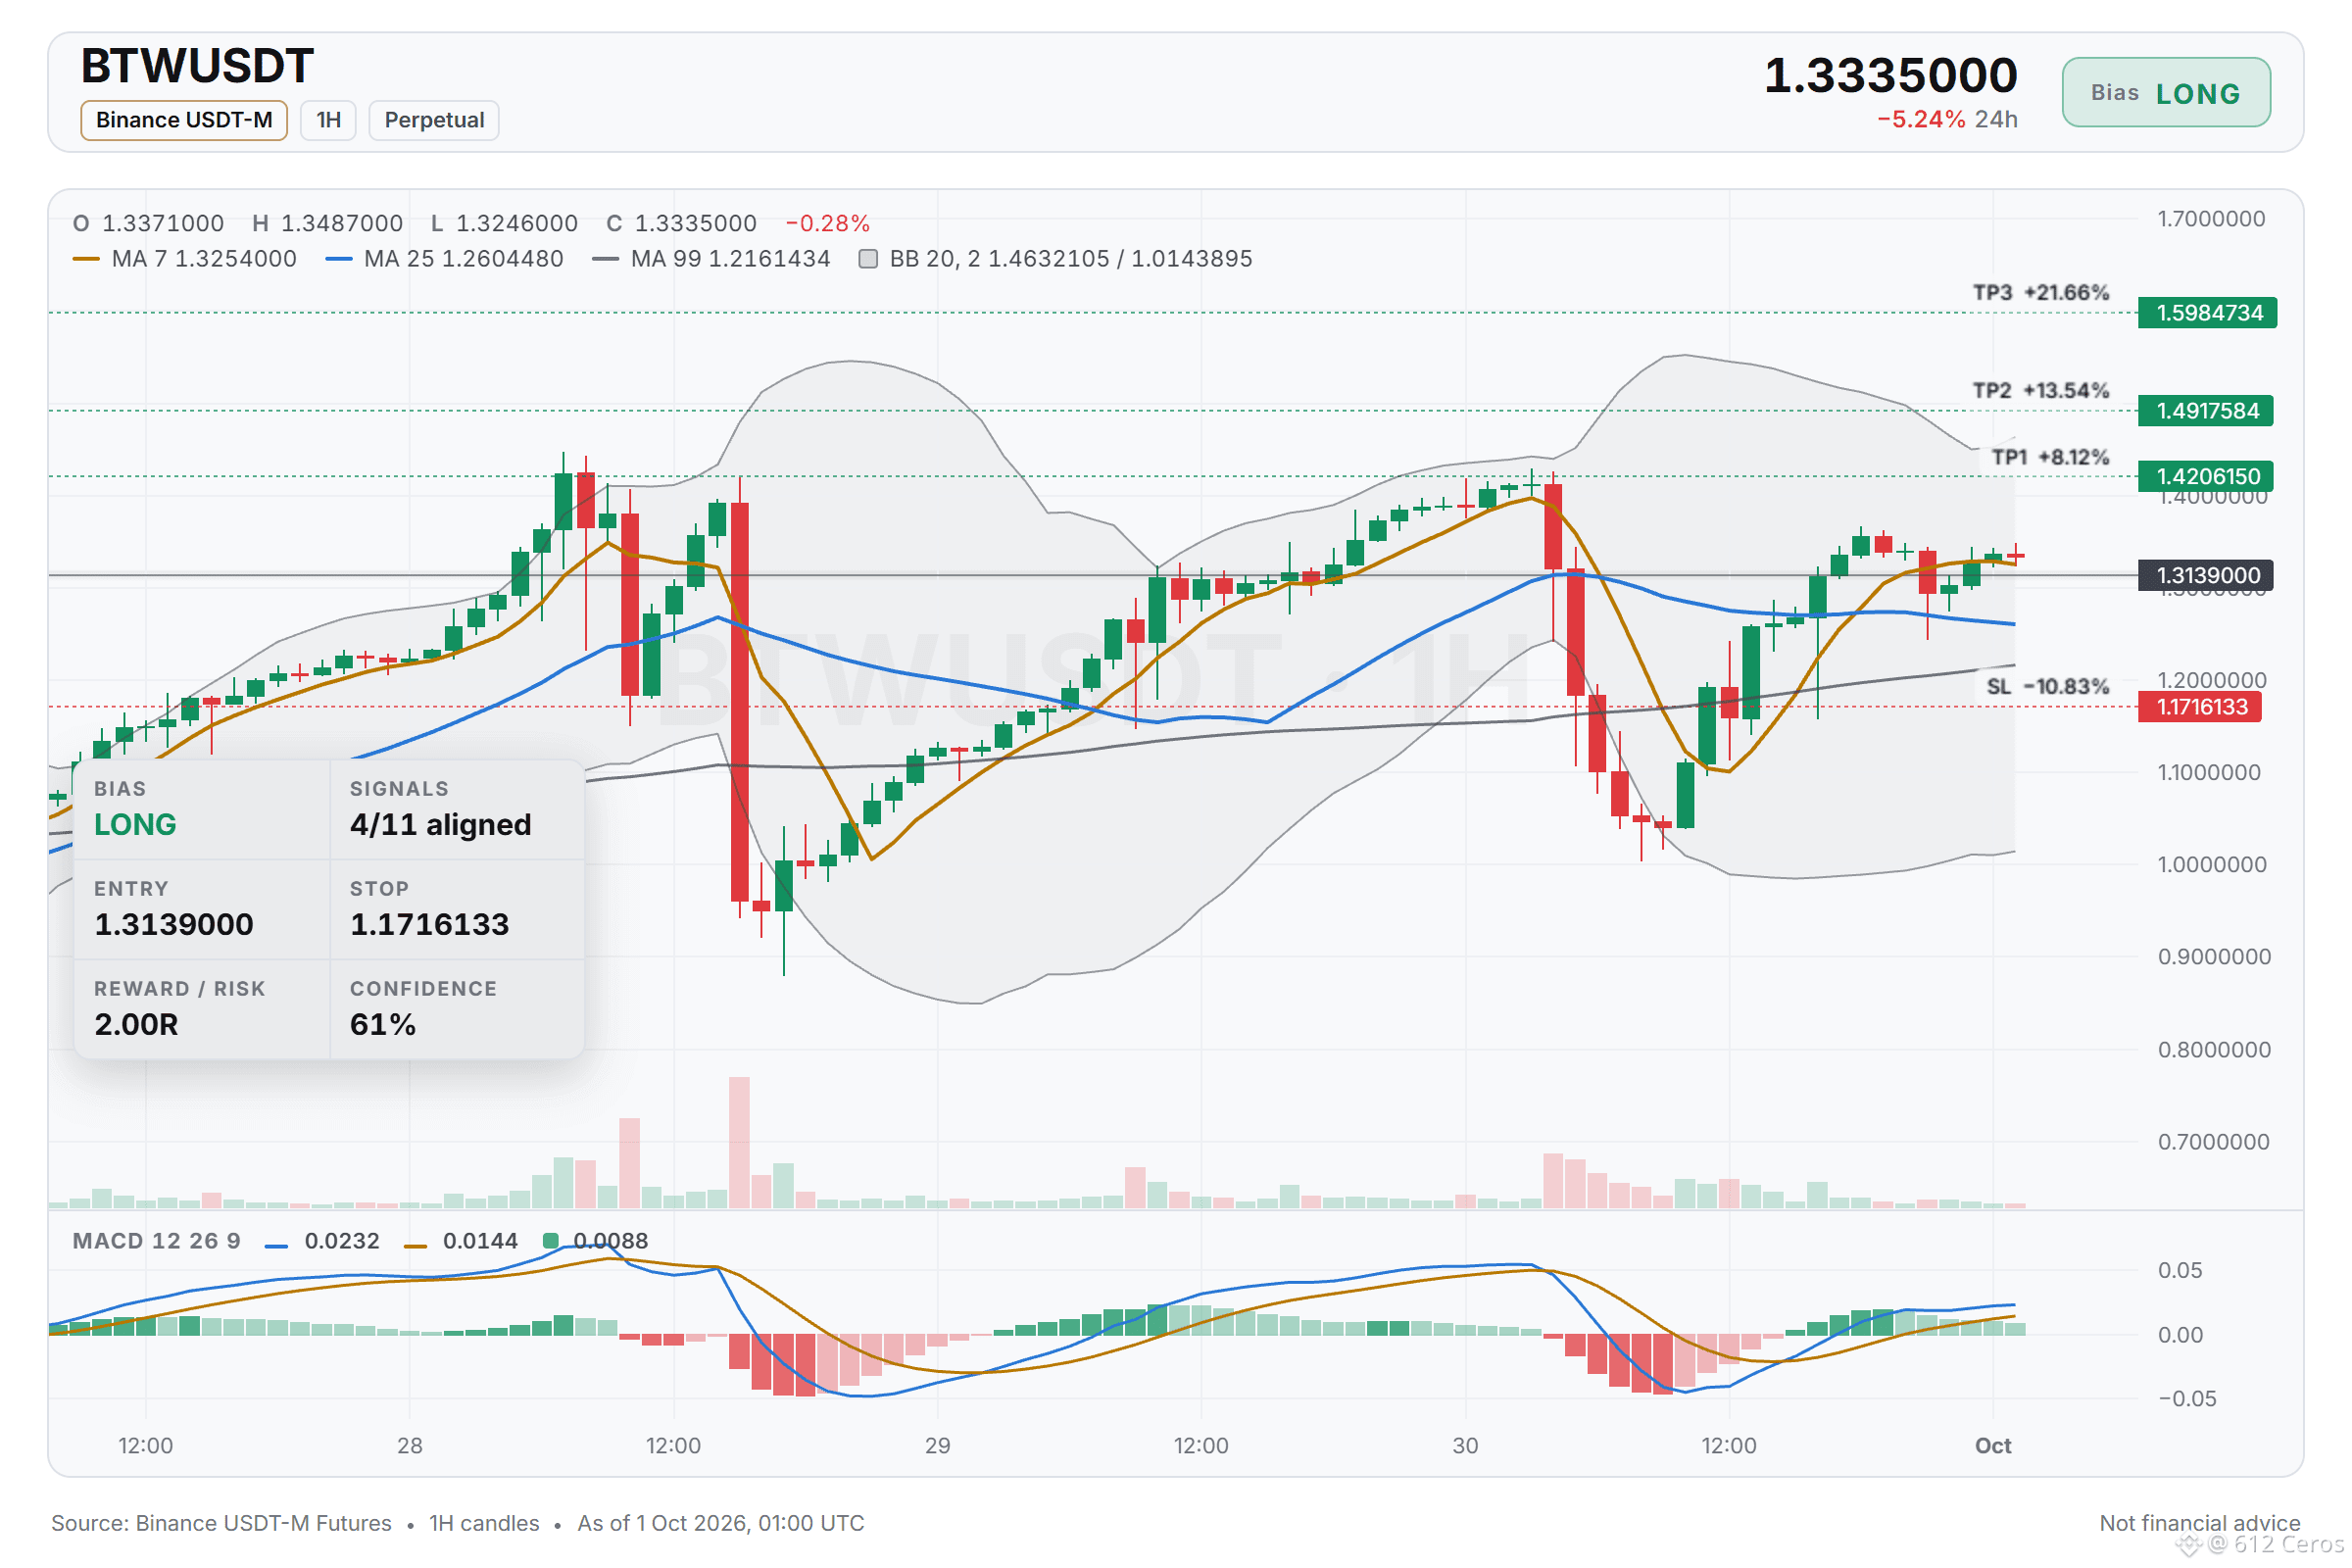
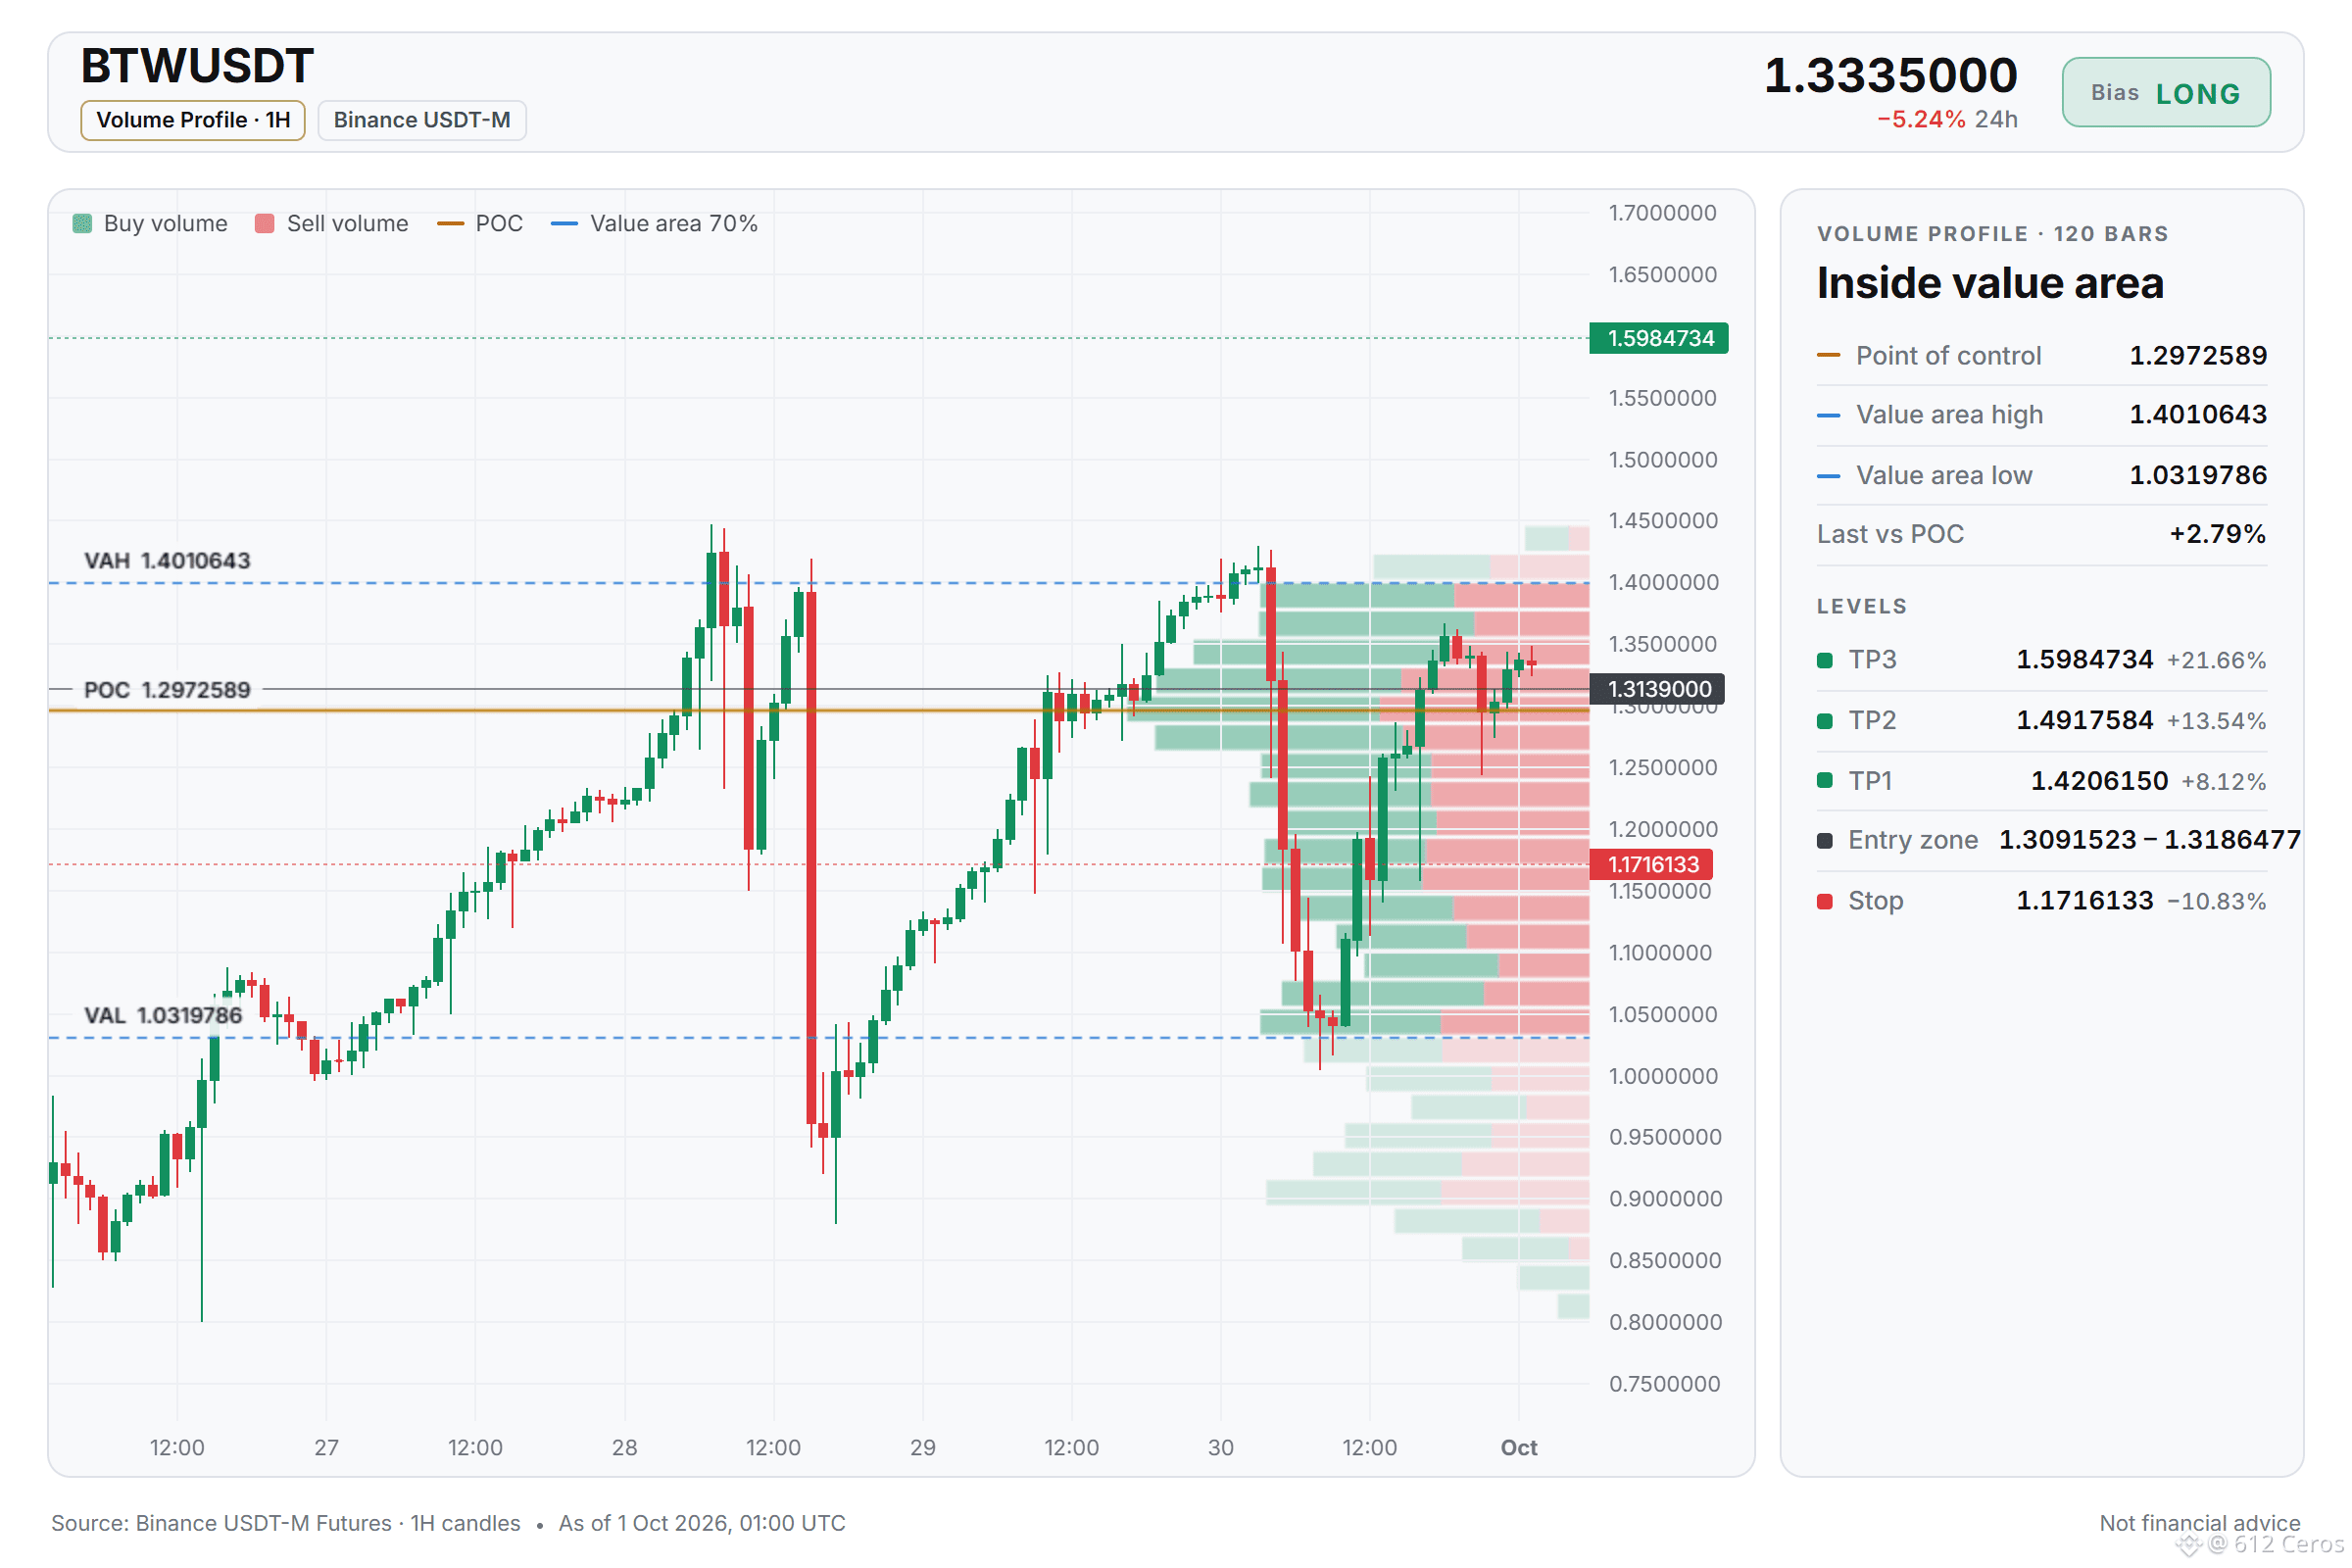
BTW breaking above the range on 4h
🟢 LONG $BTW /USDT: expecting price to go UP
Bias: LONG · Leaning
📍 Entry: 1.3091523 – 1.3186477
🎯 TP1: 1.4206150 (+8.1%)
🎯 TP2: 1.4917584 (+13.5%)
🎯 TP3: 1.5984734 (+21.7%)
🛑 SL: 1.1716133 (-10.8%)
💡 Enter only inside the zone. Take half at TP1, then move the stop to entry.
⚠️ Moderate conviction only. Keep size light.
Why LONG? BTW checklist: 4/11 signals agree, 2 against, 5 undecided
✔️ 4h trend: price > EMA50 > EMA200, bullish stack → the swing trend is up
✔️ 1h trend: price > EMA50 > EMA200, bullish stack → the short-term trend is up
✔️ 4h RSI: 55.9, bullish momentum (above 55) → buyers have the momentum
👀 Short-term momentum (15m): RSI z-score −1.20, last candle −1.40%, sellers pressing → sellers are pushing right now
👀 The idea is wrong if price reaches the stop at 1.1716133
Net read: 4h trend and momentum lean bullish, but 15m RSI shows sellers pressing now, so conviction is moderate.
If you were in, would you hold through the 15m dip or take profit at the 1h close?
Full setup on the chart 👇
{future}(BTWUSDT)
📲 Want more of my latest signals? Join me here:
[https://app.binance.com/uni-qr/D26WbL9t](https://app.binance.com/uni-qr/D26WbL9t)
⚠️ Personal market analysis only. NFA — manage risk and DYOR.
Educational content, not investment advice or a recommendation to buy, sell, deposit, or withdraw any asset. No paid promotion or referral/affiliate links.
BTW breaking above the range on 4h
🟢 LONG $BTW /USDT: expecting price to go UP
Bias: LONG · Leaning
📍 Entry: 1.3091523 – 1.3186477
🎯 TP1: 1.4206150 (+8.1%)
🎯 TP2: 1.4917584 (+13.5%)
🎯 TP3: 1.5984734 (+21.7%)
🛑 SL: 1.1716133 (-10.8%)
💡 Enter only inside the zone. Take half at TP1, then move the stop to entry.
⚠️ Moderate conviction only. Keep size light.
Why LONG? BTW checklist: 4/11 signals agree, 2 against, 5 undecided
✔️ 4h trend: price > EMA50 > EMA200, bullish stack → the swing trend is up
✔️ 1h trend: price > EMA50 > EMA200, bullish stack → the short-term trend is up
✔️ 4h RSI: 55.9, bullish momentum (above 55) → buyers have the momentum
👀 Short-term momentum (15m): RSI z-score −1.20, last candle −1.40%, sellers pressing → sellers are pushing right now
👀 The idea is wrong if price reaches the stop at 1.1716133
Net read: 4h trend and momentum lean bullish, but 15m RSI shows sellers pressing now, so conviction is moderate.
If you were in, would you hold through the 15m dip or take profit at the 1h close?
Full setup on the chart 👇
📲 Want more of my latest signals? Join me here:
https://app.binance.com/uni-qr/D26WbL9t
⚠️ Personal market analysis only. NFA — manage risk and DYOR.
Educational content, not investment advice or a recommendation to buy, sell, deposit, or withdraw any asset. No paid promotion or referral/affiliate links.
🟢 LONG $BTW /USDT: expecting price to go UP
Bias: LONG · Leaning
📍 Entry: 1.3091523 – 1.3186477
🎯 TP1: 1.4206150 (+8.1%)
🎯 TP2: 1.4917584 (+13.5%)
🎯 TP3: 1.5984734 (+21.7%)
🛑 SL: 1.1716133 (-10.8%)
💡 Enter only inside the zone. Take half at TP1, then move the stop to entry.
⚠️ Moderate conviction only. Keep size light.
Why LONG? BTW checklist: 4/11 signals agree, 2 against, 5 undecided
✔️ 4h trend: price > EMA50 > EMA200, bullish stack → the swing trend is up
✔️ 1h trend: price > EMA50 > EMA200, bullish stack → the short-term trend is up
✔️ 4h RSI: 55.9, bullish momentum (above 55) → buyers have the momentum
👀 Short-term momentum (15m): RSI z-score −1.20, last candle −1.40%, sellers pressing → sellers are pushing right now
👀 The idea is wrong if price reaches the stop at 1.1716133
Net read: 4h trend and momentum lean bullish, but 15m RSI shows sellers pressing now, so conviction is moderate.
If you were in, would you hold through the 15m dip or take profit at the 1h close?
Full setup on the chart 👇
📲 Want more of my latest signals? Join me here:
https://app.binance.com/uni-qr/D26WbL9t
⚠️ Personal market analysis only. NFA — manage risk and DYOR.
Educational content, not investment advice or a recommendation to buy, sell, deposit, or withdraw any asset. No paid promotion or referral/affiliate links.
583
·
--
Haussier
WIF is leaning long while the daily trend stays bullish
🟢 LONG $WIF /USDT: expecting price to go UP
Bias: LONG · Leaning
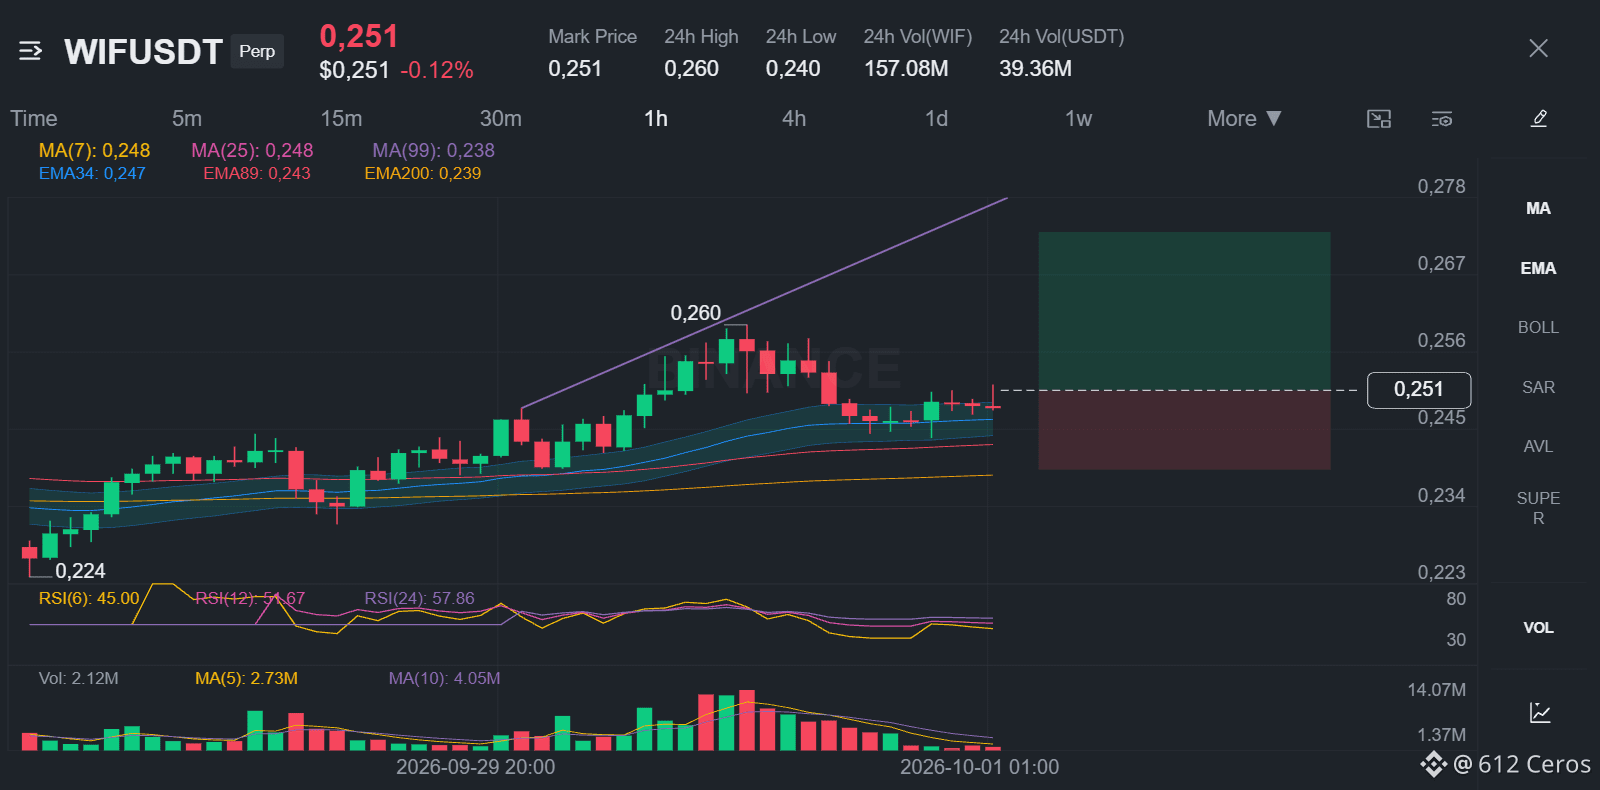
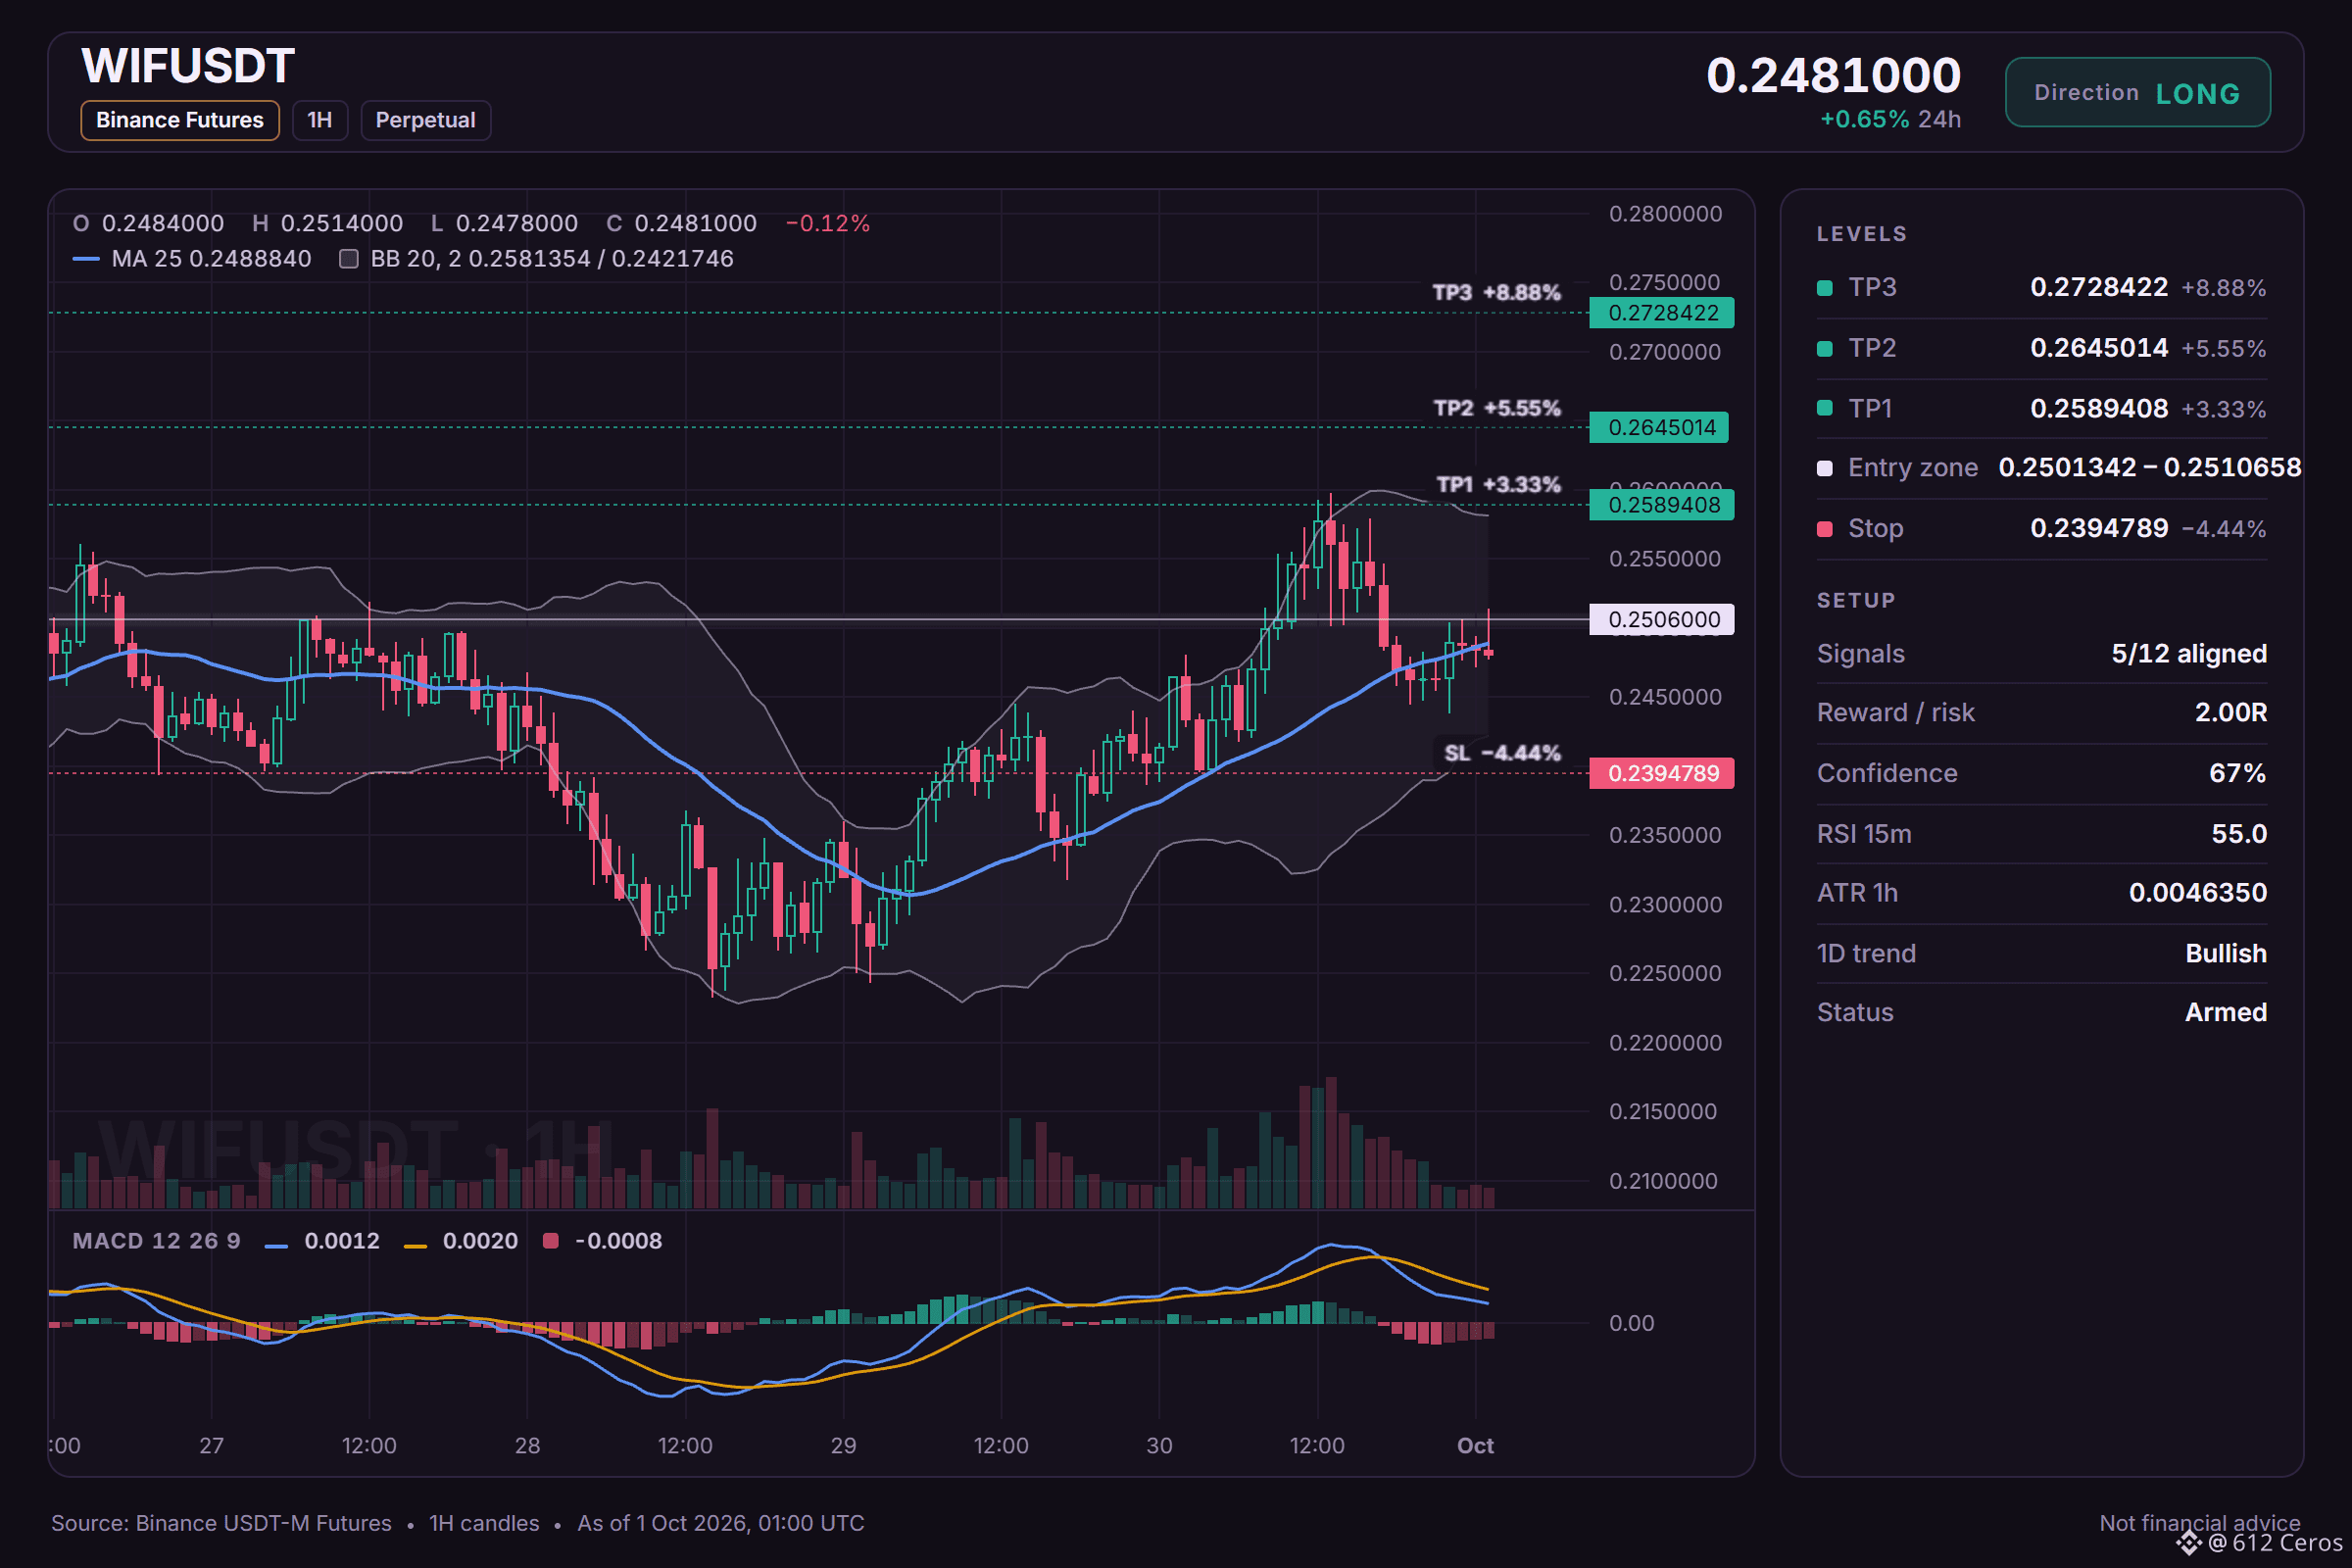
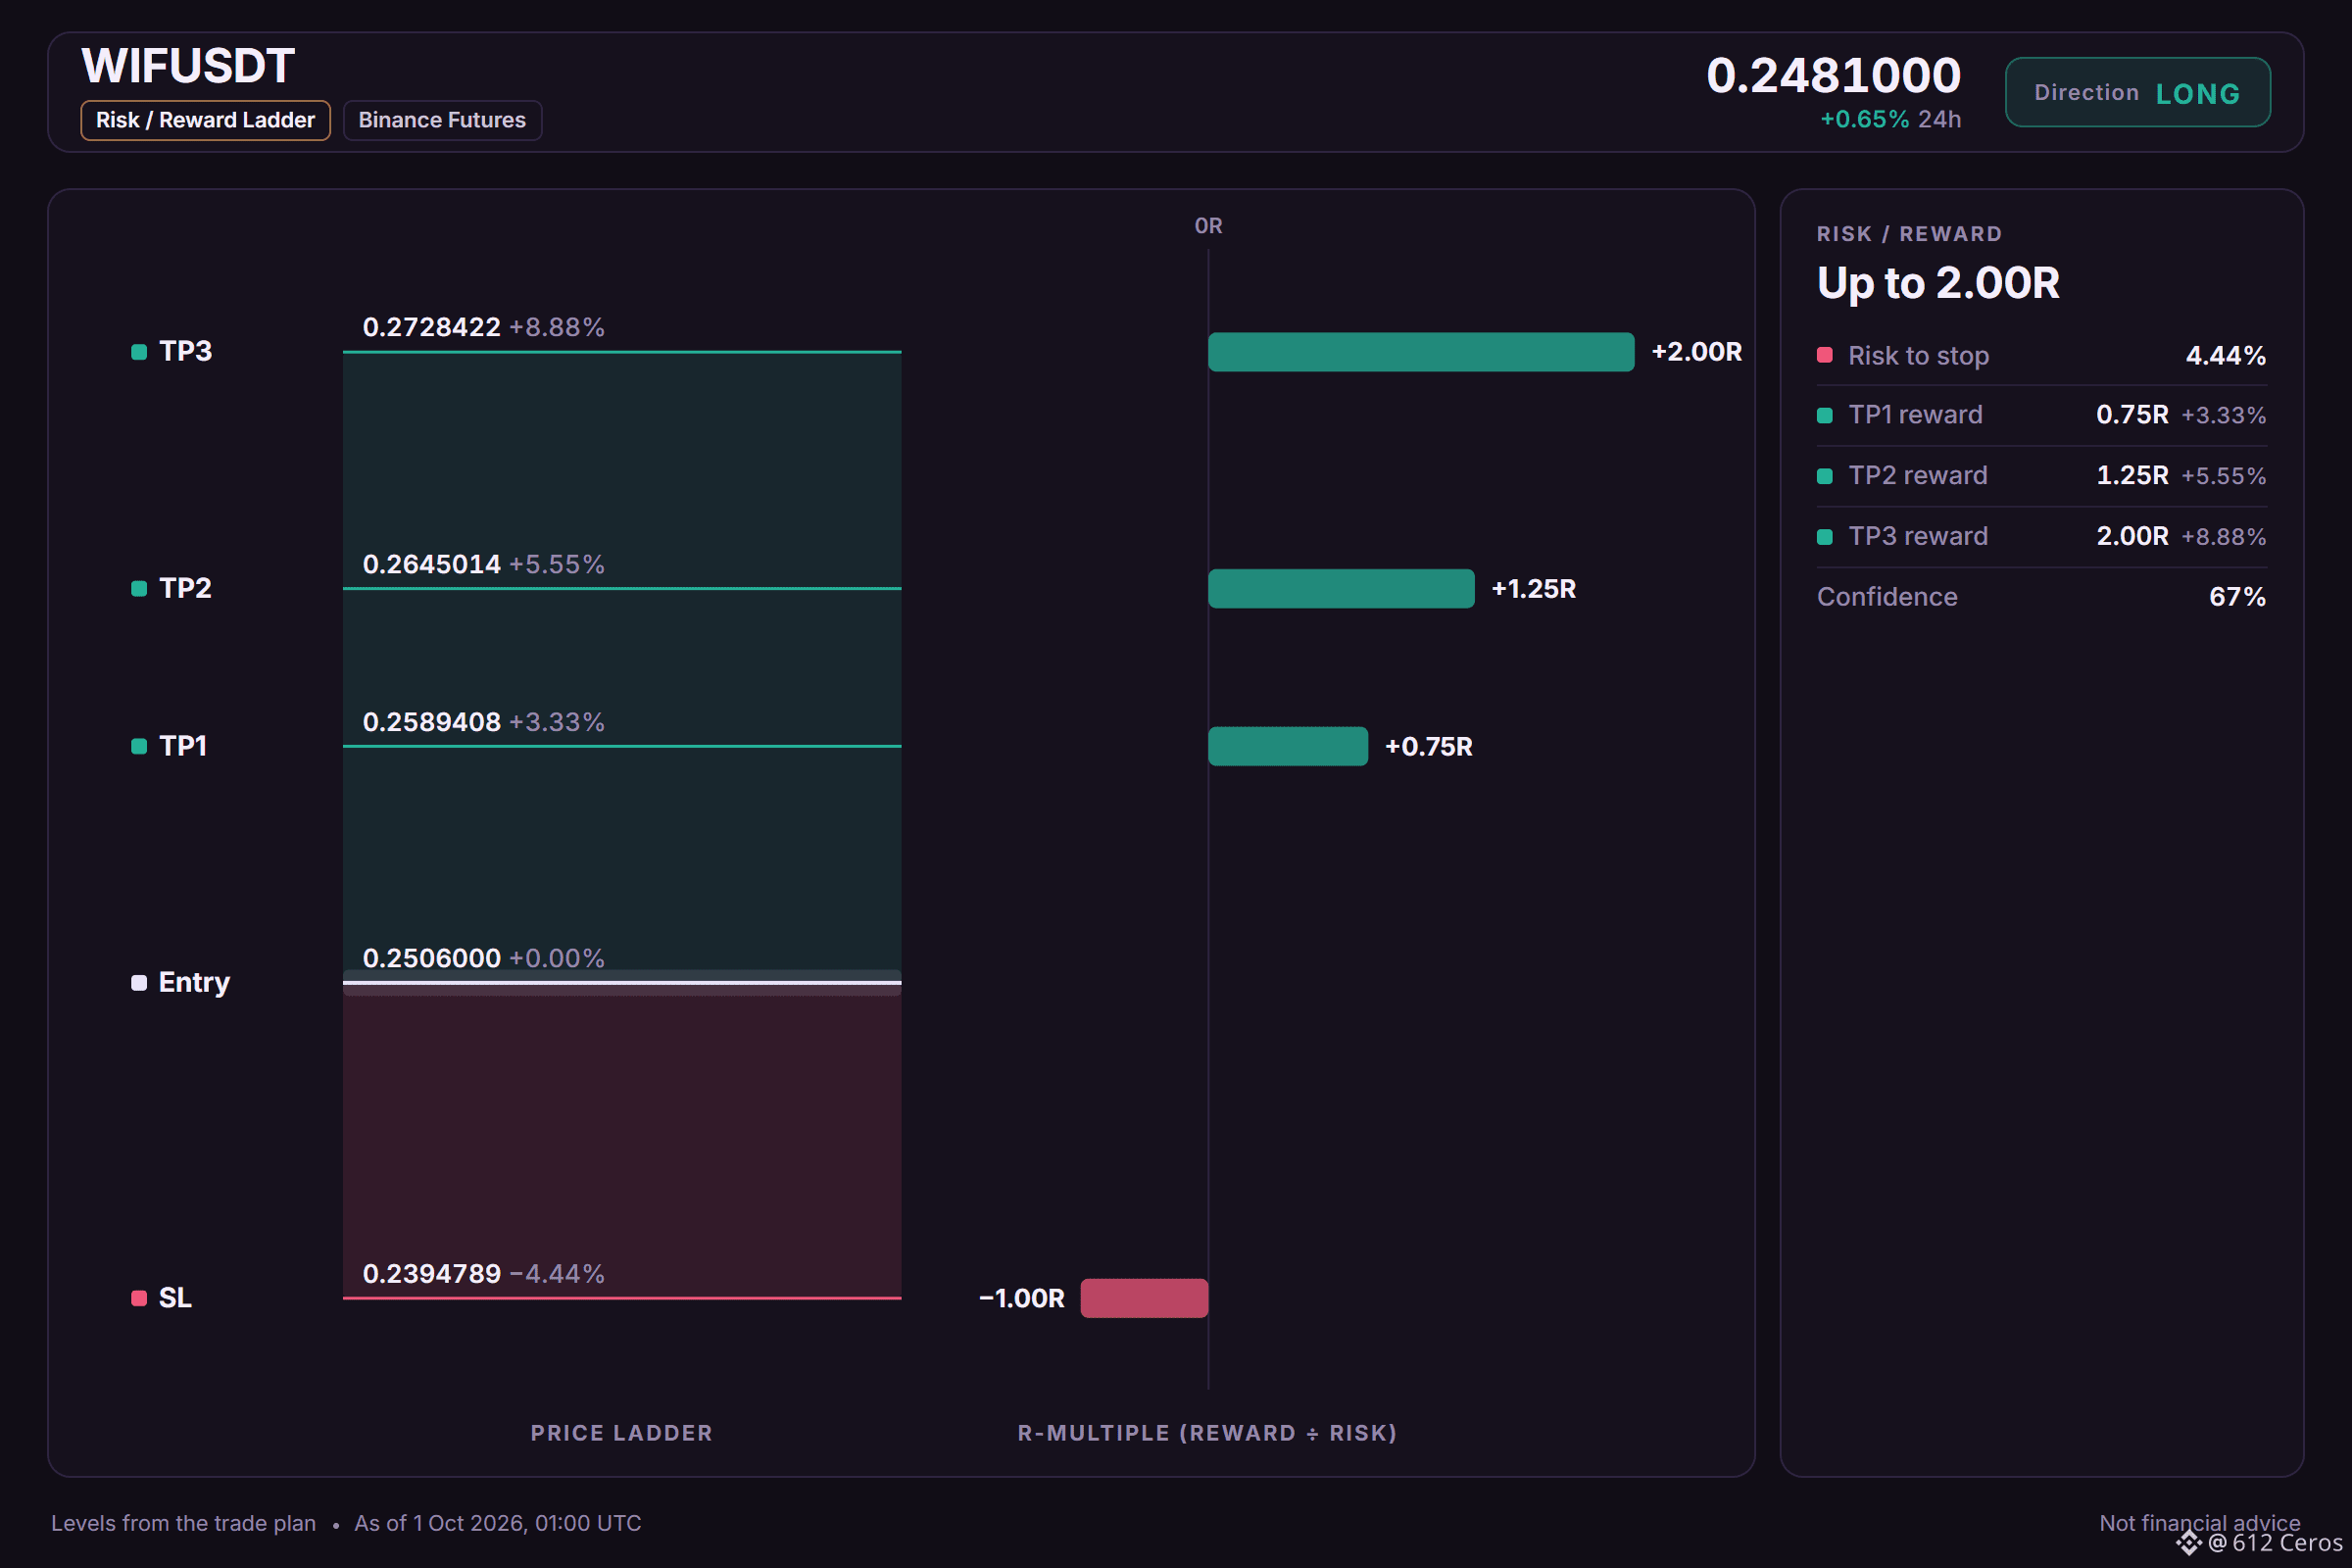
📍 Entry: 0.2501342 – 0.2510658
🎯 TP1: 0.2589408 (+3.3%)
🎯 TP2: 0.2645014 (+5.5%)
🎯 TP3: 0.2728422 (+8.9%)
🛑 SL: 0.2394789 (-4.4%)
💡 Enter only inside the zone. Take half at TP1, then move the stop to entry.
⚠️ Moderate conviction only. Keep size light.
Why LONG? Leaning call, 5/12 signals agree, 1 against, 6 undecided.
✅ Daily trend: price > EMA50 > EMA200, bullish stack → the big-picture trend is up
✅ 4h trend: price > EMA50 > EMA200, bullish stack → the swing trend is up
✅ 1h trend: price > EMA50 > EMA200, bullish stack → the short-term trend is up
⚠️ BTC backdrop: BTC trend is bearish and correlation is 0.64 → BTC is falling and this coin tends to follow
In plain words:
The 1h price sits above its EMA50 and EMA200, and the 4h does the same, so the short-term and swing trends point up. The daily trend is bullish with price above both moving averages, and the 4h RSI is at 56.5, showing buyers have the momentum. However, BTC is trending down and this coin correlates at 0.64, so a sharp BTC drop could spill over.
Where would you place your invalidation if you were shorting this setup instead?
Full setup on the chart 👇
{future}(WIFUSDT)
📲 Want more of my latest signals? Join me here:
[https://app.binance.com/uni-qr/D26WbL9t](https://app.binance.com/uni-qr/D26WbL9t)
⚠️ Personal market analysis only. NFA — manage risk and DYOR.
Educational content, not investment advice or a recommendation to buy, sell, deposit, or withdraw any asset. No paid promotion or referral/affiliate links.
WIF is leaning long while the daily trend stays bullish
🟢 LONG $WIF /USDT: expecting price to go UP
Bias: LONG · Leaning
📍 Entry: 0.2501342 – 0.2510658
🎯 TP1: 0.2589408 (+3.3%)
🎯 TP2: 0.2645014 (+5.5%)
🎯 TP3: 0.2728422 (+8.9%)
🛑 SL: 0.2394789 (-4.4%)
💡 Enter only inside the zone. Take half at TP1, then move the stop to entry.
⚠️ Moderate conviction only. Keep size light.
Why LONG? Leaning call, 5/12 signals agree, 1 against, 6 undecided.
✅ Daily trend: price > EMA50 > EMA200, bullish stack → the big-picture trend is up
✅ 4h trend: price > EMA50 > EMA200, bullish stack → the swing trend is up
✅ 1h trend: price > EMA50 > EMA200, bullish stack → the short-term trend is up
⚠️ BTC backdrop: BTC trend is bearish and correlation is 0.64 → BTC is falling and this coin tends to follow
In plain words:
The 1h price sits above its EMA50 and EMA200, and the 4h does the same, so the short-term and swing trends point up. The daily trend is bullish with price above both moving averages, and the 4h RSI is at 56.5, showing buyers have the momentum. However, BTC is trending down and this coin correlates at 0.64, so a sharp BTC drop could spill over.
Where would you place your invalidation if you were shorting this setup instead?
Full setup on the chart 👇
📲 Want more of my latest signals? Join me here:
https://app.binance.com/uni-qr/D26WbL9t
⚠️ Personal market analysis only. NFA — manage risk and DYOR.
Educational content, not investment advice or a recommendation to buy, sell, deposit, or withdraw any asset. No paid promotion or referral/affiliate links.
🟢 LONG $WIF /USDT: expecting price to go UP
Bias: LONG · Leaning
📍 Entry: 0.2501342 – 0.2510658
🎯 TP1: 0.2589408 (+3.3%)
🎯 TP2: 0.2645014 (+5.5%)
🎯 TP3: 0.2728422 (+8.9%)
🛑 SL: 0.2394789 (-4.4%)
💡 Enter only inside the zone. Take half at TP1, then move the stop to entry.
⚠️ Moderate conviction only. Keep size light.
Why LONG? Leaning call, 5/12 signals agree, 1 against, 6 undecided.
✅ Daily trend: price > EMA50 > EMA200, bullish stack → the big-picture trend is up
✅ 4h trend: price > EMA50 > EMA200, bullish stack → the swing trend is up
✅ 1h trend: price > EMA50 > EMA200, bullish stack → the short-term trend is up
⚠️ BTC backdrop: BTC trend is bearish and correlation is 0.64 → BTC is falling and this coin tends to follow
In plain words:
The 1h price sits above its EMA50 and EMA200, and the 4h does the same, so the short-term and swing trends point up. The daily trend is bullish with price above both moving averages, and the 4h RSI is at 56.5, showing buyers have the momentum. However, BTC is trending down and this coin correlates at 0.64, so a sharp BTC drop could spill over.
Where would you place your invalidation if you were shorting this setup instead?
Full setup on the chart 👇
📲 Want more of my latest signals? Join me here:
https://app.binance.com/uni-qr/D26WbL9t
⚠️ Personal market analysis only. NFA — manage risk and DYOR.
Educational content, not investment advice or a recommendation to buy, sell, deposit, or withdraw any asset. No paid promotion or referral/affiliate links.
406
·
--
Baissier
USELESS is pressing a short on the 4h against the trend
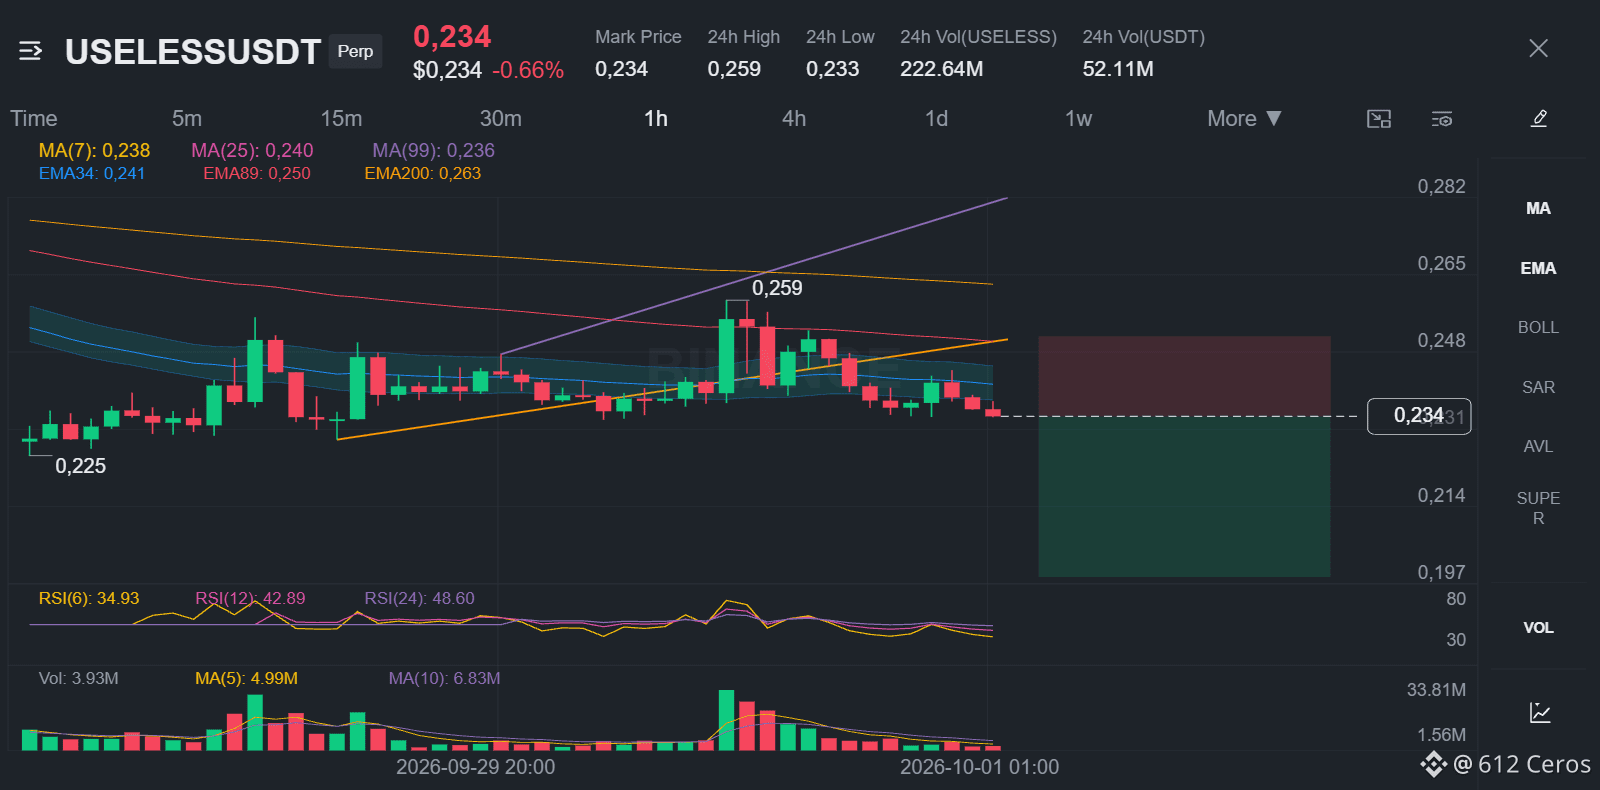
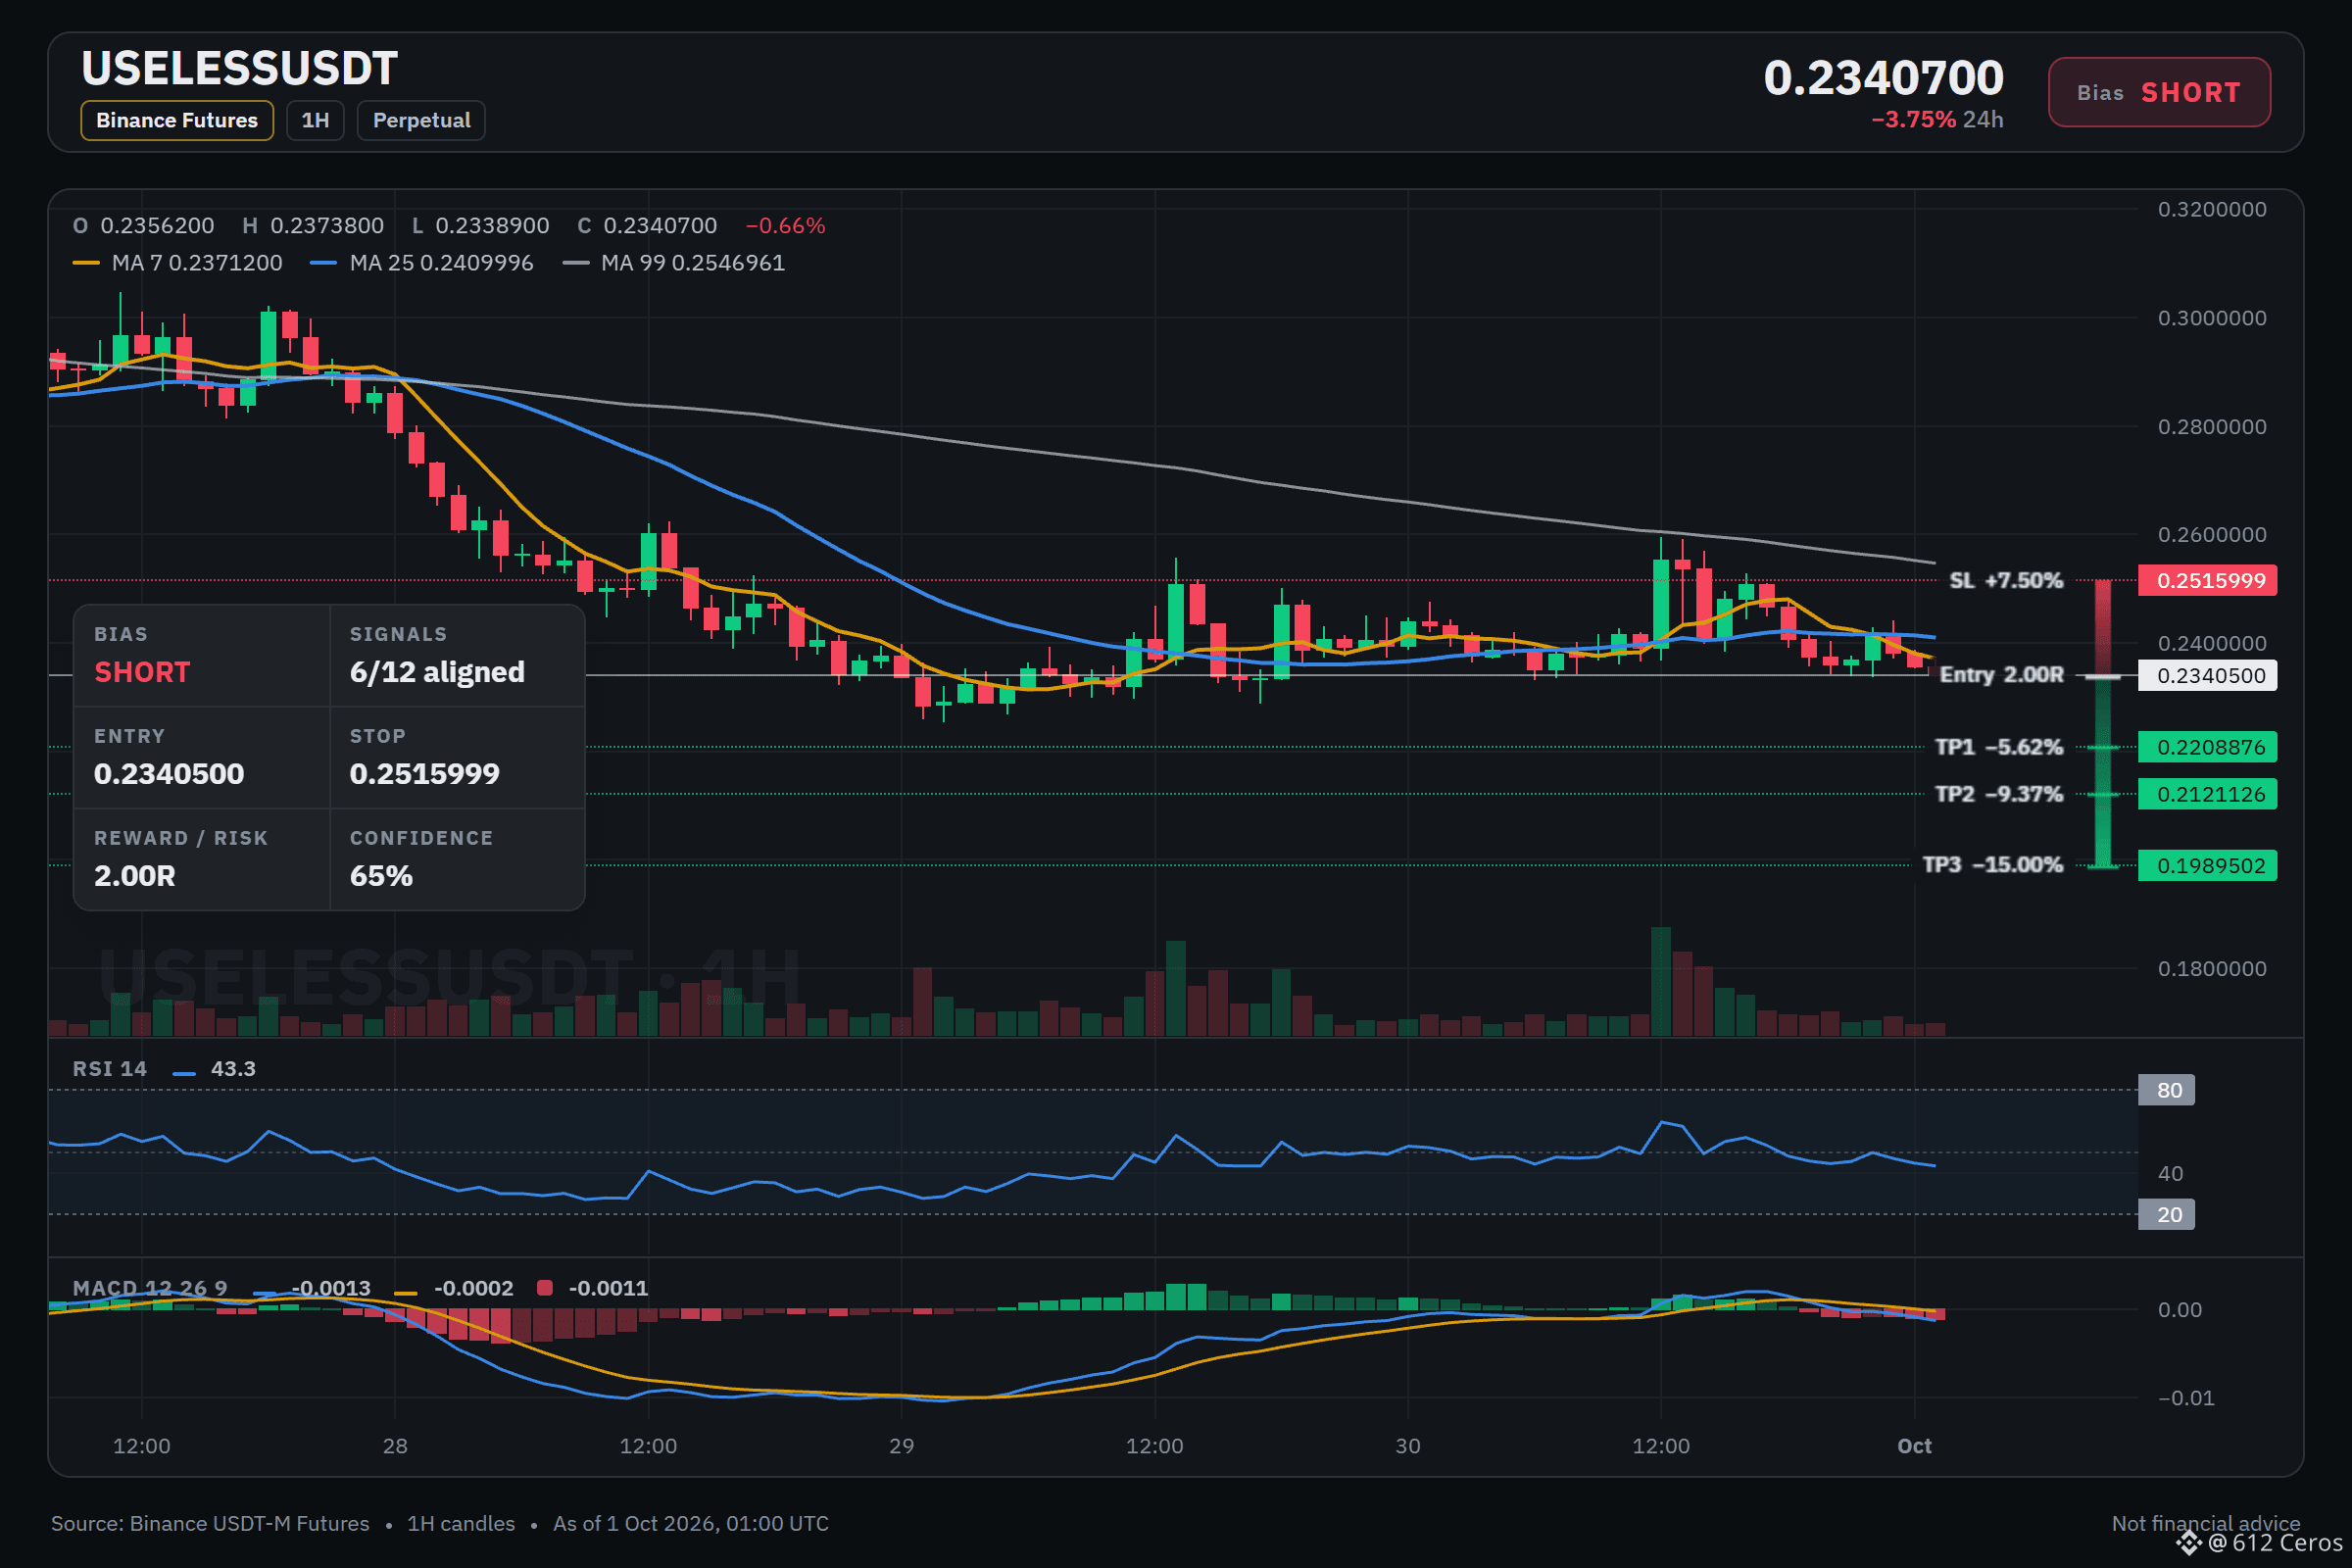
🔴 SHORT $USELESS /USDT: expecting price to go DOWN
Bias: SHORT · Leaning
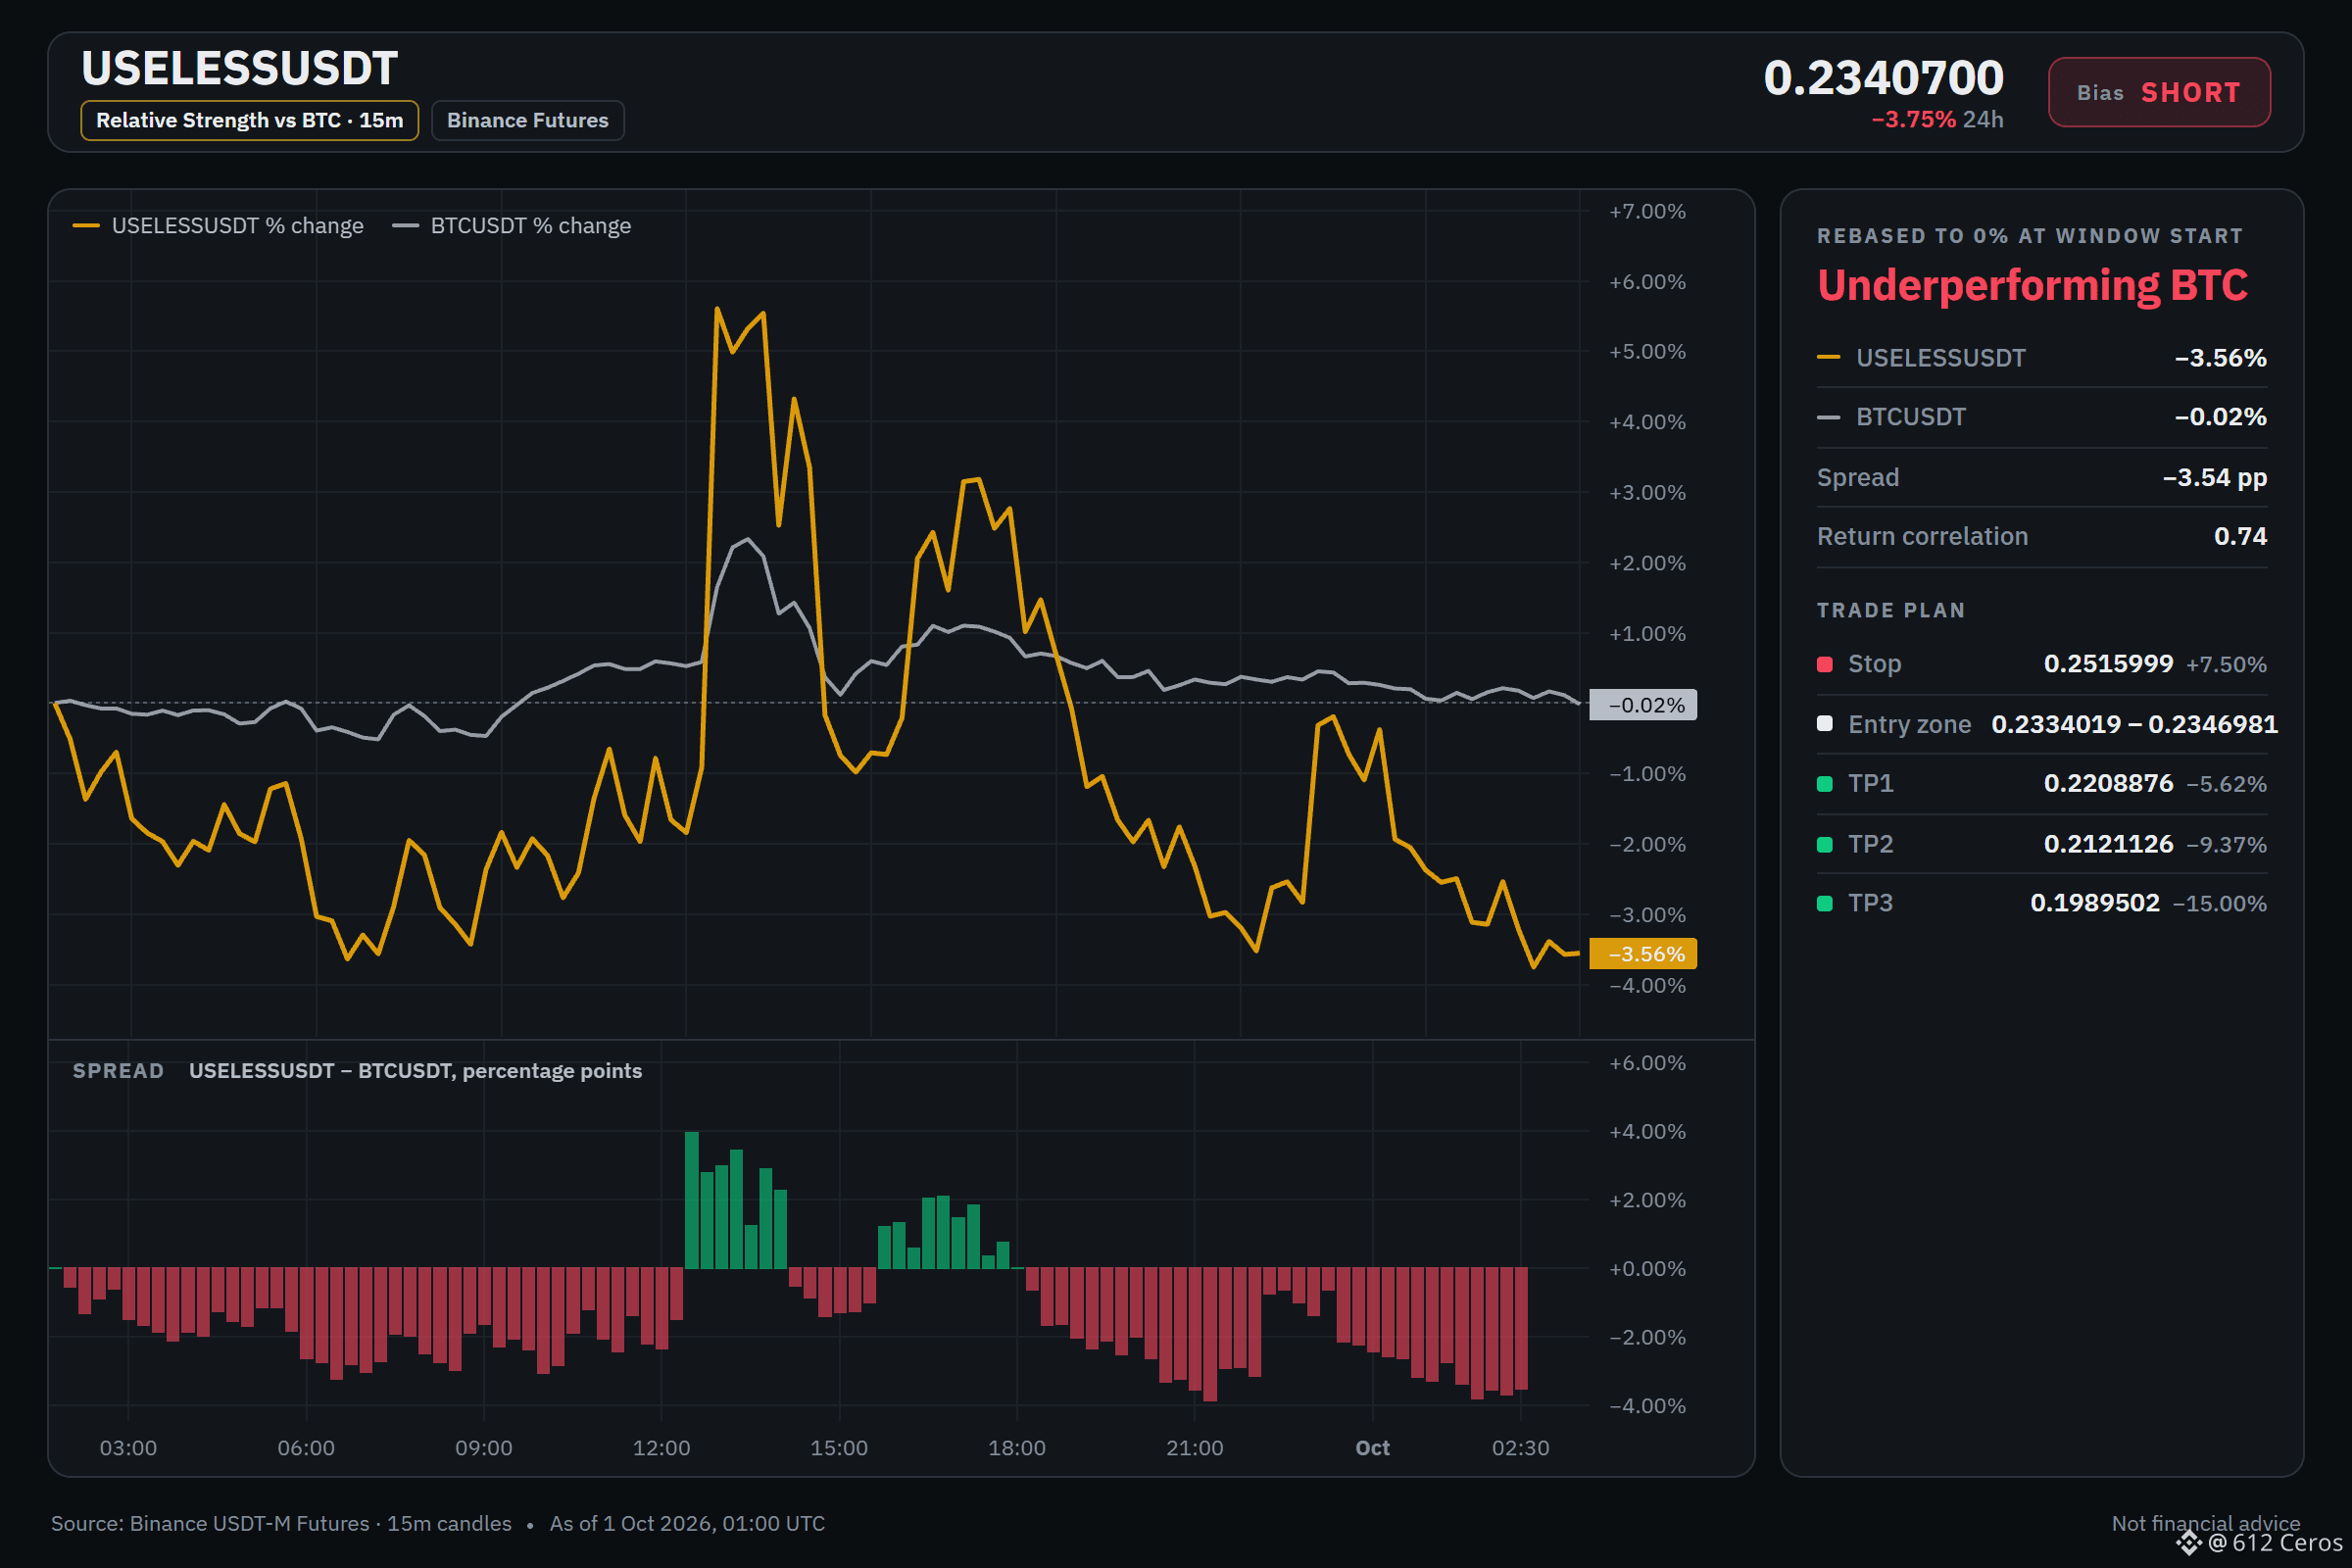
📍 Entry: 0.2334019 – 0.2346981
🎯 TP1: 0.2208876 (-5.6%)
🎯 TP2: 0.2121126 (-9.4%)
🎯 TP3: 0.1989502 (-15.0%)
🛑 SL: 0.2515999 (+7.5%)
💡 Enter only inside the zone. Take half at TP1, then move the stop to entry.
⚠️ Counter-trend idea backed by 6 signals only. Smaller size, hard stop.
Why SHORT? Leaning call, 6/12 signals agree, 1 against, 5 undecided.
✅ 1h trend: price < EMA50 < EMA200, bearish stack → the short-term trend is down
✅ Trend strength (ADX/DI, 15m): ADX 22.5 with sellers in control (DI+ 12.2 vs DI− 20.6) → sellers are driving the move
✅ BTC backdrop: BTC trend is bearish and correlation is 0.76 → BTC is falling and this coin tends to follow
⚠️ Daily trend: price > EMA50 > EMA200, bullish stack → the big-picture trend is up
Journal note: USELESS
I'm watching USELESS and I want to see a break below the 1h price at 0.2340500 before I add. I'm sizing small because the daily trend is bullish, so this is a counter-trend reversal bet and the invalidation is at 0.2515999.
Where are you taking profit on this short, and is your stop tight enough?
Full setup on the chart 👇
{future}(USELESSUSDT)
📲 Want more of my latest signals? Join me here:
[https://app.binance.com/uni-qr/D26WbL9t](https://app.binance.com/uni-qr/D26WbL9t)
⚠️ Personal market analysis only. NFA — manage risk and DYOR.
Educational content, not investment advice or a recommendation to buy, sell, deposit, or withdraw any asset. No paid promotion or referral/affiliate links.
USELESS is pressing a short on the 4h against the trend
🔴 SHORT $USELESS /USDT: expecting price to go DOWN
Bias: SHORT · Leaning
📍 Entry: 0.2334019 – 0.2346981
🎯 TP1: 0.2208876 (-5.6%)
🎯 TP2: 0.2121126 (-9.4%)
🎯 TP3: 0.1989502 (-15.0%)
🛑 SL: 0.2515999 (+7.5%)
💡 Enter only inside the zone. Take half at TP1, then move the stop to entry.
⚠️ Counter-trend idea backed by 6 signals only. Smaller size, hard stop.
Why SHORT? Leaning call, 6/12 signals agree, 1 against, 5 undecided.
✅ 1h trend: price < EMA50 < EMA200, bearish stack → the short-term trend is down
✅ Trend strength (ADX/DI, 15m): ADX 22.5 with sellers in control (DI+ 12.2 vs DI− 20.6) → sellers are driving the move
✅ BTC backdrop: BTC trend is bearish and correlation is 0.76 → BTC is falling and this coin tends to follow
⚠️ Daily trend: price > EMA50 > EMA200, bullish stack → the big-picture trend is up
Journal note: USELESS
I'm watching USELESS and I want to see a break below the 1h price at 0.2340500 before I add. I'm sizing small because the daily trend is bullish, so this is a counter-trend reversal bet and the invalidation is at 0.2515999.
Where are you taking profit on this short, and is your stop tight enough?
Full setup on the chart 👇
📲 Want more of my latest signals? Join me here:
https://app.binance.com/uni-qr/D26WbL9t
⚠️ Personal market analysis only. NFA — manage risk and DYOR.
Educational content, not investment advice or a recommendation to buy, sell, deposit, or withdraw any asset. No paid promotion or referral/affiliate links.
🔴 SHORT $USELESS /USDT: expecting price to go DOWN
Bias: SHORT · Leaning
📍 Entry: 0.2334019 – 0.2346981
🎯 TP1: 0.2208876 (-5.6%)
🎯 TP2: 0.2121126 (-9.4%)
🎯 TP3: 0.1989502 (-15.0%)
🛑 SL: 0.2515999 (+7.5%)
💡 Enter only inside the zone. Take half at TP1, then move the stop to entry.
⚠️ Counter-trend idea backed by 6 signals only. Smaller size, hard stop.
Why SHORT? Leaning call, 6/12 signals agree, 1 against, 5 undecided.
✅ 1h trend: price < EMA50 < EMA200, bearish stack → the short-term trend is down
✅ Trend strength (ADX/DI, 15m): ADX 22.5 with sellers in control (DI+ 12.2 vs DI− 20.6) → sellers are driving the move
✅ BTC backdrop: BTC trend is bearish and correlation is 0.76 → BTC is falling and this coin tends to follow
⚠️ Daily trend: price > EMA50 > EMA200, bullish stack → the big-picture trend is up
Journal note: USELESS
I'm watching USELESS and I want to see a break below the 1h price at 0.2340500 before I add. I'm sizing small because the daily trend is bullish, so this is a counter-trend reversal bet and the invalidation is at 0.2515999.
Where are you taking profit on this short, and is your stop tight enough?
Full setup on the chart 👇
📲 Want more of my latest signals? Join me here:
https://app.binance.com/uni-qr/D26WbL9t
⚠️ Personal market analysis only. NFA — manage risk and DYOR.
Educational content, not investment advice or a recommendation to buy, sell, deposit, or withdraw any asset. No paid promotion or referral/affiliate links.
2
626
·
--
Haussier
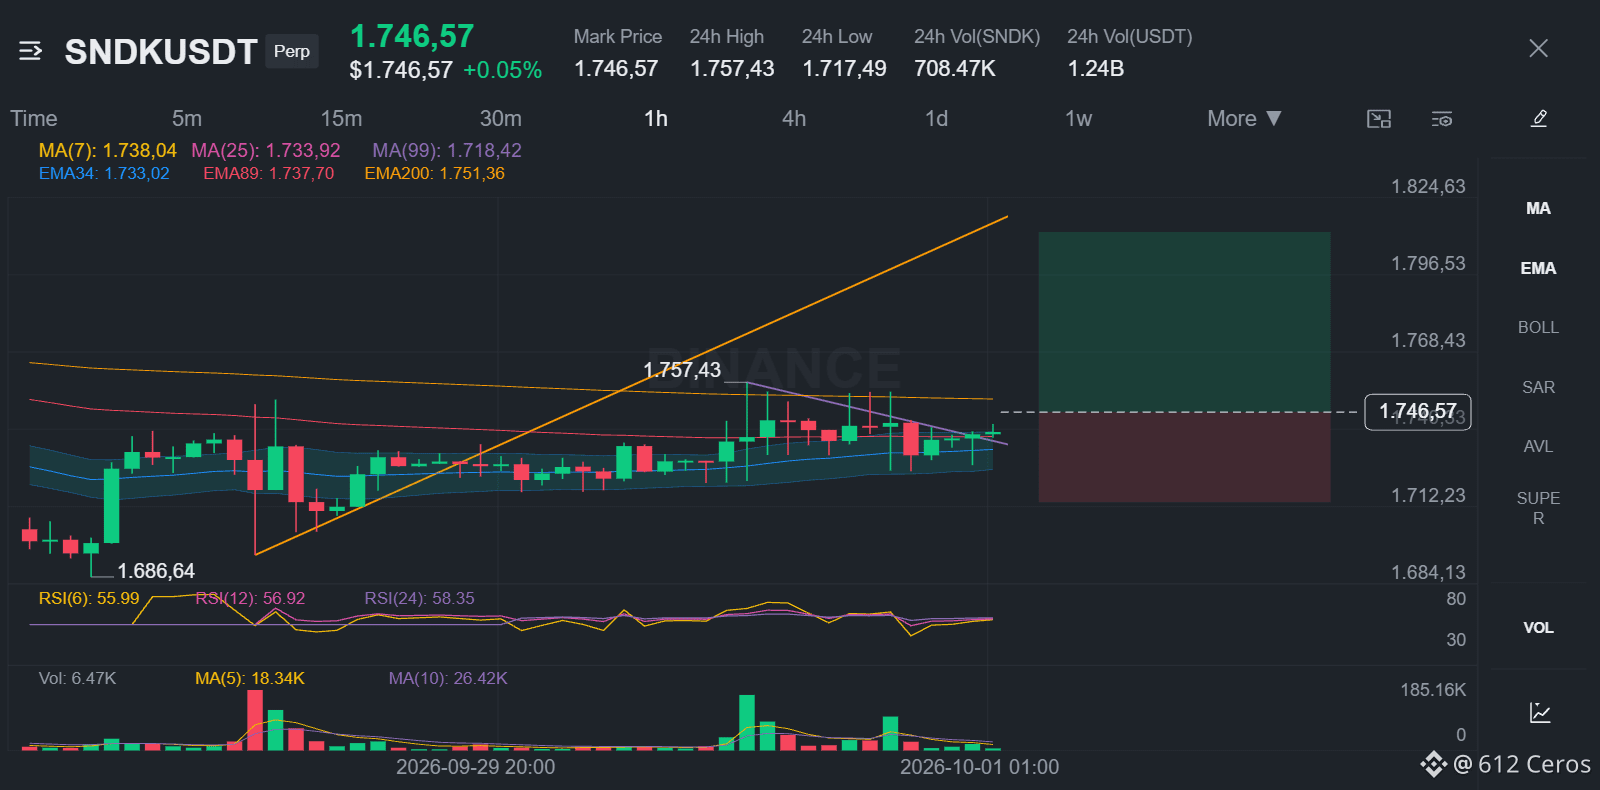
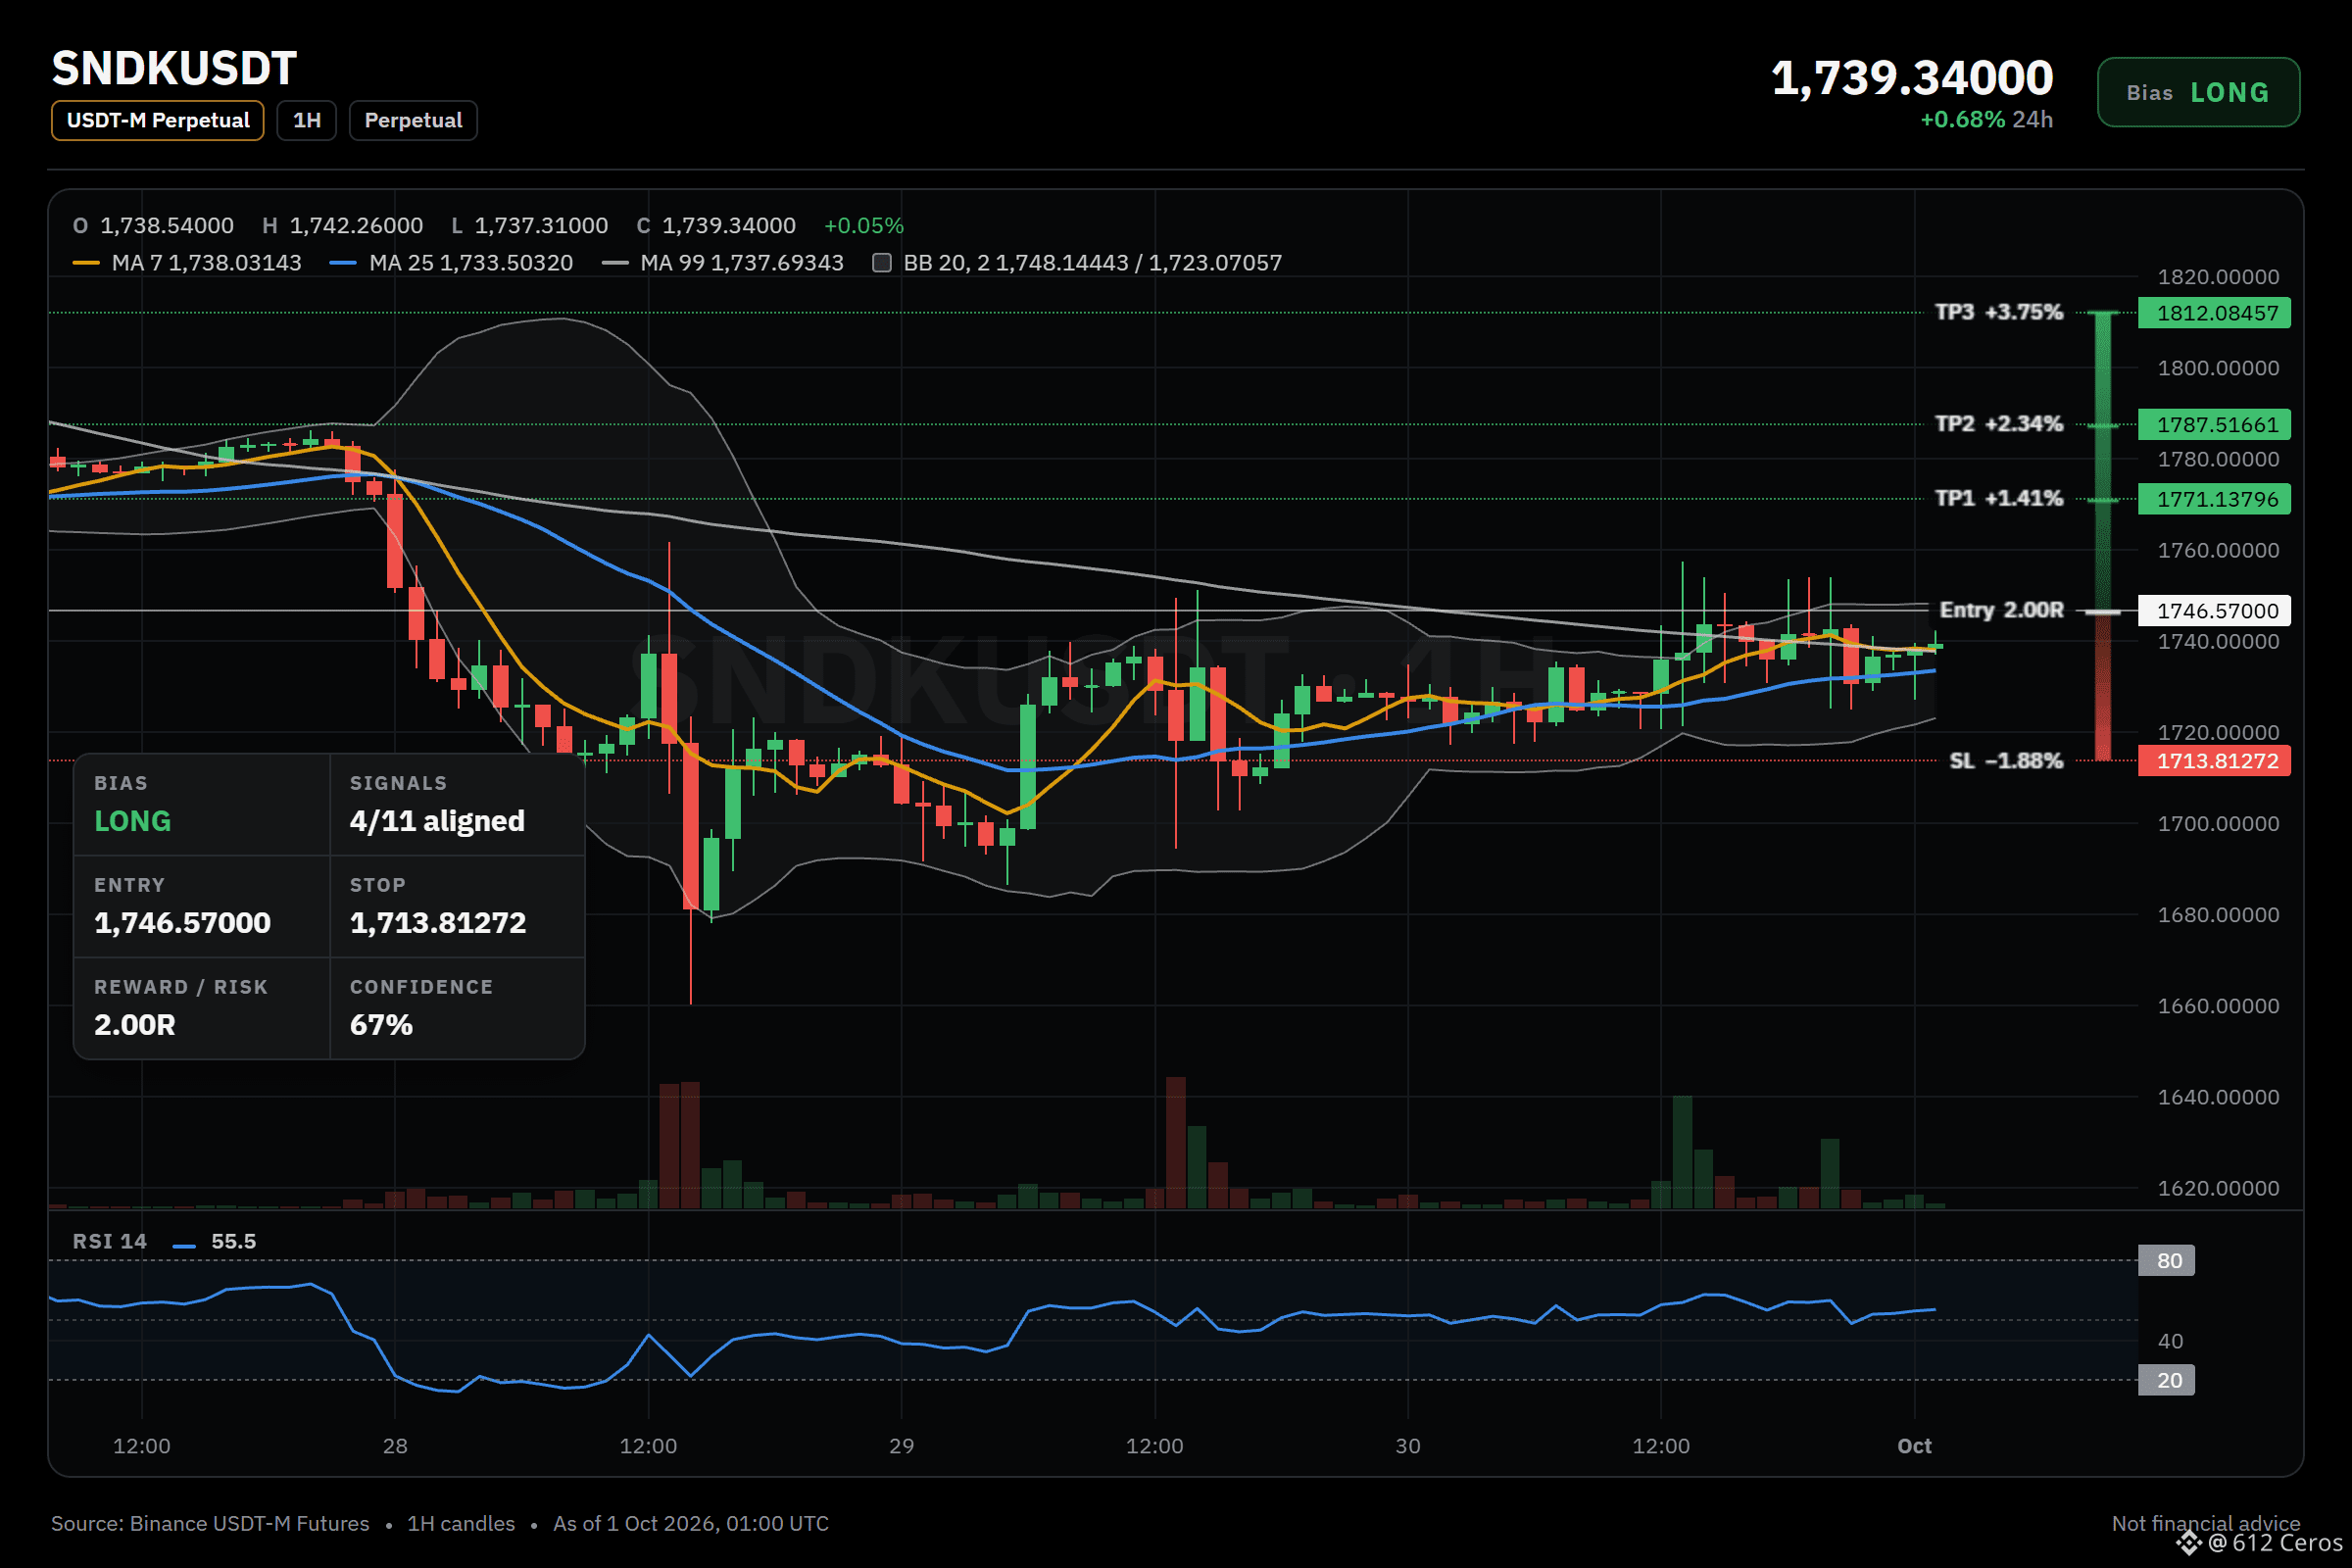
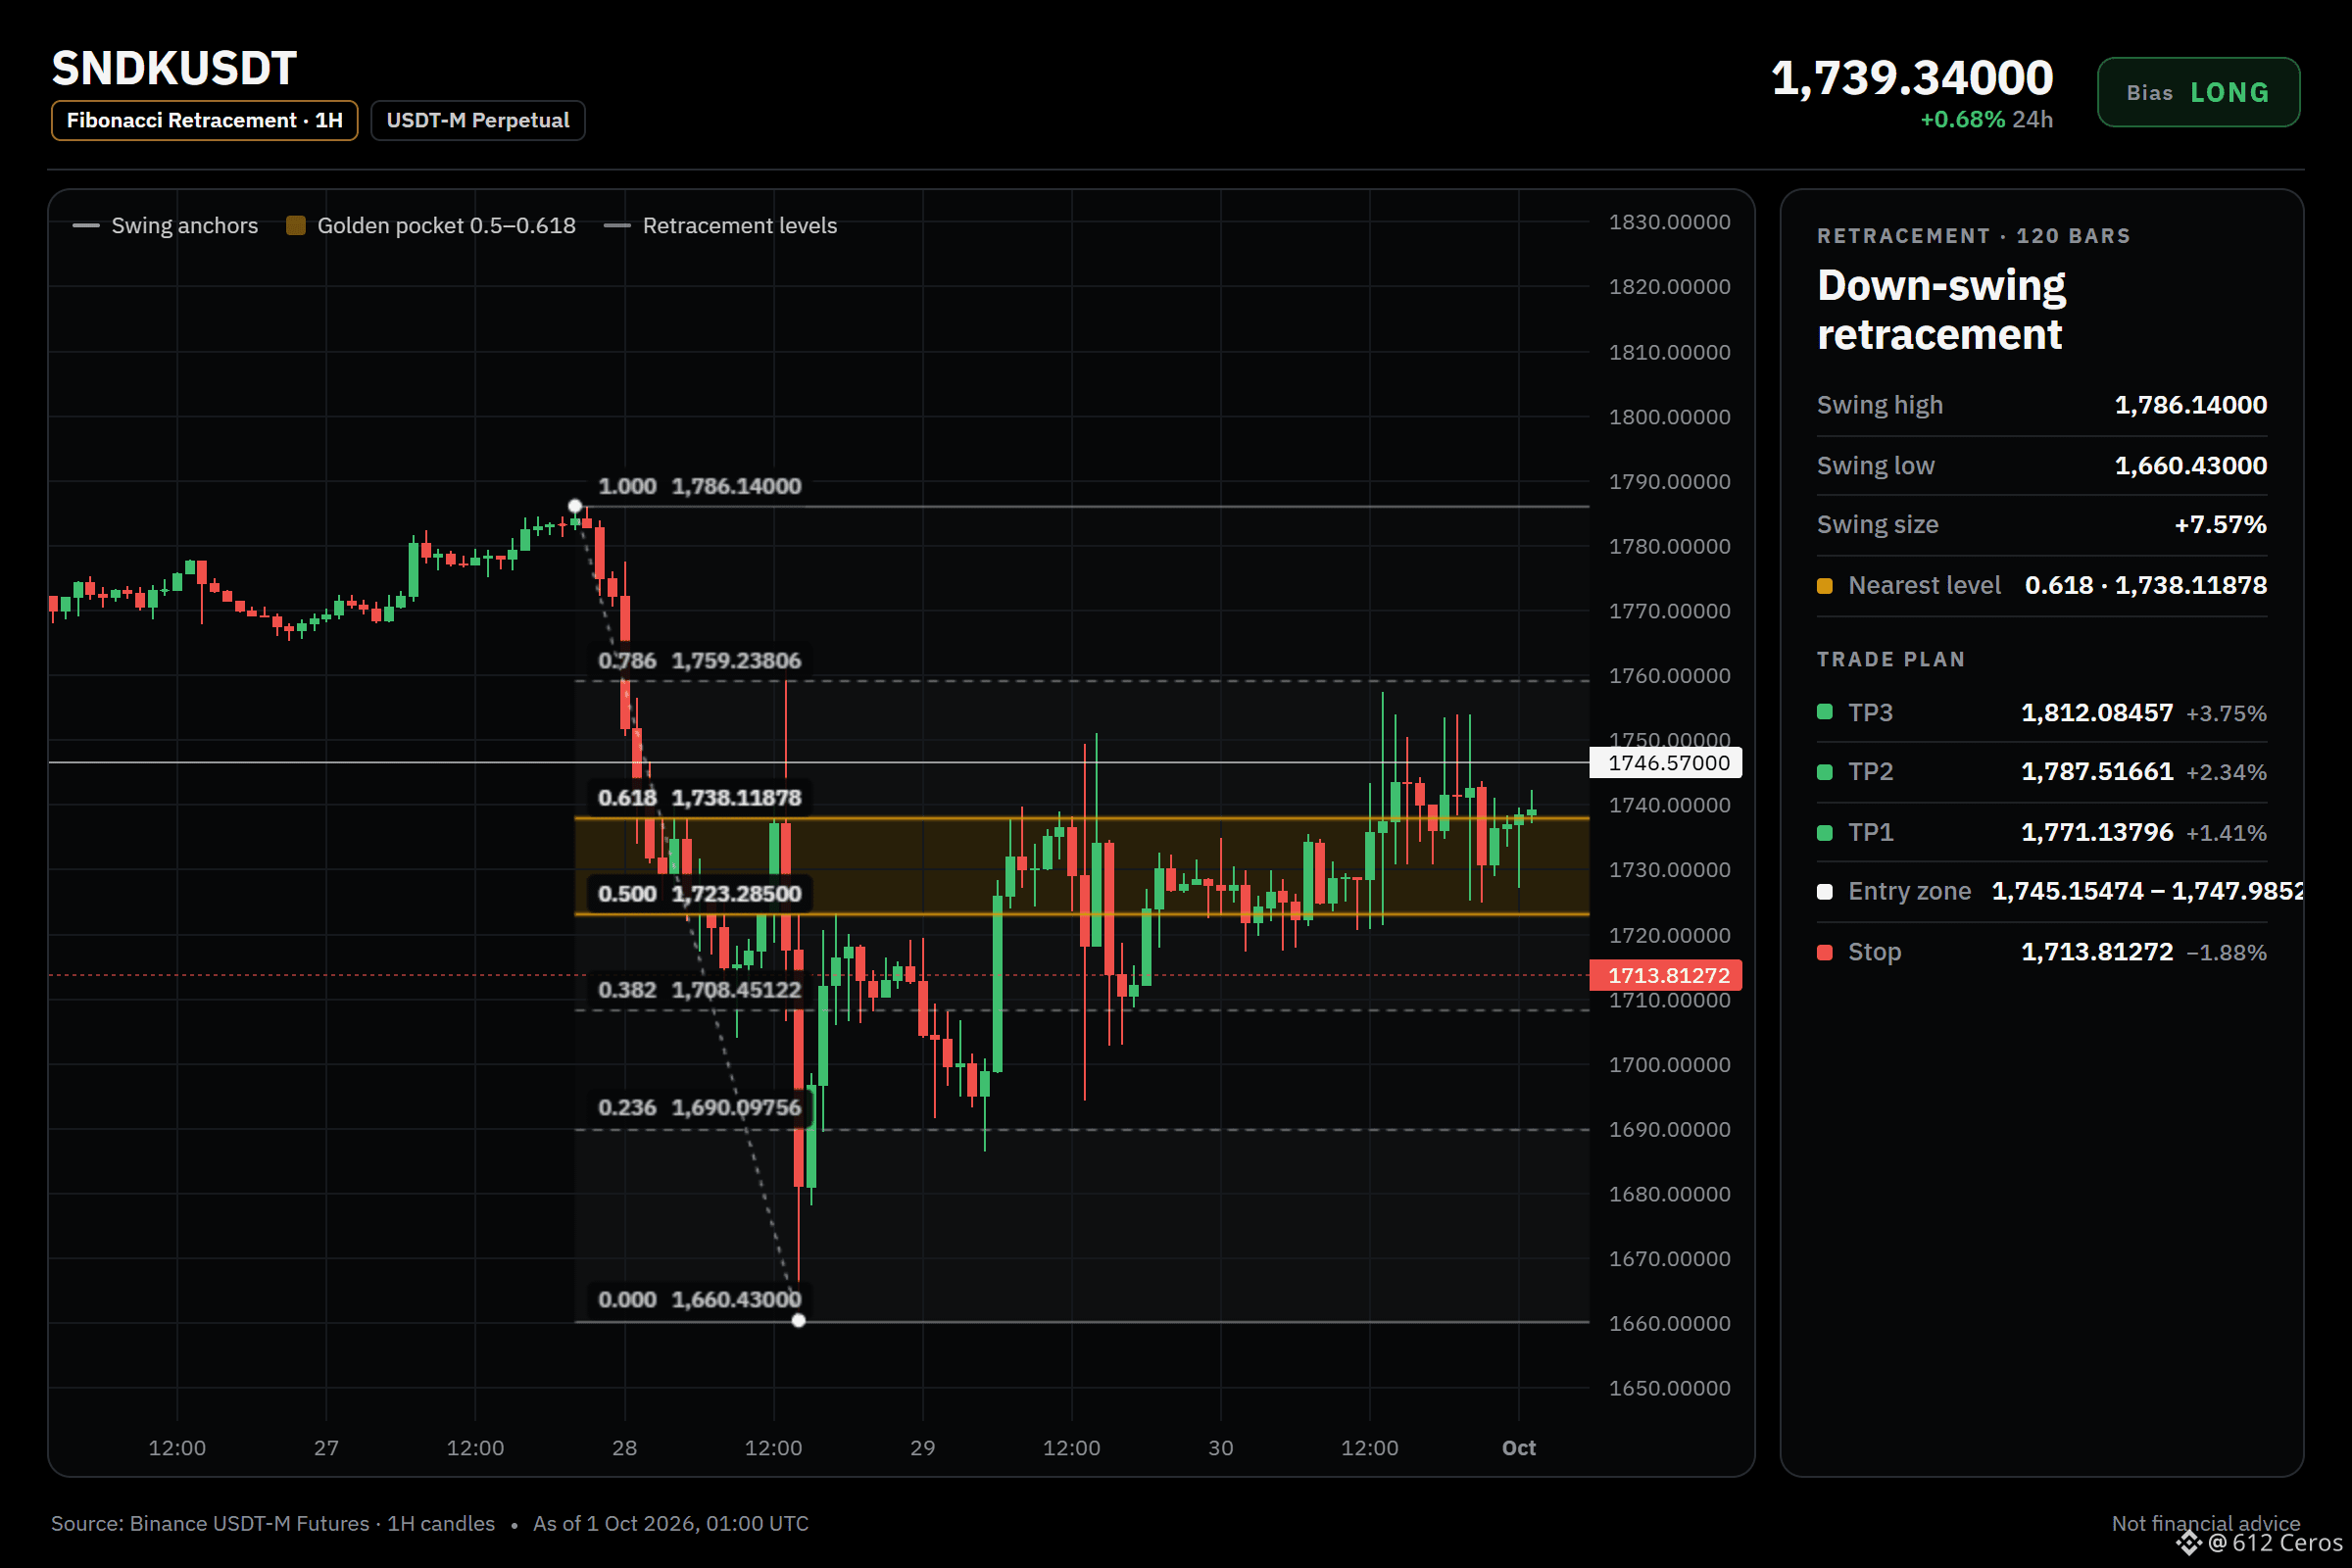
🟢 LONG $SNDK /USDT: expecting price to go UP
Bias: LONG · Leaning
📍 Entry: 1745.15474 – 1747.98526
🎯 TP1: 1771.13796 (+1.4%)
🎯 TP2: 1787.51661 (+2.3%)
🎯 TP3: 1812.08457 (+3.8%)
🛑 SL: 1713.81272 (-1.9%)
💡 Enter only inside the zone. Take half at TP1, then move the stop to entry.
⚠️ Moderate conviction only. Keep size light.
SNDK looks too smooth to ignore
Why LONG? Leaning call, 4/11 signals agree, 0 against, 7 undecided.
✅ 4h trend: price > EMA50 > EMA200, bullish stack → the swing trend is up
✅ 1h RSI: 55.5, bullish momentum (above 55) → buyers have the momentum
✅ Short-term momentum (15m): RSI z-score +1.74, last candle +0.13%, buyers pressing → buyers are pushing right now
The 4h trend is up with price above EMA50 and EMA200. Buyers have momentum in the last 15 minutes. Some factors disagree and conviction is moderate.
Where do you take profit on a swing up from the 1745 to 1748 zone?
Chart with every level 👇
{future}(SNDKUSDT)
📲 Want more of my latest signals? Join me here:
[https://app.binance.com/uni-qr/D26WbL9t](https://app.binance.com/uni-qr/D26WbL9t)
⚠️ Personal market analysis only. NFA — manage risk and DYOR.
Educational content, not investment advice or a recommendation to buy, sell, deposit, or withdraw any asset. No paid promotion or referral/affiliate links.
🟢 LONG $SNDK /USDT: expecting price to go UP
Bias: LONG · Leaning
📍 Entry: 1745.15474 – 1747.98526
🎯 TP1: 1771.13796 (+1.4%)
🎯 TP2: 1787.51661 (+2.3%)
🎯 TP3: 1812.08457 (+3.8%)
🛑 SL: 1713.81272 (-1.9%)
💡 Enter only inside the zone. Take half at TP1, then move the stop to entry.
⚠️ Moderate conviction only. Keep size light.
SNDK looks too smooth to ignore
Why LONG? Leaning call, 4/11 signals agree, 0 against, 7 undecided.
✅ 4h trend: price > EMA50 > EMA200, bullish stack → the swing trend is up
✅ 1h RSI: 55.5, bullish momentum (above 55) → buyers have the momentum
✅ Short-term momentum (15m): RSI z-score +1.74, last candle +0.13%, buyers pressing → buyers are pushing right now
The 4h trend is up with price above EMA50 and EMA200. Buyers have momentum in the last 15 minutes. Some factors disagree and conviction is moderate.
Where do you take profit on a swing up from the 1745 to 1748 zone?
Chart with every level 👇
📲 Want more of my latest signals? Join me here:
https://app.binance.com/uni-qr/D26WbL9t
⚠️ Personal market analysis only. NFA — manage risk and DYOR.
Educational content, not investment advice or a recommendation to buy, sell, deposit, or withdraw any asset. No paid promotion or referral/affiliate links.
Bias: LONG · Leaning
📍 Entry: 1745.15474 – 1747.98526
🎯 TP1: 1771.13796 (+1.4%)
🎯 TP2: 1787.51661 (+2.3%)
🎯 TP3: 1812.08457 (+3.8%)
🛑 SL: 1713.81272 (-1.9%)
💡 Enter only inside the zone. Take half at TP1, then move the stop to entry.
⚠️ Moderate conviction only. Keep size light.
SNDK looks too smooth to ignore
Why LONG? Leaning call, 4/11 signals agree, 0 against, 7 undecided.
✅ 4h trend: price > EMA50 > EMA200, bullish stack → the swing trend is up
✅ 1h RSI: 55.5, bullish momentum (above 55) → buyers have the momentum
✅ Short-term momentum (15m): RSI z-score +1.74, last candle +0.13%, buyers pressing → buyers are pushing right now
The 4h trend is up with price above EMA50 and EMA200. Buyers have momentum in the last 15 minutes. Some factors disagree and conviction is moderate.
Where do you take profit on a swing up from the 1745 to 1748 zone?
Chart with every level 👇
📲 Want more of my latest signals? Join me here:
https://app.binance.com/uni-qr/D26WbL9t
⚠️ Personal market analysis only. NFA — manage risk and DYOR.
Educational content, not investment advice or a recommendation to buy, sell, deposit, or withdraw any asset. No paid promotion or referral/affiliate links.
3
473
·
--
Baissier
META is fading quietly while the 4h tells a story.
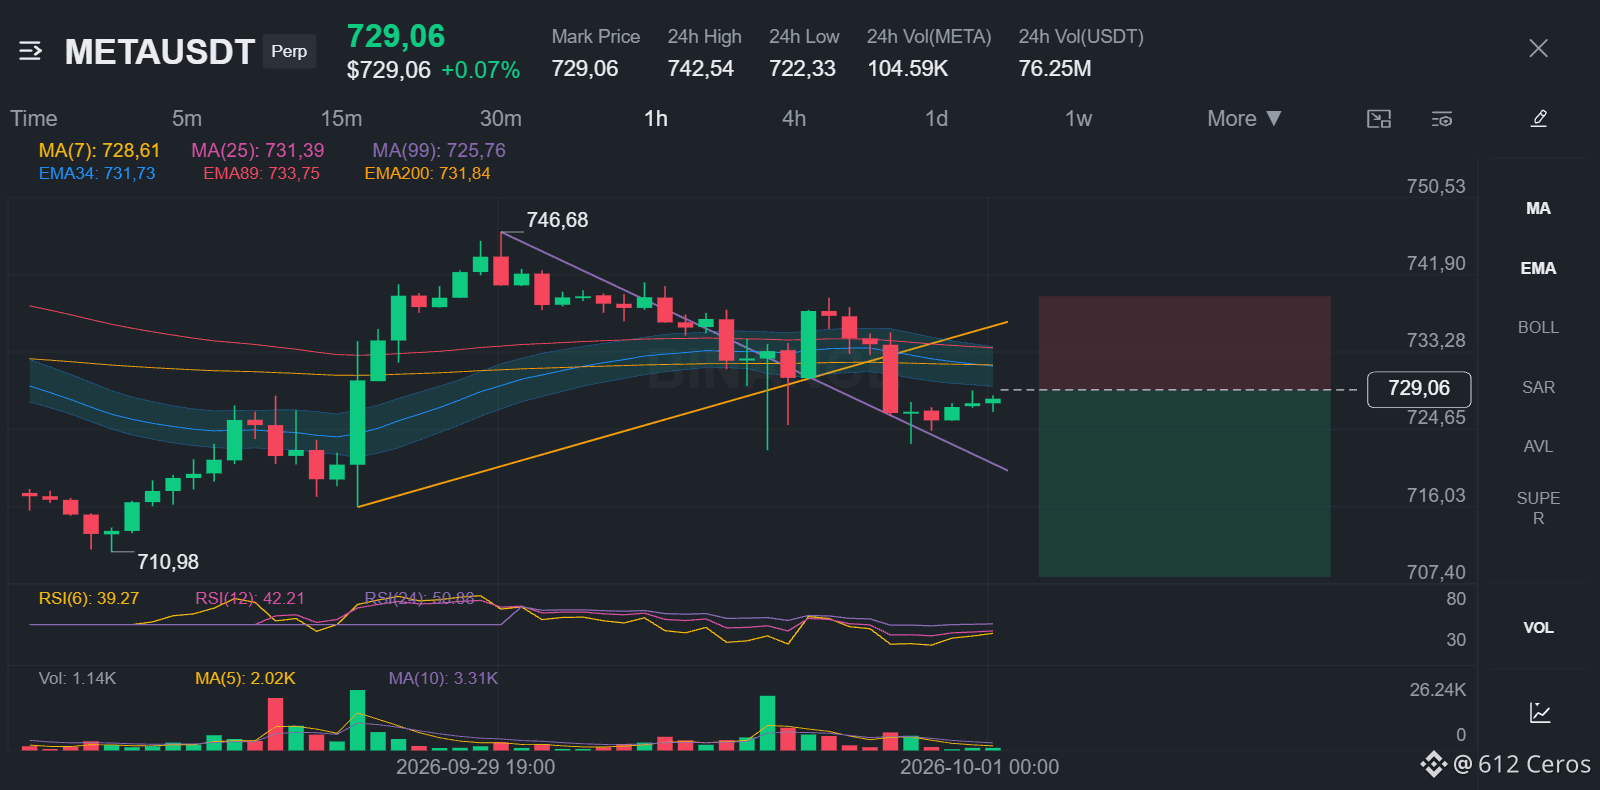
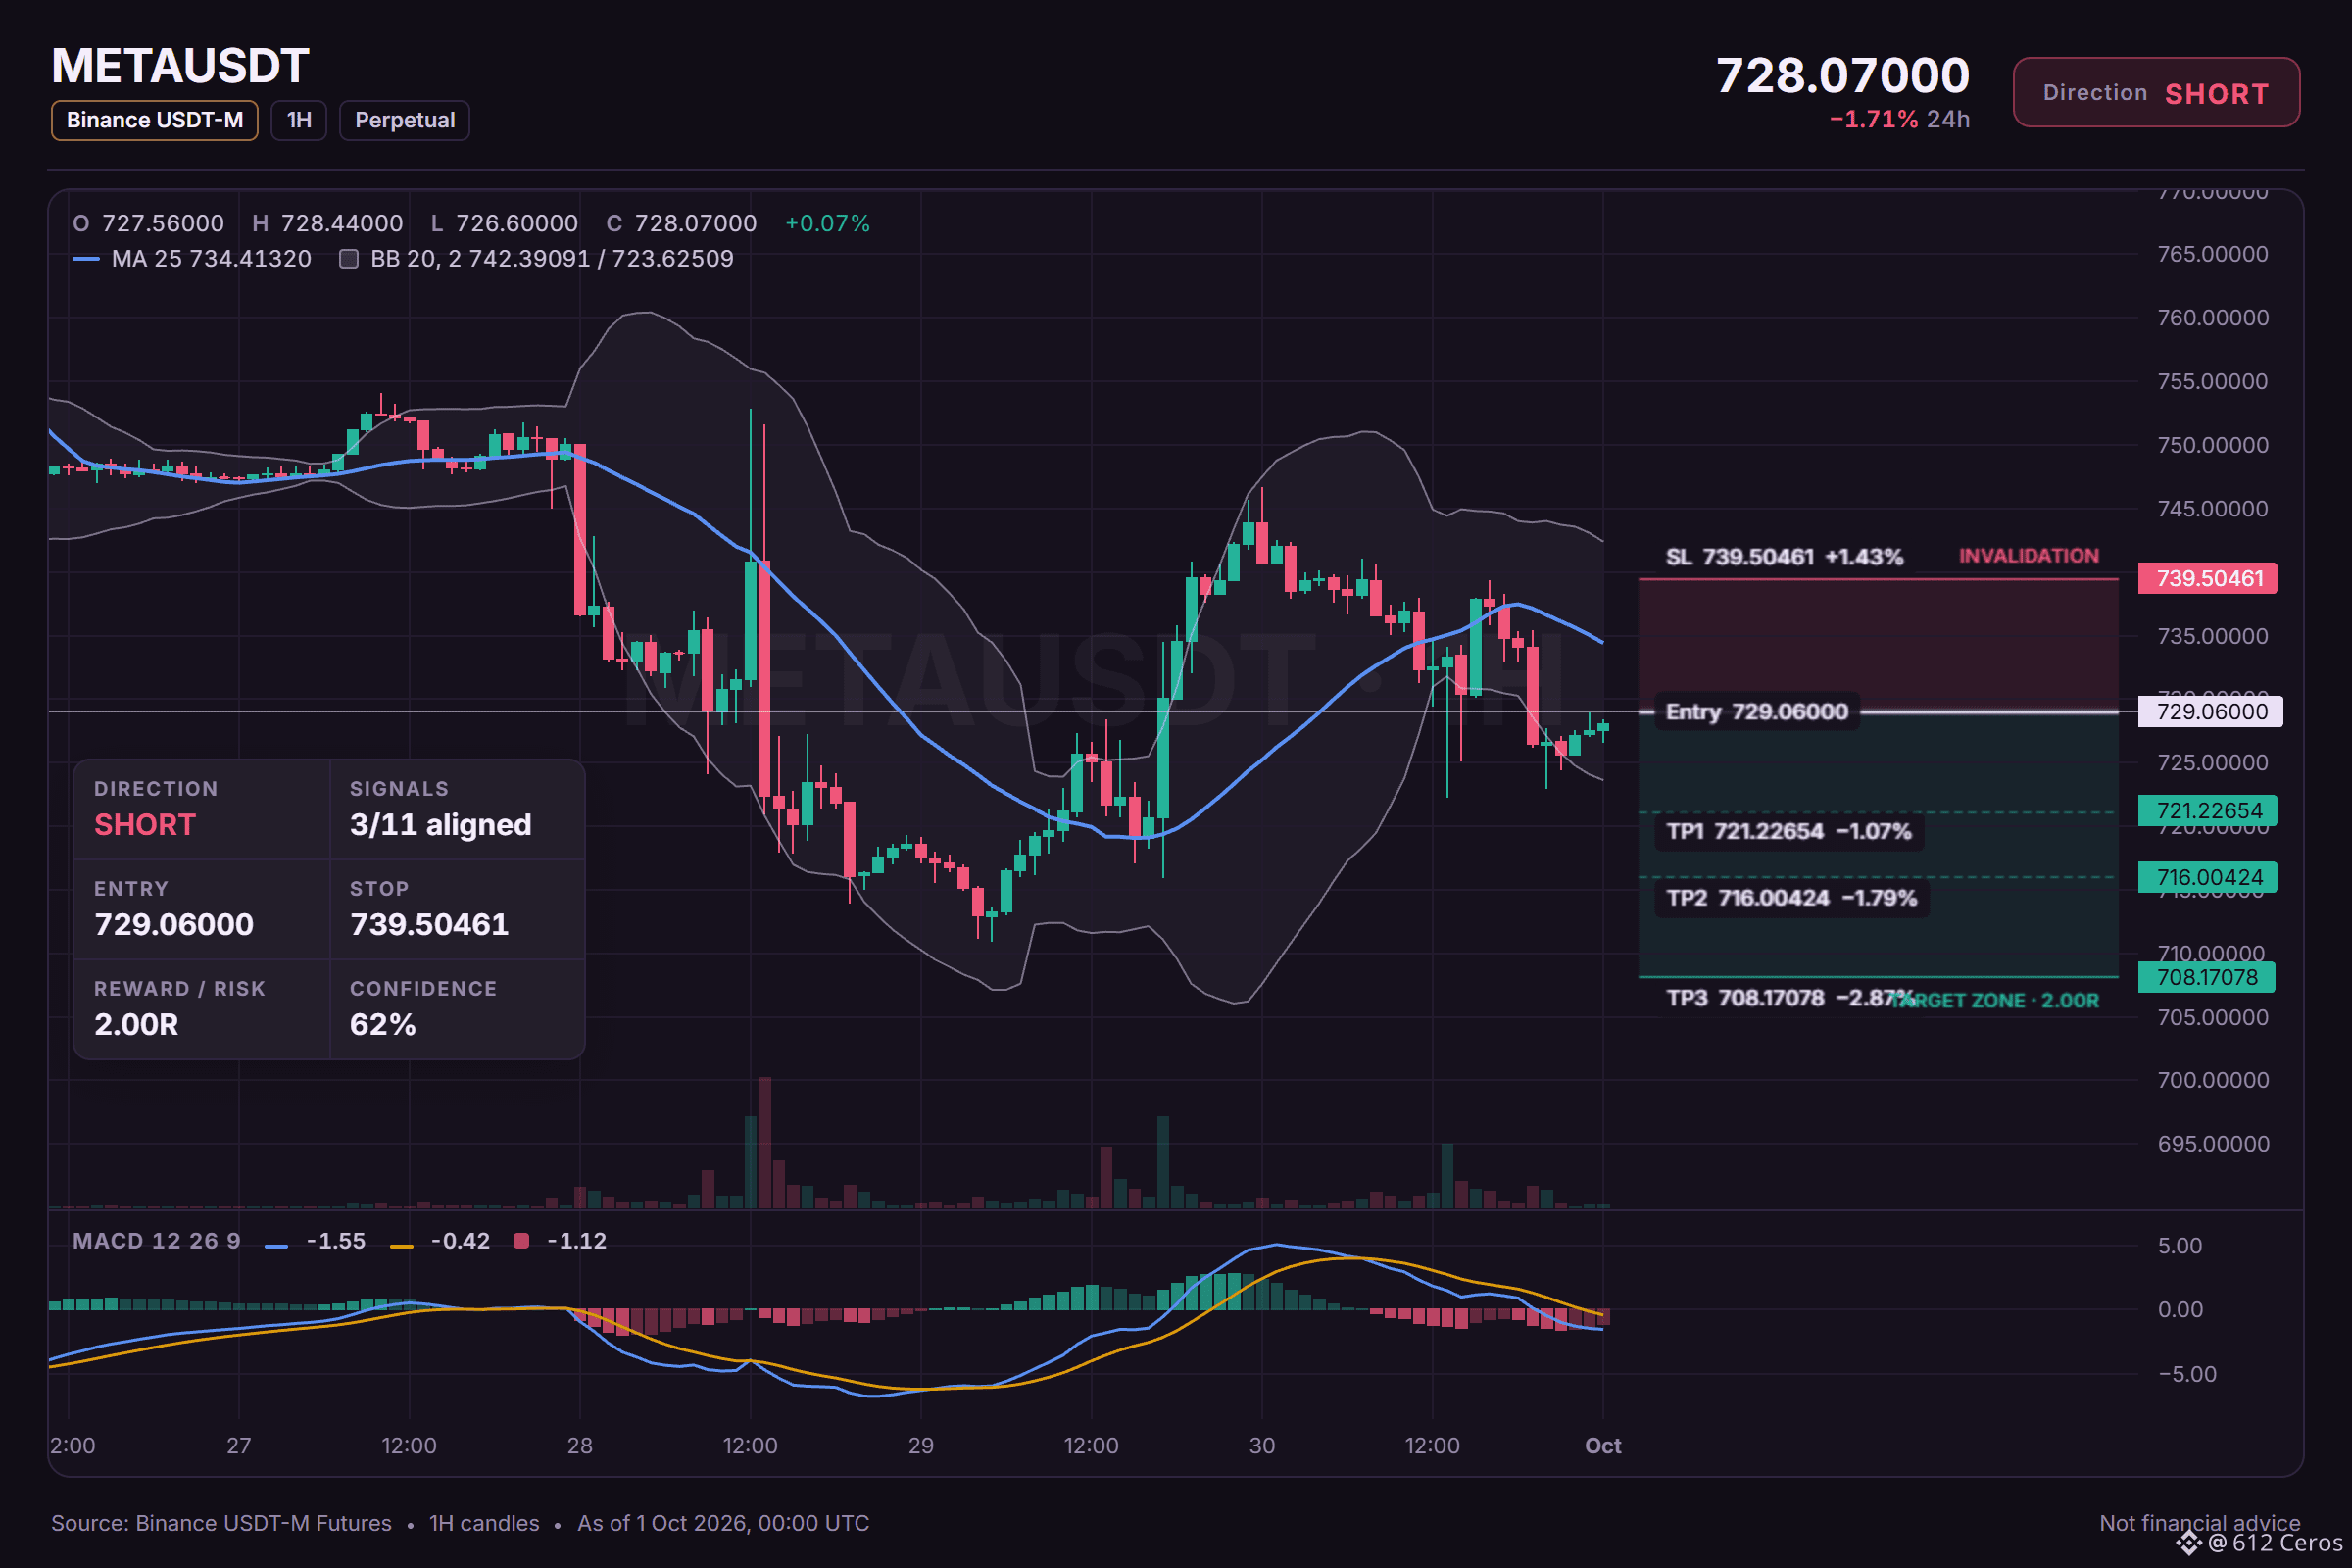
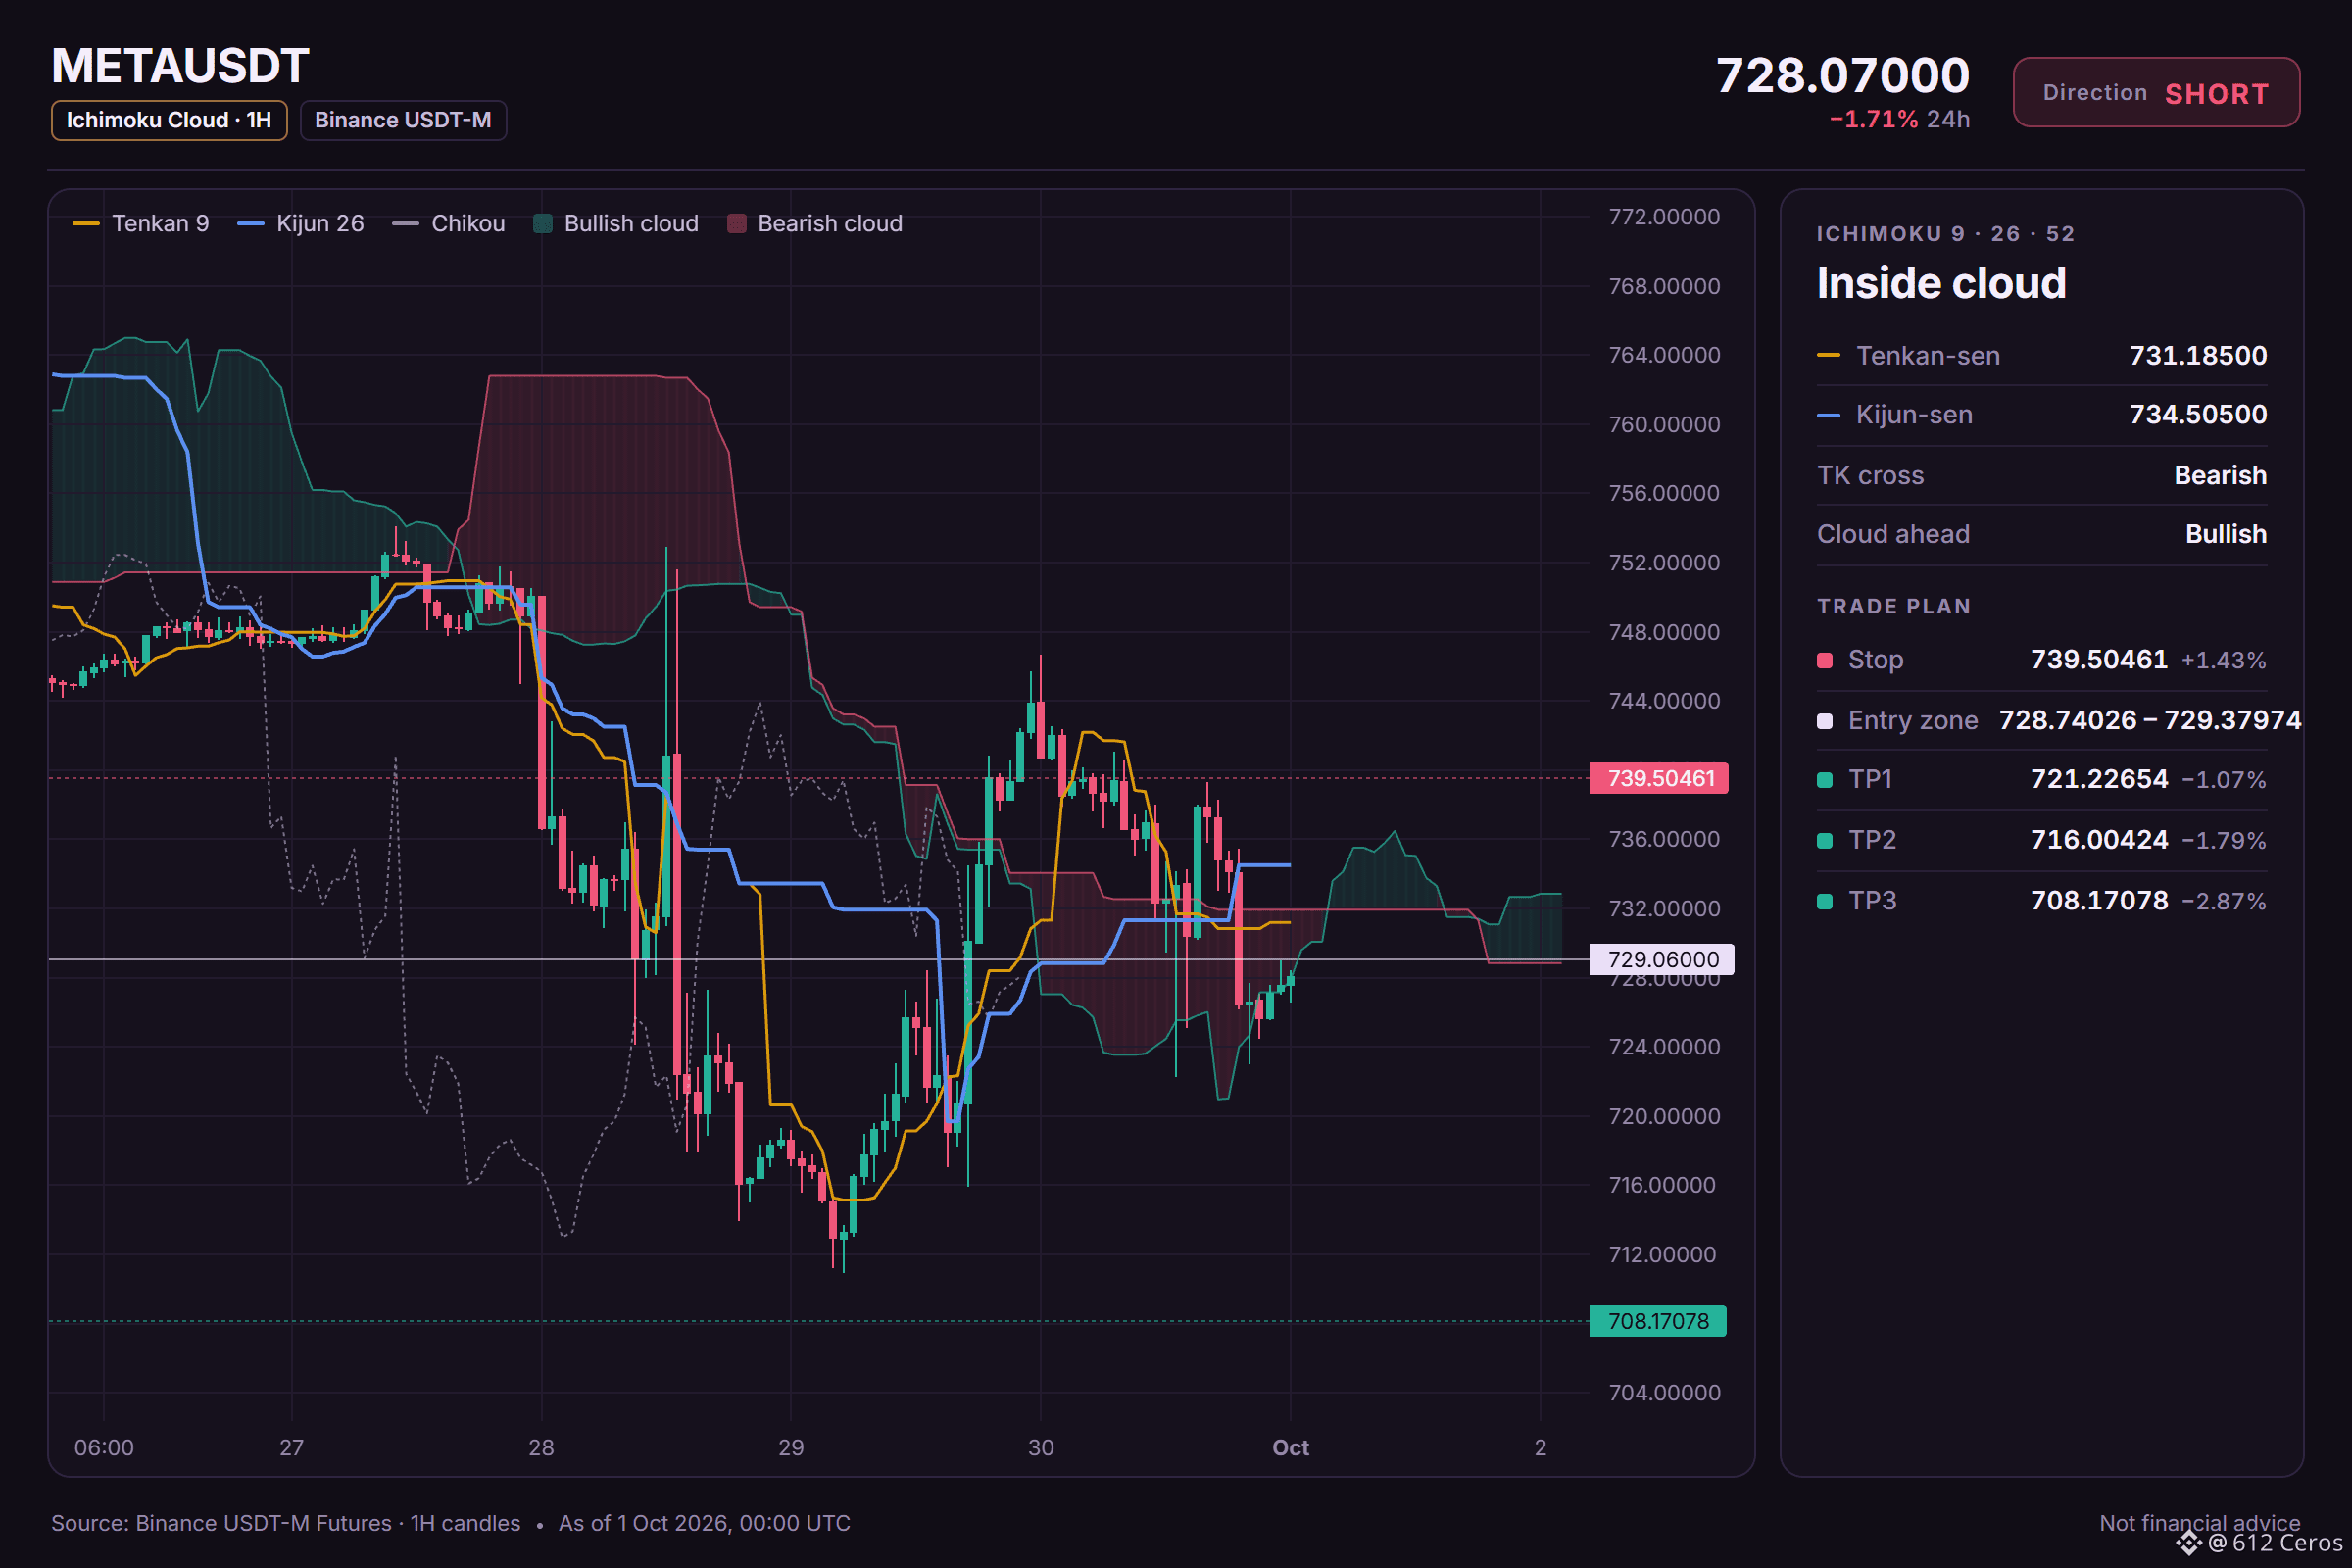
🔴 SHORT $META /USDT: expecting price to go DOWN
Bias: SHORT · Leaning · 3/11 signals agree, 0 against, 8 undecided
📍 Entry: 728.74026 – 729.37974 · limit order inside the zone, don't chase
🎯 TP1: 721.22654 (-1.1%) · take about half, then move SL to entry
🎯 TP2: 716.00424 (-1.8%) · take most of the rest
🎯 TP3: 708.17078 (-2.9%) · final target
🛑 SL: 739.50461 (+1.4%) · close everything, never move it further away
⚖️ Reward vs risk: 0.75R / 1.25R / 2R at TP1 / TP2 / TP3
TP1 alone pays less than the stop costs, which is why the stop moves to entry after it.
⏳ Timing: 15m momentum has not turned yet, only enter inside the zone. Skip it if TP1 prints first.
⚠️ Leaning only: 8 of 11 signals are still undecided. Keep size light.
Why SHORT? Technical verdict: LEANING SHORT, 3/11 signals agree, 0 against, 8 undecided.
What supports it (3):
• Trend strength (ADX/DI, 15m): ADX 26.8 with sellers in control (DI+ 22.1 vs DI− 25.0) → sellers are driving the move
• 1h RSI: 42.9, bearish momentum (below 45) → sellers have the momentum
• Relative strength vs BTC: underperforming, −1.98% vs BTC over the last day → weaker than BTC
No factor points the other way right now.
Quick META breakdown 🧵
1/4 The 1h price sits below EMA50 but EMAs aren't stacked.
2/4 1h RSI at 42.9 signals bearish momentum — sellers have it.
3/4 Short from 729.38 targeting 721.23, 716.00, 708.17.
4/4 Stop at 739.50 — close if the 1h reclaim it.
Which level would you take profit first — TP1, TP2, or TP3?
Levels mapped on the chart below 👇
{future}(METAUSDT)
📲 Want more of my latest signals? Join me here:
[https://app.binance.com/uni-qr/D26WbL9t](https://app.binance.com/uni-qr/D26WbL9t)
⚠️ Personal market analysis only. NFA — manage risk and DYOR.
Educational content, not investment advice or a recommendation to buy, sell, deposit, or withdraw any asset. No paid promotion or referral/affiliate links.
META is fading quietly while the 4h tells a story.
🔴 SHORT $META /USDT: expecting price to go DOWN
Bias: SHORT · Leaning · 3/11 signals agree, 0 against, 8 undecided
📍 Entry: 728.74026 – 729.37974 · limit order inside the zone, don't chase
🎯 TP1: 721.22654 (-1.1%) · take about half, then move SL to entry
🎯 TP2: 716.00424 (-1.8%) · take most of the rest
🎯 TP3: 708.17078 (-2.9%) · final target
🛑 SL: 739.50461 (+1.4%) · close everything, never move it further away
⚖️ Reward vs risk: 0.75R / 1.25R / 2R at TP1 / TP2 / TP3
TP1 alone pays less than the stop costs, which is why the stop moves to entry after it.
⏳ Timing: 15m momentum has not turned yet, only enter inside the zone. Skip it if TP1 prints first.
⚠️ Leaning only: 8 of 11 signals are still undecided. Keep size light.
Why SHORT? Technical verdict: LEANING SHORT, 3/11 signals agree, 0 against, 8 undecided.
What supports it (3):
• Trend strength (ADX/DI, 15m): ADX 26.8 with sellers in control (DI+ 22.1 vs DI− 25.0) → sellers are driving the move
• 1h RSI: 42.9, bearish momentum (below 45) → sellers have the momentum
• Relative strength vs BTC: underperforming, −1.98% vs BTC over the last day → weaker than BTC
No factor points the other way right now.
Quick META breakdown 🧵
1/4 The 1h price sits below EMA50 but EMAs aren't stacked.
2/4 1h RSI at 42.9 signals bearish momentum — sellers have it.
3/4 Short from 729.38 targeting 721.23, 716.00, 708.17.
4/4 Stop at 739.50 — close if the 1h reclaim it.
Which level would you take profit first — TP1, TP2, or TP3?
Levels mapped on the chart below 👇
📲 Want more of my latest signals? Join me here:
https://app.binance.com/uni-qr/D26WbL9t
⚠️ Personal market analysis only. NFA — manage risk and DYOR.
Educational content, not investment advice or a recommendation to buy, sell, deposit, or withdraw any asset. No paid promotion or referral/affiliate links.
🔴 SHORT $META /USDT: expecting price to go DOWN
Bias: SHORT · Leaning · 3/11 signals agree, 0 against, 8 undecided
📍 Entry: 728.74026 – 729.37974 · limit order inside the zone, don't chase
🎯 TP1: 721.22654 (-1.1%) · take about half, then move SL to entry
🎯 TP2: 716.00424 (-1.8%) · take most of the rest
🎯 TP3: 708.17078 (-2.9%) · final target
🛑 SL: 739.50461 (+1.4%) · close everything, never move it further away
⚖️ Reward vs risk: 0.75R / 1.25R / 2R at TP1 / TP2 / TP3
TP1 alone pays less than the stop costs, which is why the stop moves to entry after it.
⏳ Timing: 15m momentum has not turned yet, only enter inside the zone. Skip it if TP1 prints first.
⚠️ Leaning only: 8 of 11 signals are still undecided. Keep size light.
Why SHORT? Technical verdict: LEANING SHORT, 3/11 signals agree, 0 against, 8 undecided.
What supports it (3):
• Trend strength (ADX/DI, 15m): ADX 26.8 with sellers in control (DI+ 22.1 vs DI− 25.0) → sellers are driving the move
• 1h RSI: 42.9, bearish momentum (below 45) → sellers have the momentum
• Relative strength vs BTC: underperforming, −1.98% vs BTC over the last day → weaker than BTC
No factor points the other way right now.
Quick META breakdown 🧵
1/4 The 1h price sits below EMA50 but EMAs aren't stacked.
2/4 1h RSI at 42.9 signals bearish momentum — sellers have it.
3/4 Short from 729.38 targeting 721.23, 716.00, 708.17.
4/4 Stop at 739.50 — close if the 1h reclaim it.
Which level would you take profit first — TP1, TP2, or TP3?
Levels mapped on the chart below 👇
📲 Want more of my latest signals? Join me here:
https://app.binance.com/uni-qr/D26WbL9t
⚠️ Personal market analysis only. NFA — manage risk and DYOR.
Educational content, not investment advice or a recommendation to buy, sell, deposit, or withdraw any asset. No paid promotion or referral/affiliate links.
3
857
·
--
Haussier
ONDO long setup: the levels I'm watching
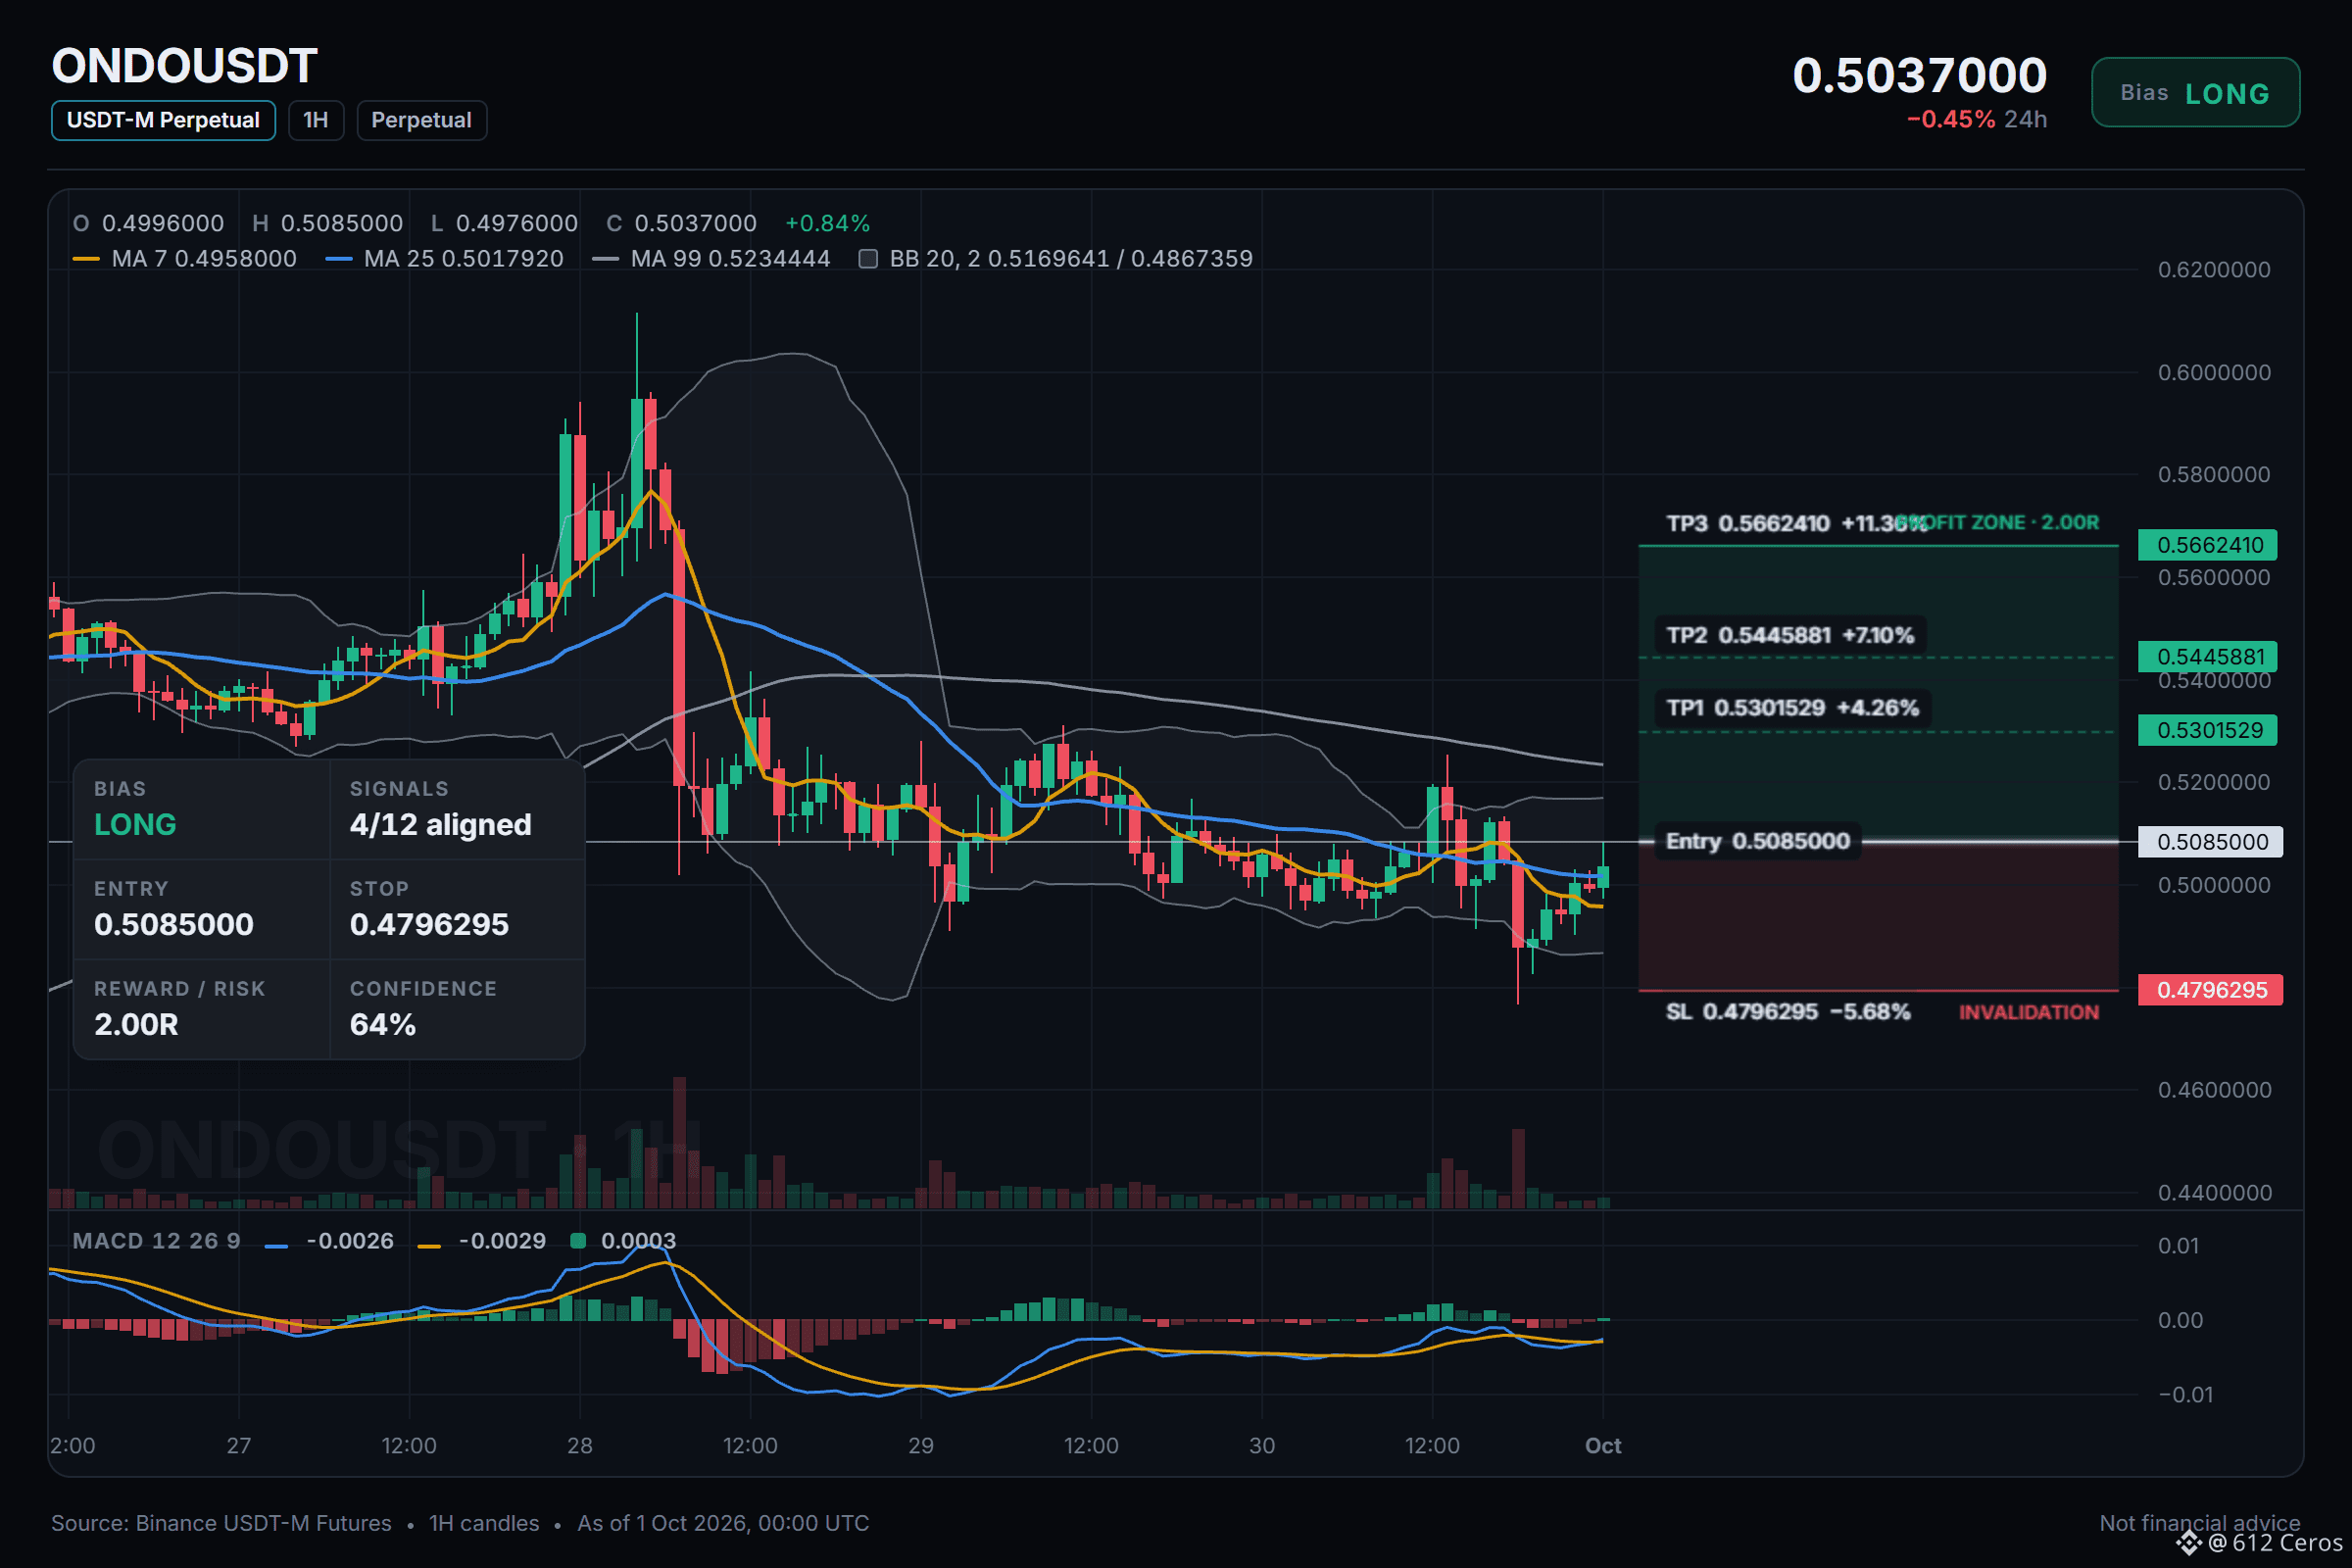
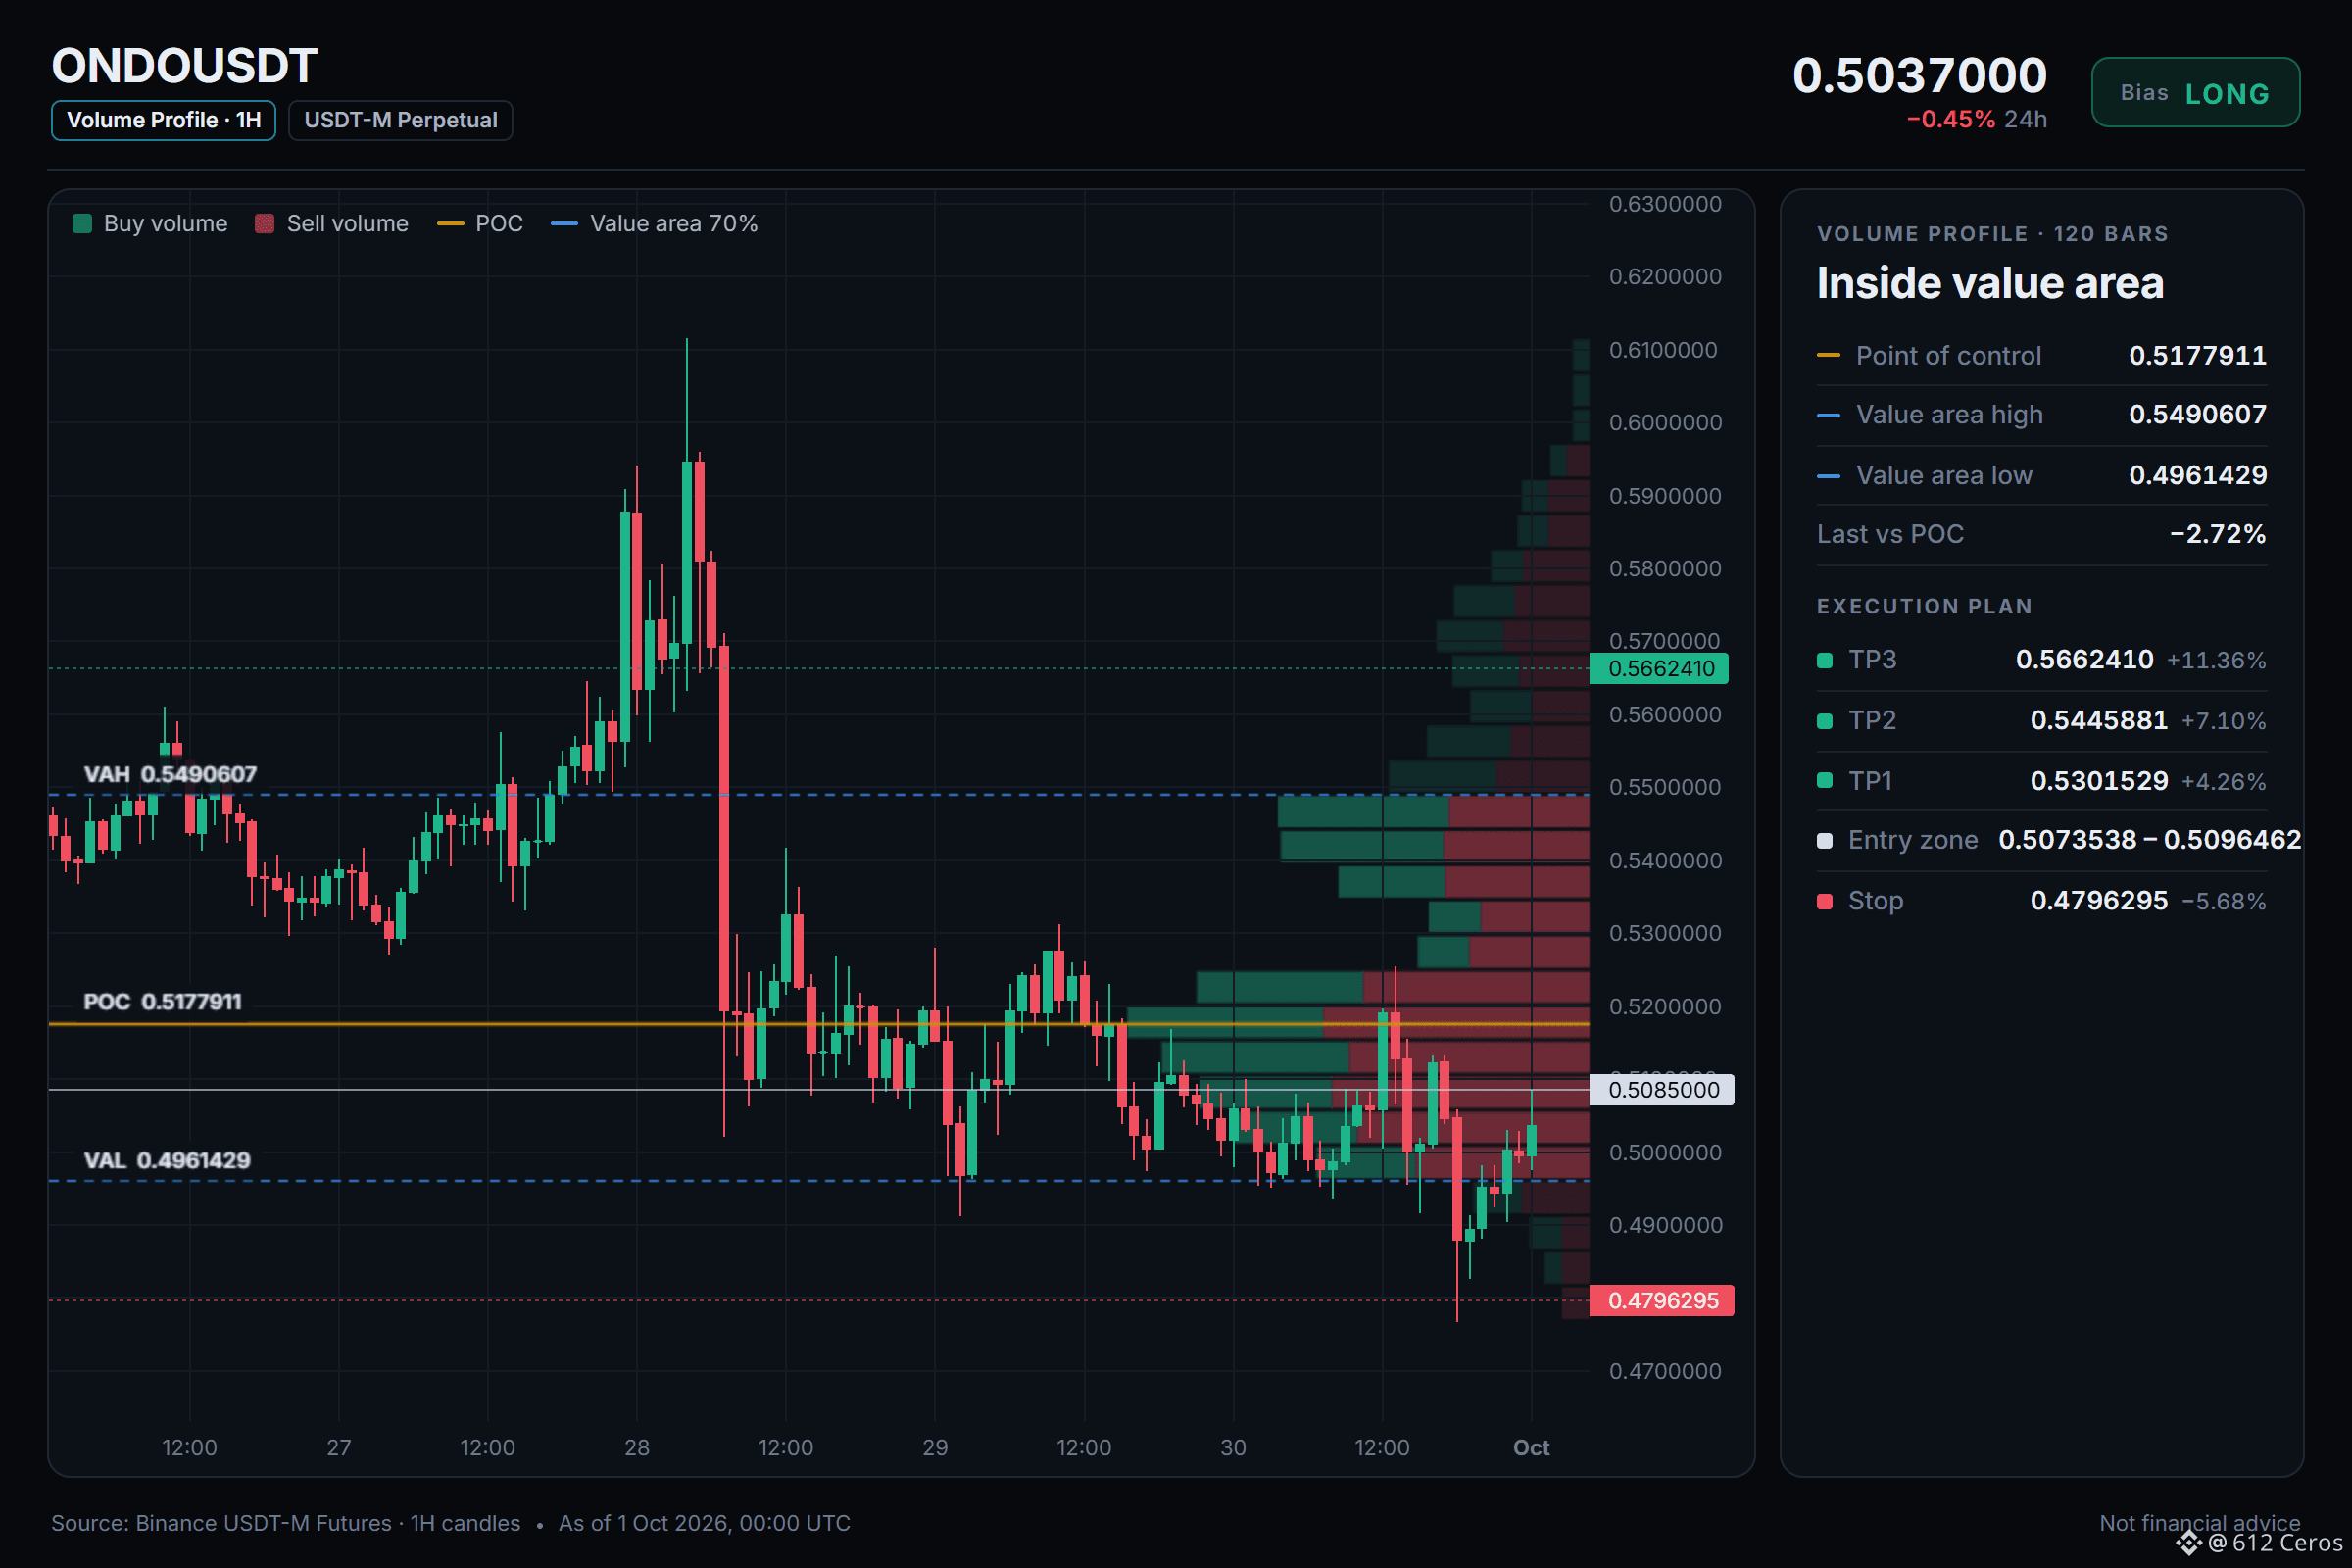
🟢 LONG $ONDO /USDT: expecting price to go UP
Bias: LONG · Leaning · 4/12 signals agree, 1 against, 7 undecided
📍 Entry: 0.5073538 – 0.5096462 · limit order inside the zone, don't chase
🎯 TP1: 0.5301529 (+4.3%) · take about half, then move SL to entry
🎯 TP2: 0.5445881 (+7.1%) · take most of the rest
🎯 TP3: 0.5662410 (+11.4%) · final target
🛑 SL: 0.4796295 (-5.7%) · close everything, never move it further away
⚖️ Reward vs risk: 0.75R / 1.25R / 2R at TP1 / TP2 / TP3
TP1 alone pays less than the stop costs, which is why the stop moves to entry after it.
⏳ Timing: 15m momentum already agrees. Skip it if TP1 prints before you get filled.
⚠️ Moderate conviction only, 1 signal point the other way. Keep size light.
Why LONG? Technical verdict: LEANING LONG, 4/12 signals agree, 1 against, 7 undecided.
✅ Daily trend: price > EMA50 > EMA200, bullish stack → the big-picture trend is up
✅ 4h trend: price > EMA50 > EMA200, bullish stack → the swing trend is up
✅ 1h trend: price > EMA50 > EMA200, bullish stack → the short-term trend is up
✅ Short-term momentum (15m): RSI z-score +1.15, last candle +0.95%, buyers pressing → buyers are pushing right now
⚠️ BTC backdrop: BTC trend is bearish and correlation is 0.64 → BTC is falling and this coin tends to follow
The reasoning:
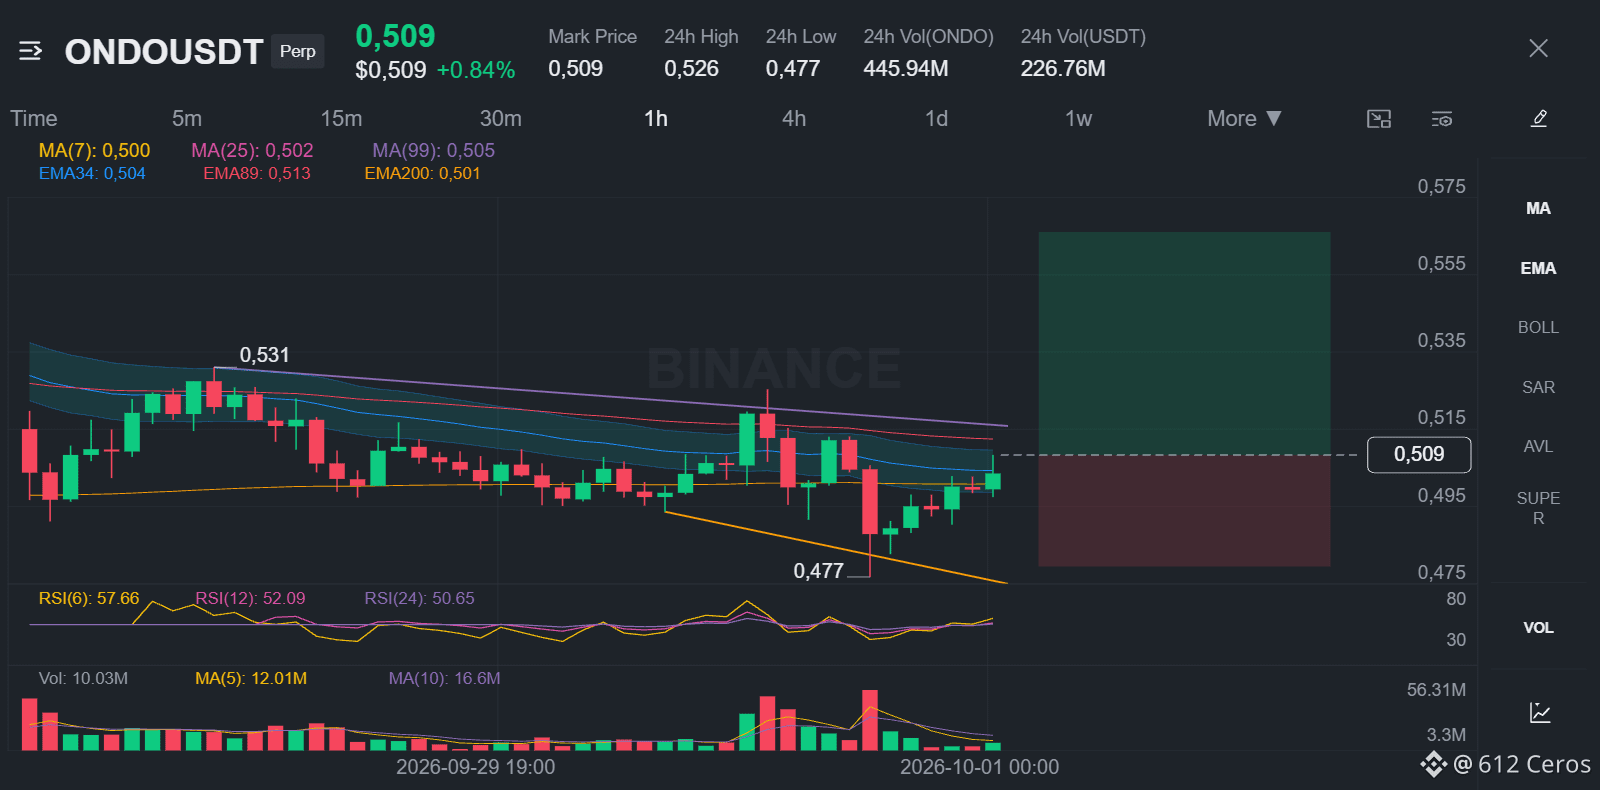
The daily trend reads bullish, and 4/12 signals aligned favour the long side. The plan is to work the 0.5073538 – 0.5096462 zone, scale out at 0.5301529 and 0.5445881, and stay patient for 0.5662410. A move through 0.4796295 means the idea is wrong and the stop does its job.
💬 Does ONDO tag 0.5301529 first, or the stop?
See it on the chart 👇
{future}(ONDOUSDT)
📲 Want more of my latest signals? Join me here:
[https://app.binance.com/uni-qr/D26WbL9t](https://app.binance.com/uni-qr/D26WbL9t)
⚠️ Personal market analysis only. NFA — manage risk and DYOR.
Educational content, not investment advice or a recommendation to buy, sell, deposit, or withdraw any asset. No paid promotion or referral/affiliate links.
ONDO long setup: the levels I'm watching
🟢 LONG $ONDO /USDT: expecting price to go UP
Bias: LONG · Leaning · 4/12 signals agree, 1 against, 7 undecided
📍 Entry: 0.5073538 – 0.5096462 · limit order inside the zone, don't chase
🎯 TP1: 0.5301529 (+4.3%) · take about half, then move SL to entry
🎯 TP2: 0.5445881 (+7.1%) · take most of the rest
🎯 TP3: 0.5662410 (+11.4%) · final target
🛑 SL: 0.4796295 (-5.7%) · close everything, never move it further away
⚖️ Reward vs risk: 0.75R / 1.25R / 2R at TP1 / TP2 / TP3
TP1 alone pays less than the stop costs, which is why the stop moves to entry after it.
⏳ Timing: 15m momentum already agrees. Skip it if TP1 prints before you get filled.
⚠️ Moderate conviction only, 1 signal point the other way. Keep size light.
Why LONG? Technical verdict: LEANING LONG, 4/12 signals agree, 1 against, 7 undecided.
✅ Daily trend: price > EMA50 > EMA200, bullish stack → the big-picture trend is up
✅ 4h trend: price > EMA50 > EMA200, bullish stack → the swing trend is up
✅ 1h trend: price > EMA50 > EMA200, bullish stack → the short-term trend is up
✅ Short-term momentum (15m): RSI z-score +1.15, last candle +0.95%, buyers pressing → buyers are pushing right now
⚠️ BTC backdrop: BTC trend is bearish and correlation is 0.64 → BTC is falling and this coin tends to follow
The reasoning:
The daily trend reads bullish, and 4/12 signals aligned favour the long side. The plan is to work the 0.5073538 – 0.5096462 zone, scale out at 0.5301529 and 0.5445881, and stay patient for 0.5662410. A move through 0.4796295 means the idea is wrong and the stop does its job.
💬 Does ONDO tag 0.5301529 first, or the stop?
See it on the chart 👇
📲 Want more of my latest signals? Join me here:
https://app.binance.com/uni-qr/D26WbL9t
⚠️ Personal market analysis only. NFA — manage risk and DYOR.
Educational content, not investment advice or a recommendation to buy, sell, deposit, or withdraw any asset. No paid promotion or referral/affiliate links.
🟢 LONG $ONDO /USDT: expecting price to go UP
Bias: LONG · Leaning · 4/12 signals agree, 1 against, 7 undecided
📍 Entry: 0.5073538 – 0.5096462 · limit order inside the zone, don't chase
🎯 TP1: 0.5301529 (+4.3%) · take about half, then move SL to entry
🎯 TP2: 0.5445881 (+7.1%) · take most of the rest
🎯 TP3: 0.5662410 (+11.4%) · final target
🛑 SL: 0.4796295 (-5.7%) · close everything, never move it further away
⚖️ Reward vs risk: 0.75R / 1.25R / 2R at TP1 / TP2 / TP3
TP1 alone pays less than the stop costs, which is why the stop moves to entry after it.
⏳ Timing: 15m momentum already agrees. Skip it if TP1 prints before you get filled.
⚠️ Moderate conviction only, 1 signal point the other way. Keep size light.
Why LONG? Technical verdict: LEANING LONG, 4/12 signals agree, 1 against, 7 undecided.
✅ Daily trend: price > EMA50 > EMA200, bullish stack → the big-picture trend is up
✅ 4h trend: price > EMA50 > EMA200, bullish stack → the swing trend is up
✅ 1h trend: price > EMA50 > EMA200, bullish stack → the short-term trend is up
✅ Short-term momentum (15m): RSI z-score +1.15, last candle +0.95%, buyers pressing → buyers are pushing right now
⚠️ BTC backdrop: BTC trend is bearish and correlation is 0.64 → BTC is falling and this coin tends to follow
The reasoning:
The daily trend reads bullish, and 4/12 signals aligned favour the long side. The plan is to work the 0.5073538 – 0.5096462 zone, scale out at 0.5301529 and 0.5445881, and stay patient for 0.5662410. A move through 0.4796295 means the idea is wrong and the stop does its job.
💬 Does ONDO tag 0.5301529 first, or the stop?
See it on the chart 👇
📲 Want more of my latest signals? Join me here:
https://app.binance.com/uni-qr/D26WbL9t
⚠️ Personal market analysis only. NFA — manage risk and DYOR.
Educational content, not investment advice or a recommendation to buy, sell, deposit, or withdraw any asset. No paid promotion or referral/affiliate links.
593
·
--
Haussier
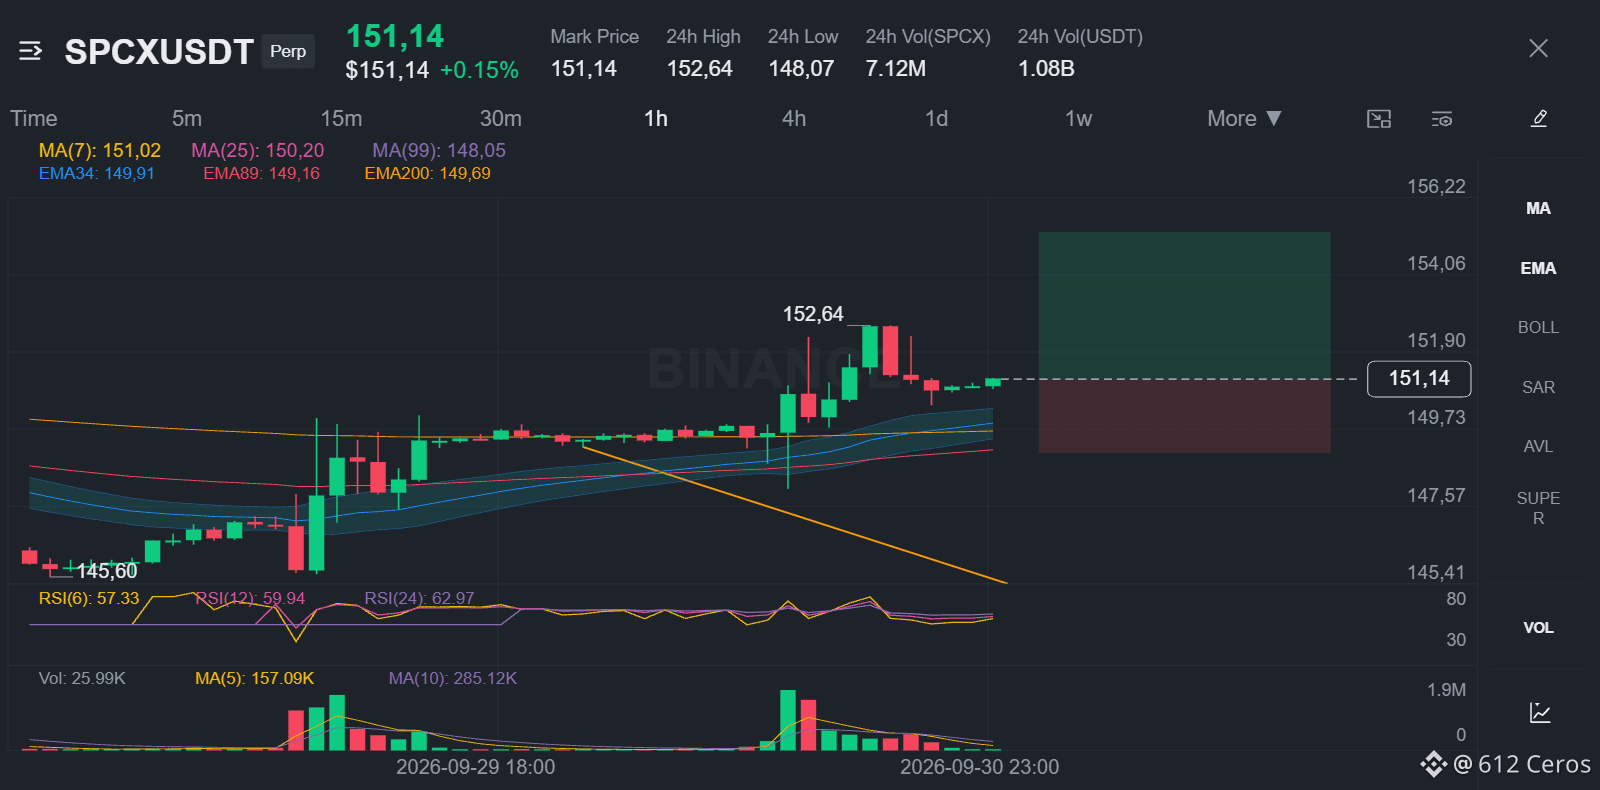
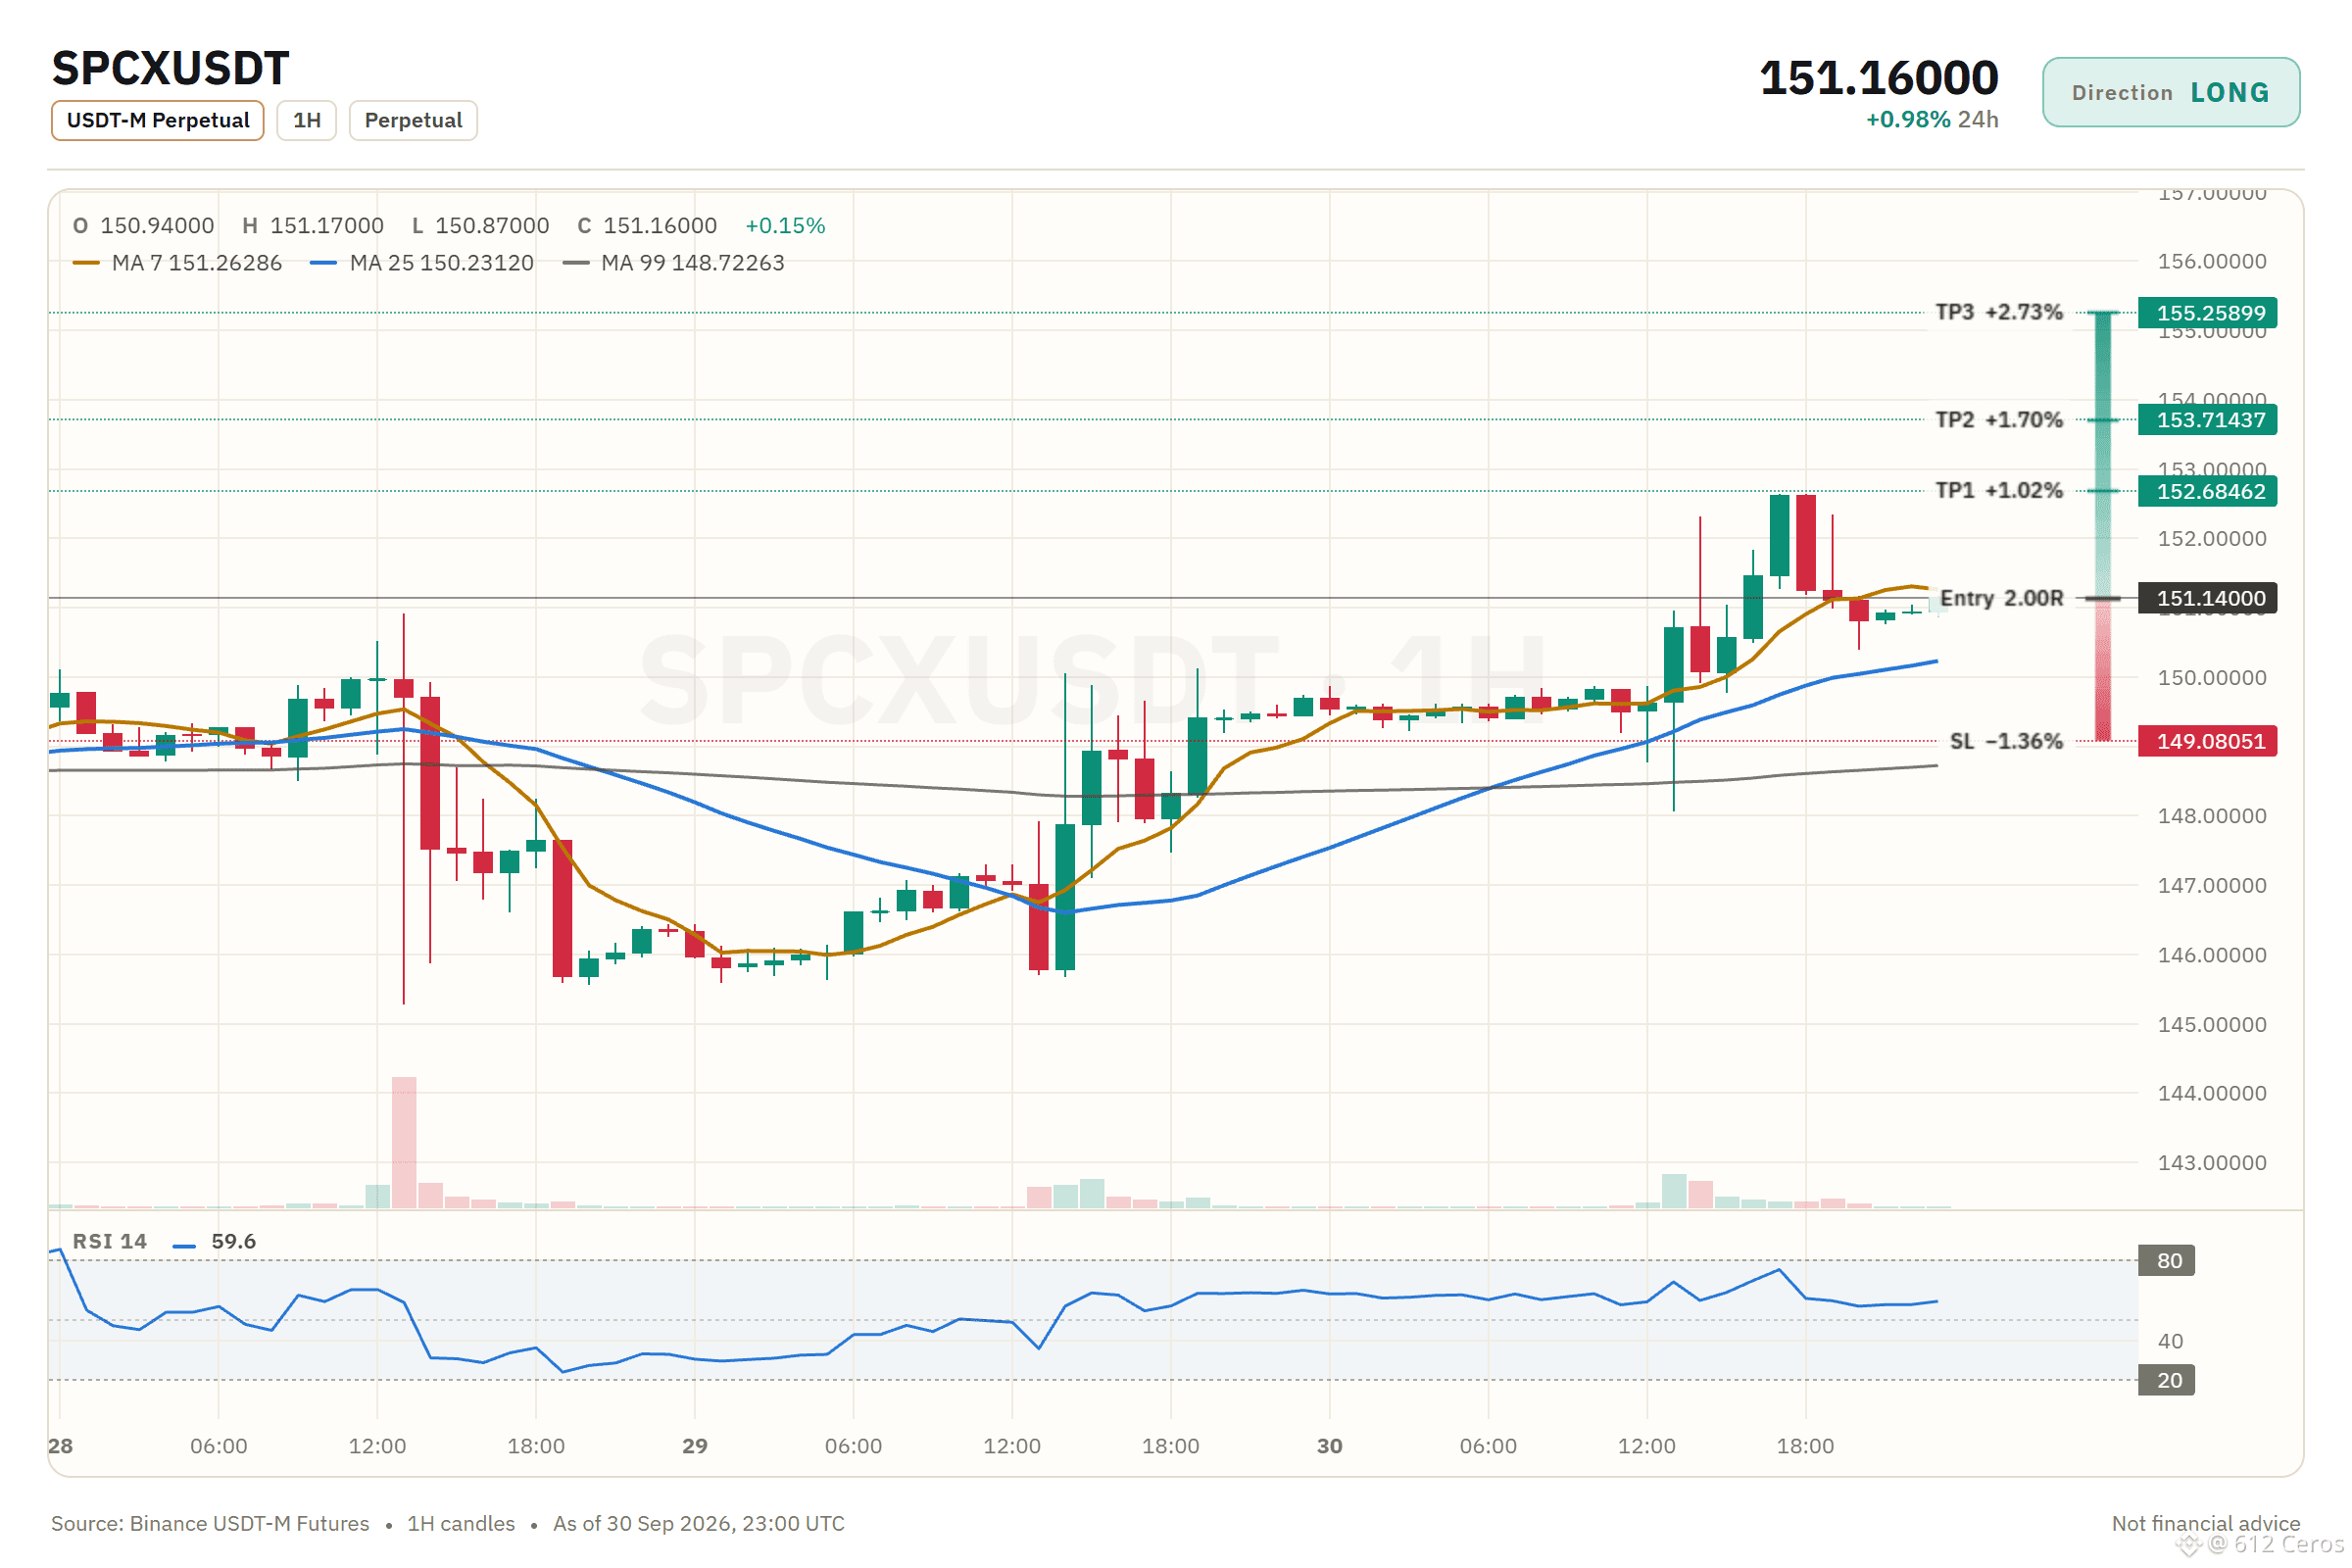
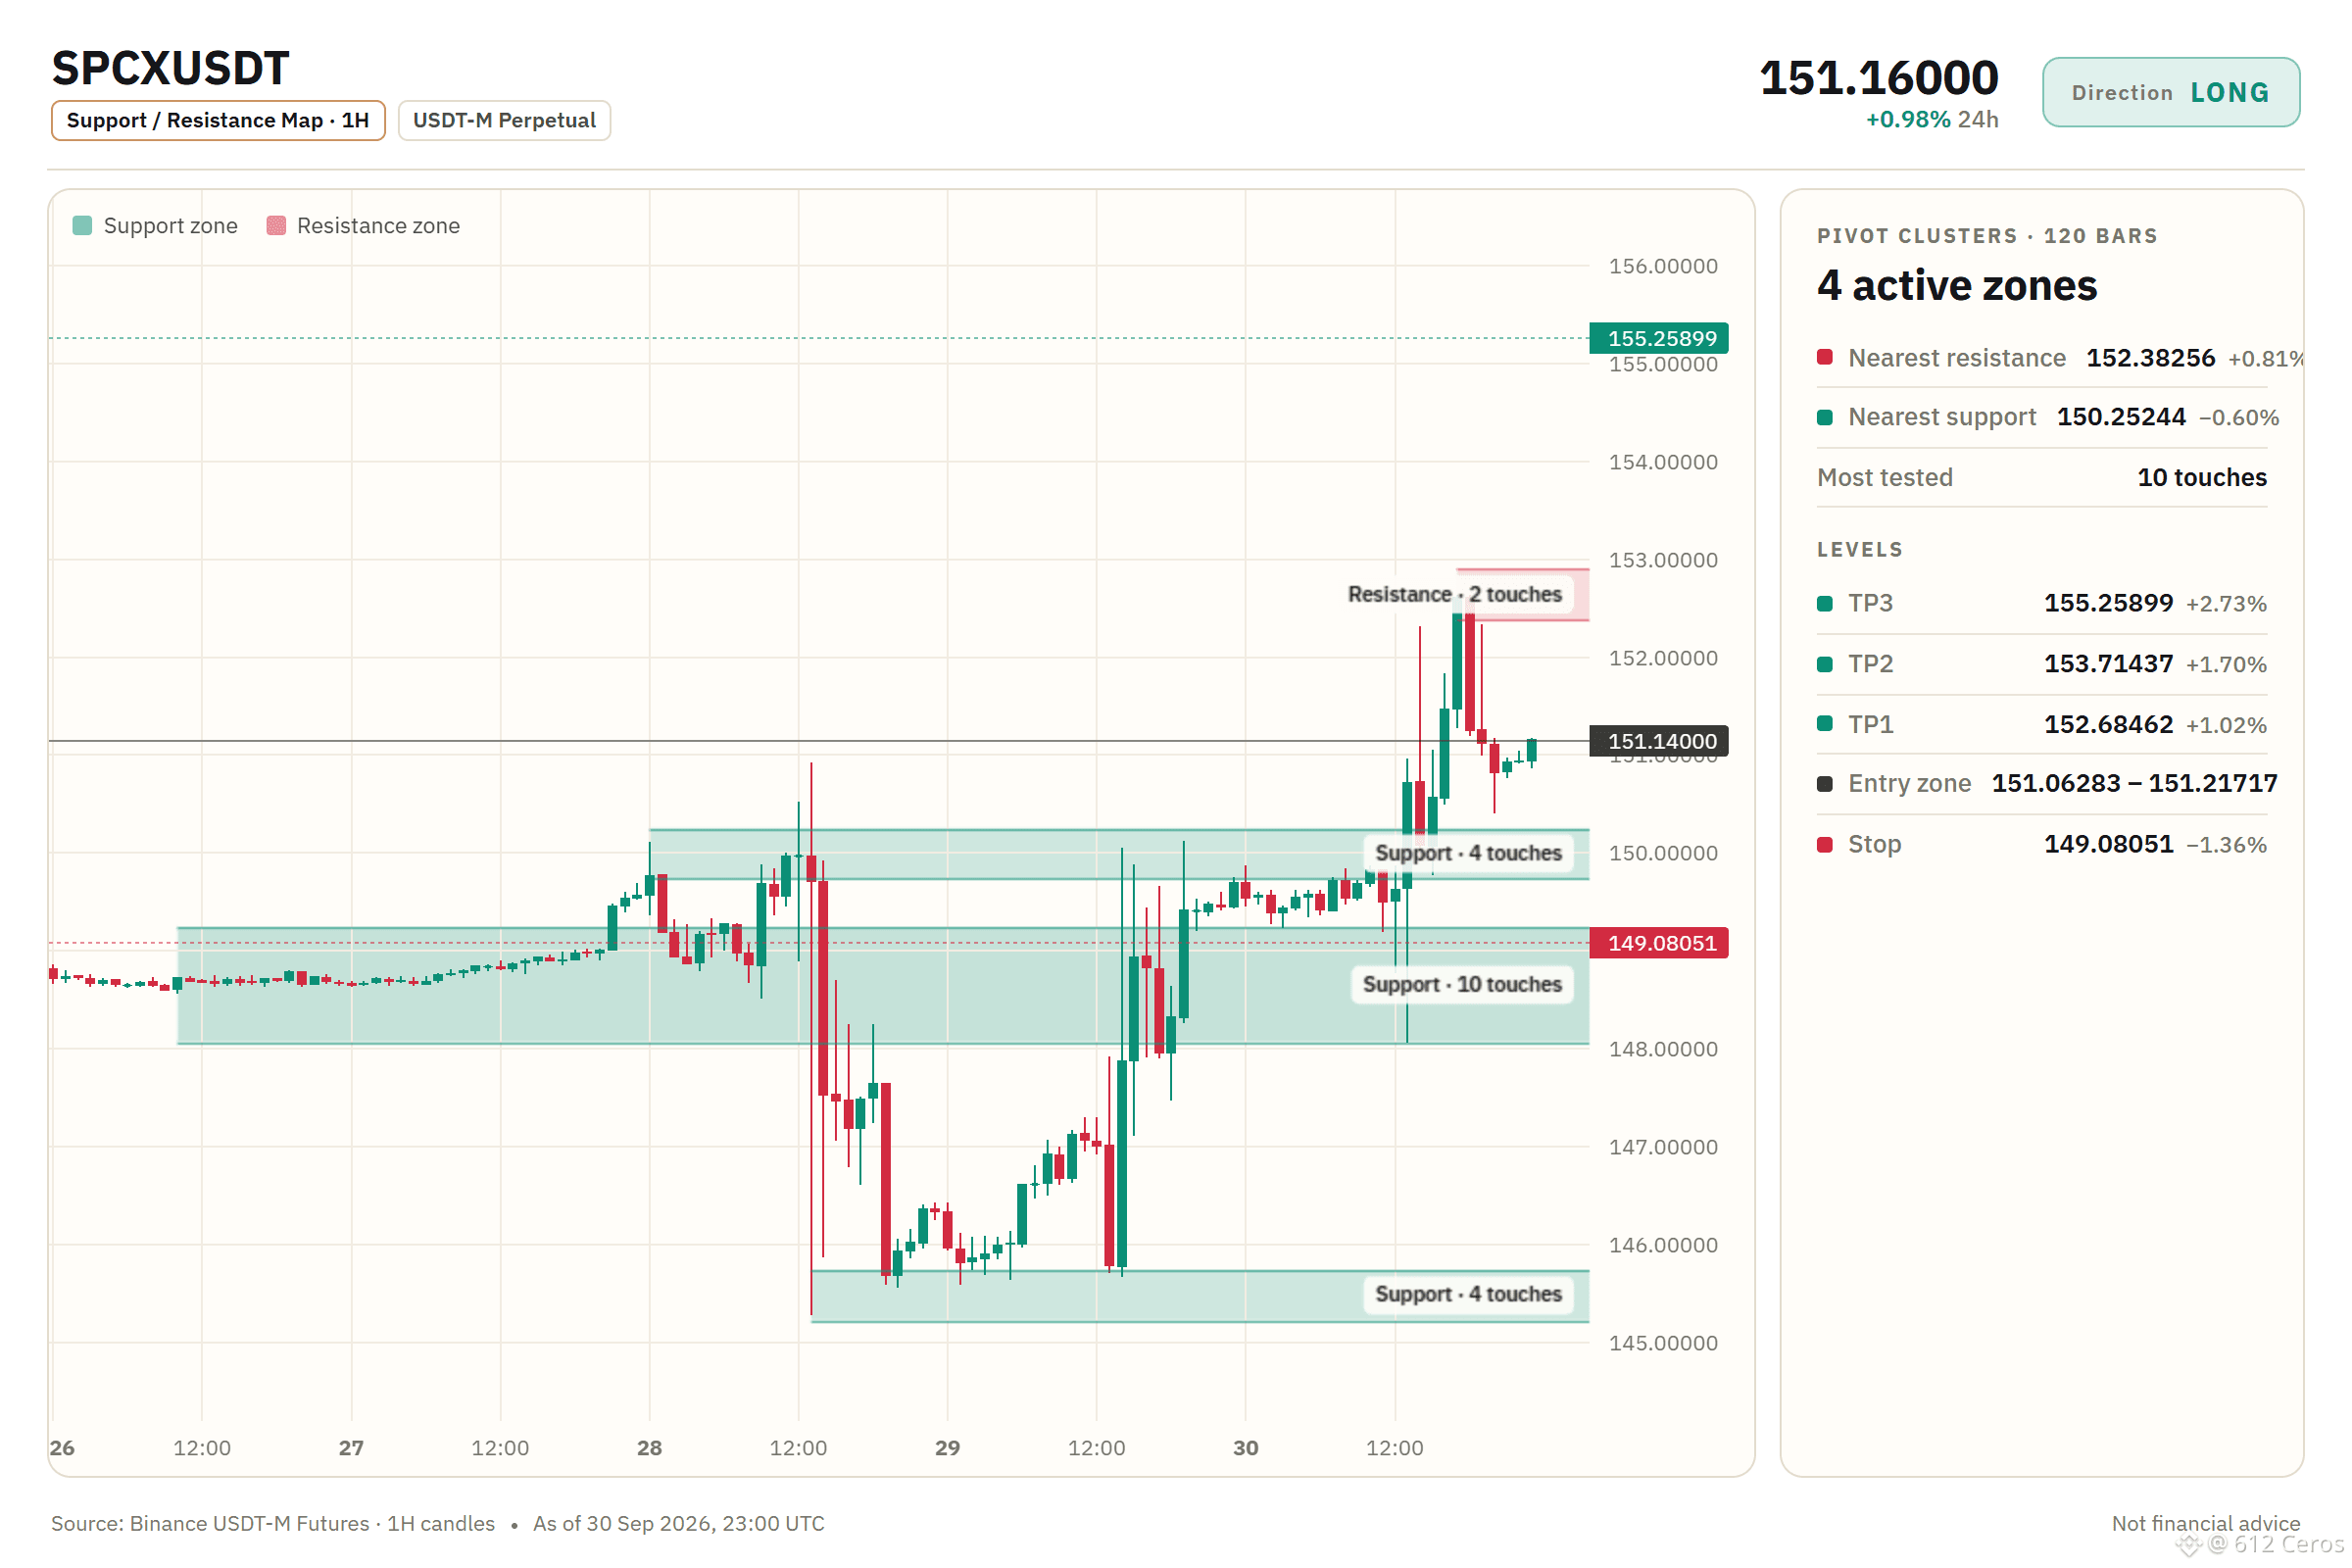
SPCX is range-bound, but the 4h setup says otherwise
🟢 LONG $SPCX /USDT: expecting price to go UP
Bias: LONG · Leaning · 4/11 signals agree, 0 against, 7 undecided
📍 Entry: 151.06283 – 151.21717 · limit order inside the zone, don't chase
🎯 TP1: 152.68462 (+1.0%) · take about half, then move SL to entry
🎯 TP2: 153.71437 (+1.7%) · take most of the rest
🎯 TP3: 155.25899 (+2.7%) · final target
🛑 SL: 149.08051 (-1.4%) · close everything, never move it further away
⚖️ Reward vs risk: 0.75R / 1.25R / 2R at TP1 / TP2 / TP3
TP1 alone pays less than the stop costs, which is why the stop moves to entry after it.
⏳ Timing: 15m momentum already agrees. Skip it if TP1 prints before you get filled.
⚠️ Leaning only: 7 of 11 signals are still undecided. Keep size light.
Why LONG? SPCX checklist: 4/11 signals agree, 0 against, 7 undecided
✅ 4h trend: price > EMA50 > EMA200, bullish stack → the swing trend is up
✅ 4h RSI: 63.1, bullish momentum (above 55) → buyers have the momentum
✅ 1h RSI: 59.6, bullish momentum (above 55) → buyers have the momentum
✅ Relative strength vs BTC: outperforming, +1.16% vs BTC over the last day → stronger than BTC
⚠️ The idea is wrong if price reaches the stop at 149.08051
Verdict: The strongest support is the 4h bullish trend with price above both EMAs and 4h RSI at 63.1 showing buyer momentum. The main against factor is the mixed 1h trend with EMAs not stacked, so conviction is moderate.
Over to you:
What is your SPCX level for this long, and do you see the 1h mixed trend as a problem?
Full setup on the chart 👇
{future}(SPCXUSDT)
📲 Want more of my latest signals? Join me here:
[https://app.binance.com/uni-qr/D26WbL9t](https://app.binance.com/uni-qr/D26WbL9t)
⚠️ Personal market analysis only. NFA — manage risk and DYOR.
Educational content, not investment advice or a recommendation to buy, sell, deposit, or withdraw any asset. No paid promotion or referral/affiliate links.
SPCX is range-bound, but the 4h setup says otherwise
🟢 LONG $SPCX /USDT: expecting price to go UP
Bias: LONG · Leaning · 4/11 signals agree, 0 against, 7 undecided
📍 Entry: 151.06283 – 151.21717 · limit order inside the zone, don't chase
🎯 TP1: 152.68462 (+1.0%) · take about half, then move SL to entry
🎯 TP2: 153.71437 (+1.7%) · take most of the rest
🎯 TP3: 155.25899 (+2.7%) · final target
🛑 SL: 149.08051 (-1.4%) · close everything, never move it further away
⚖️ Reward vs risk: 0.75R / 1.25R / 2R at TP1 / TP2 / TP3
TP1 alone pays less than the stop costs, which is why the stop moves to entry after it.
⏳ Timing: 15m momentum already agrees. Skip it if TP1 prints before you get filled.
⚠️ Leaning only: 7 of 11 signals are still undecided. Keep size light.
Why LONG? SPCX checklist: 4/11 signals agree, 0 against, 7 undecided
✅ 4h trend: price > EMA50 > EMA200, bullish stack → the swing trend is up
✅ 4h RSI: 63.1, bullish momentum (above 55) → buyers have the momentum
✅ 1h RSI: 59.6, bullish momentum (above 55) → buyers have the momentum
✅ Relative strength vs BTC: outperforming, +1.16% vs BTC over the last day → stronger than BTC
⚠️ The idea is wrong if price reaches the stop at 149.08051
Verdict: The strongest support is the 4h bullish trend with price above both EMAs and 4h RSI at 63.1 showing buyer momentum. The main against factor is the mixed 1h trend with EMAs not stacked, so conviction is moderate.
Over to you:
What is your SPCX level for this long, and do you see the 1h mixed trend as a problem?
Full setup on the chart 👇
📲 Want more of my latest signals? Join me here:
https://app.binance.com/uni-qr/D26WbL9t
⚠️ Personal market analysis only. NFA — manage risk and DYOR.
Educational content, not investment advice or a recommendation to buy, sell, deposit, or withdraw any asset. No paid promotion or referral/affiliate links.
🟢 LONG $SPCX /USDT: expecting price to go UP
Bias: LONG · Leaning · 4/11 signals agree, 0 against, 7 undecided
📍 Entry: 151.06283 – 151.21717 · limit order inside the zone, don't chase
🎯 TP1: 152.68462 (+1.0%) · take about half, then move SL to entry
🎯 TP2: 153.71437 (+1.7%) · take most of the rest
🎯 TP3: 155.25899 (+2.7%) · final target
🛑 SL: 149.08051 (-1.4%) · close everything, never move it further away
⚖️ Reward vs risk: 0.75R / 1.25R / 2R at TP1 / TP2 / TP3
TP1 alone pays less than the stop costs, which is why the stop moves to entry after it.
⏳ Timing: 15m momentum already agrees. Skip it if TP1 prints before you get filled.
⚠️ Leaning only: 7 of 11 signals are still undecided. Keep size light.
Why LONG? SPCX checklist: 4/11 signals agree, 0 against, 7 undecided
✅ 4h trend: price > EMA50 > EMA200, bullish stack → the swing trend is up
✅ 4h RSI: 63.1, bullish momentum (above 55) → buyers have the momentum
✅ 1h RSI: 59.6, bullish momentum (above 55) → buyers have the momentum
✅ Relative strength vs BTC: outperforming, +1.16% vs BTC over the last day → stronger than BTC
⚠️ The idea is wrong if price reaches the stop at 149.08051
Verdict: The strongest support is the 4h bullish trend with price above both EMAs and 4h RSI at 63.1 showing buyer momentum. The main against factor is the mixed 1h trend with EMAs not stacked, so conviction is moderate.
Over to you:
What is your SPCX level for this long, and do you see the 1h mixed trend as a problem?
Full setup on the chart 👇
📲 Want more of my latest signals? Join me here:
https://app.binance.com/uni-qr/D26WbL9t
⚠️ Personal market analysis only. NFA — manage risk and DYOR.
Educational content, not investment advice or a recommendation to buy, sell, deposit, or withdraw any asset. No paid promotion or referral/affiliate links.
4
1.6k
·
--
Baissier
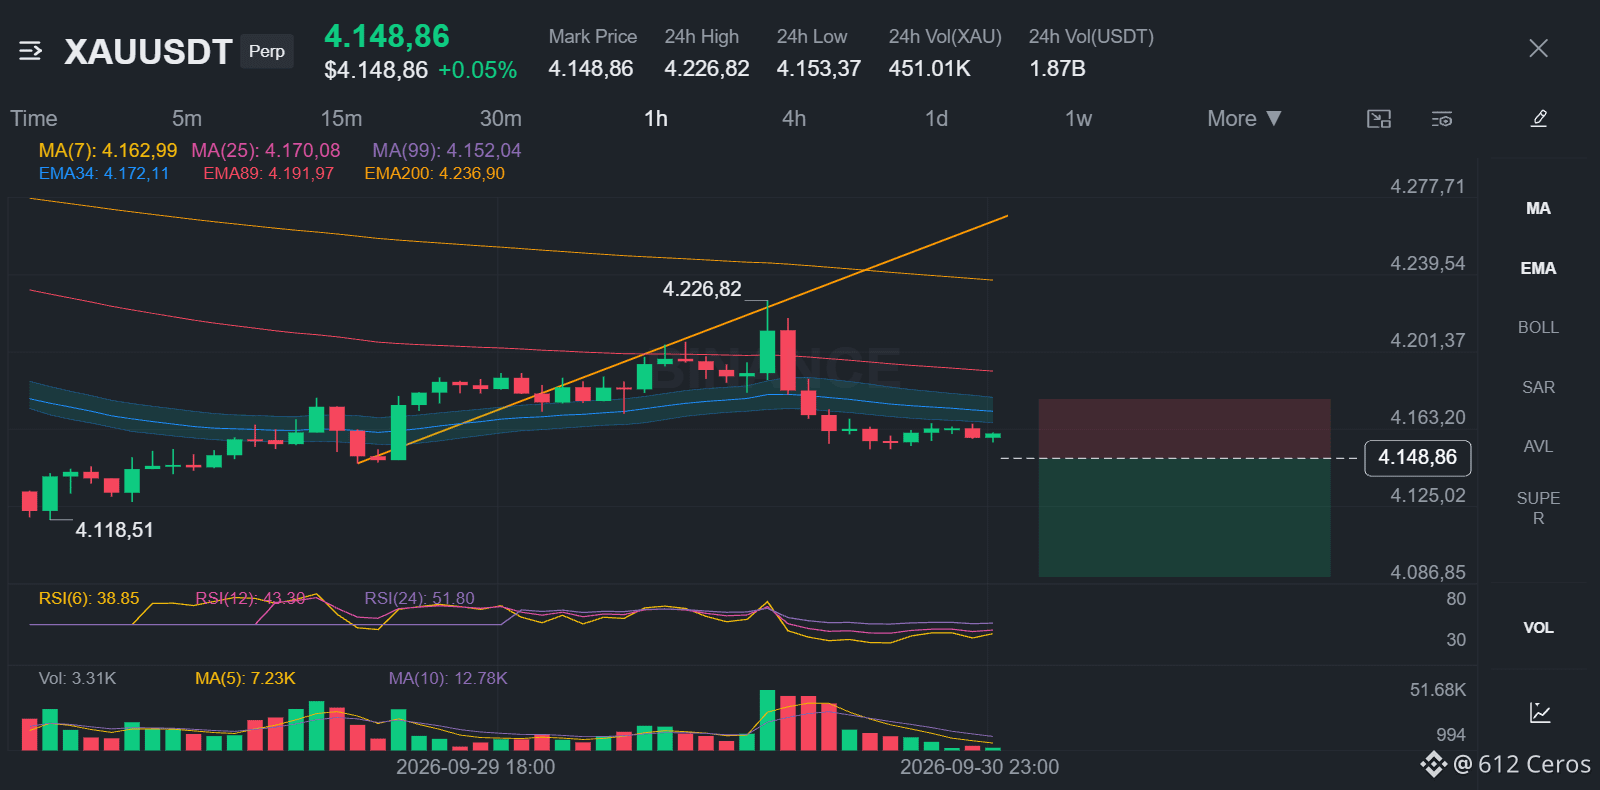
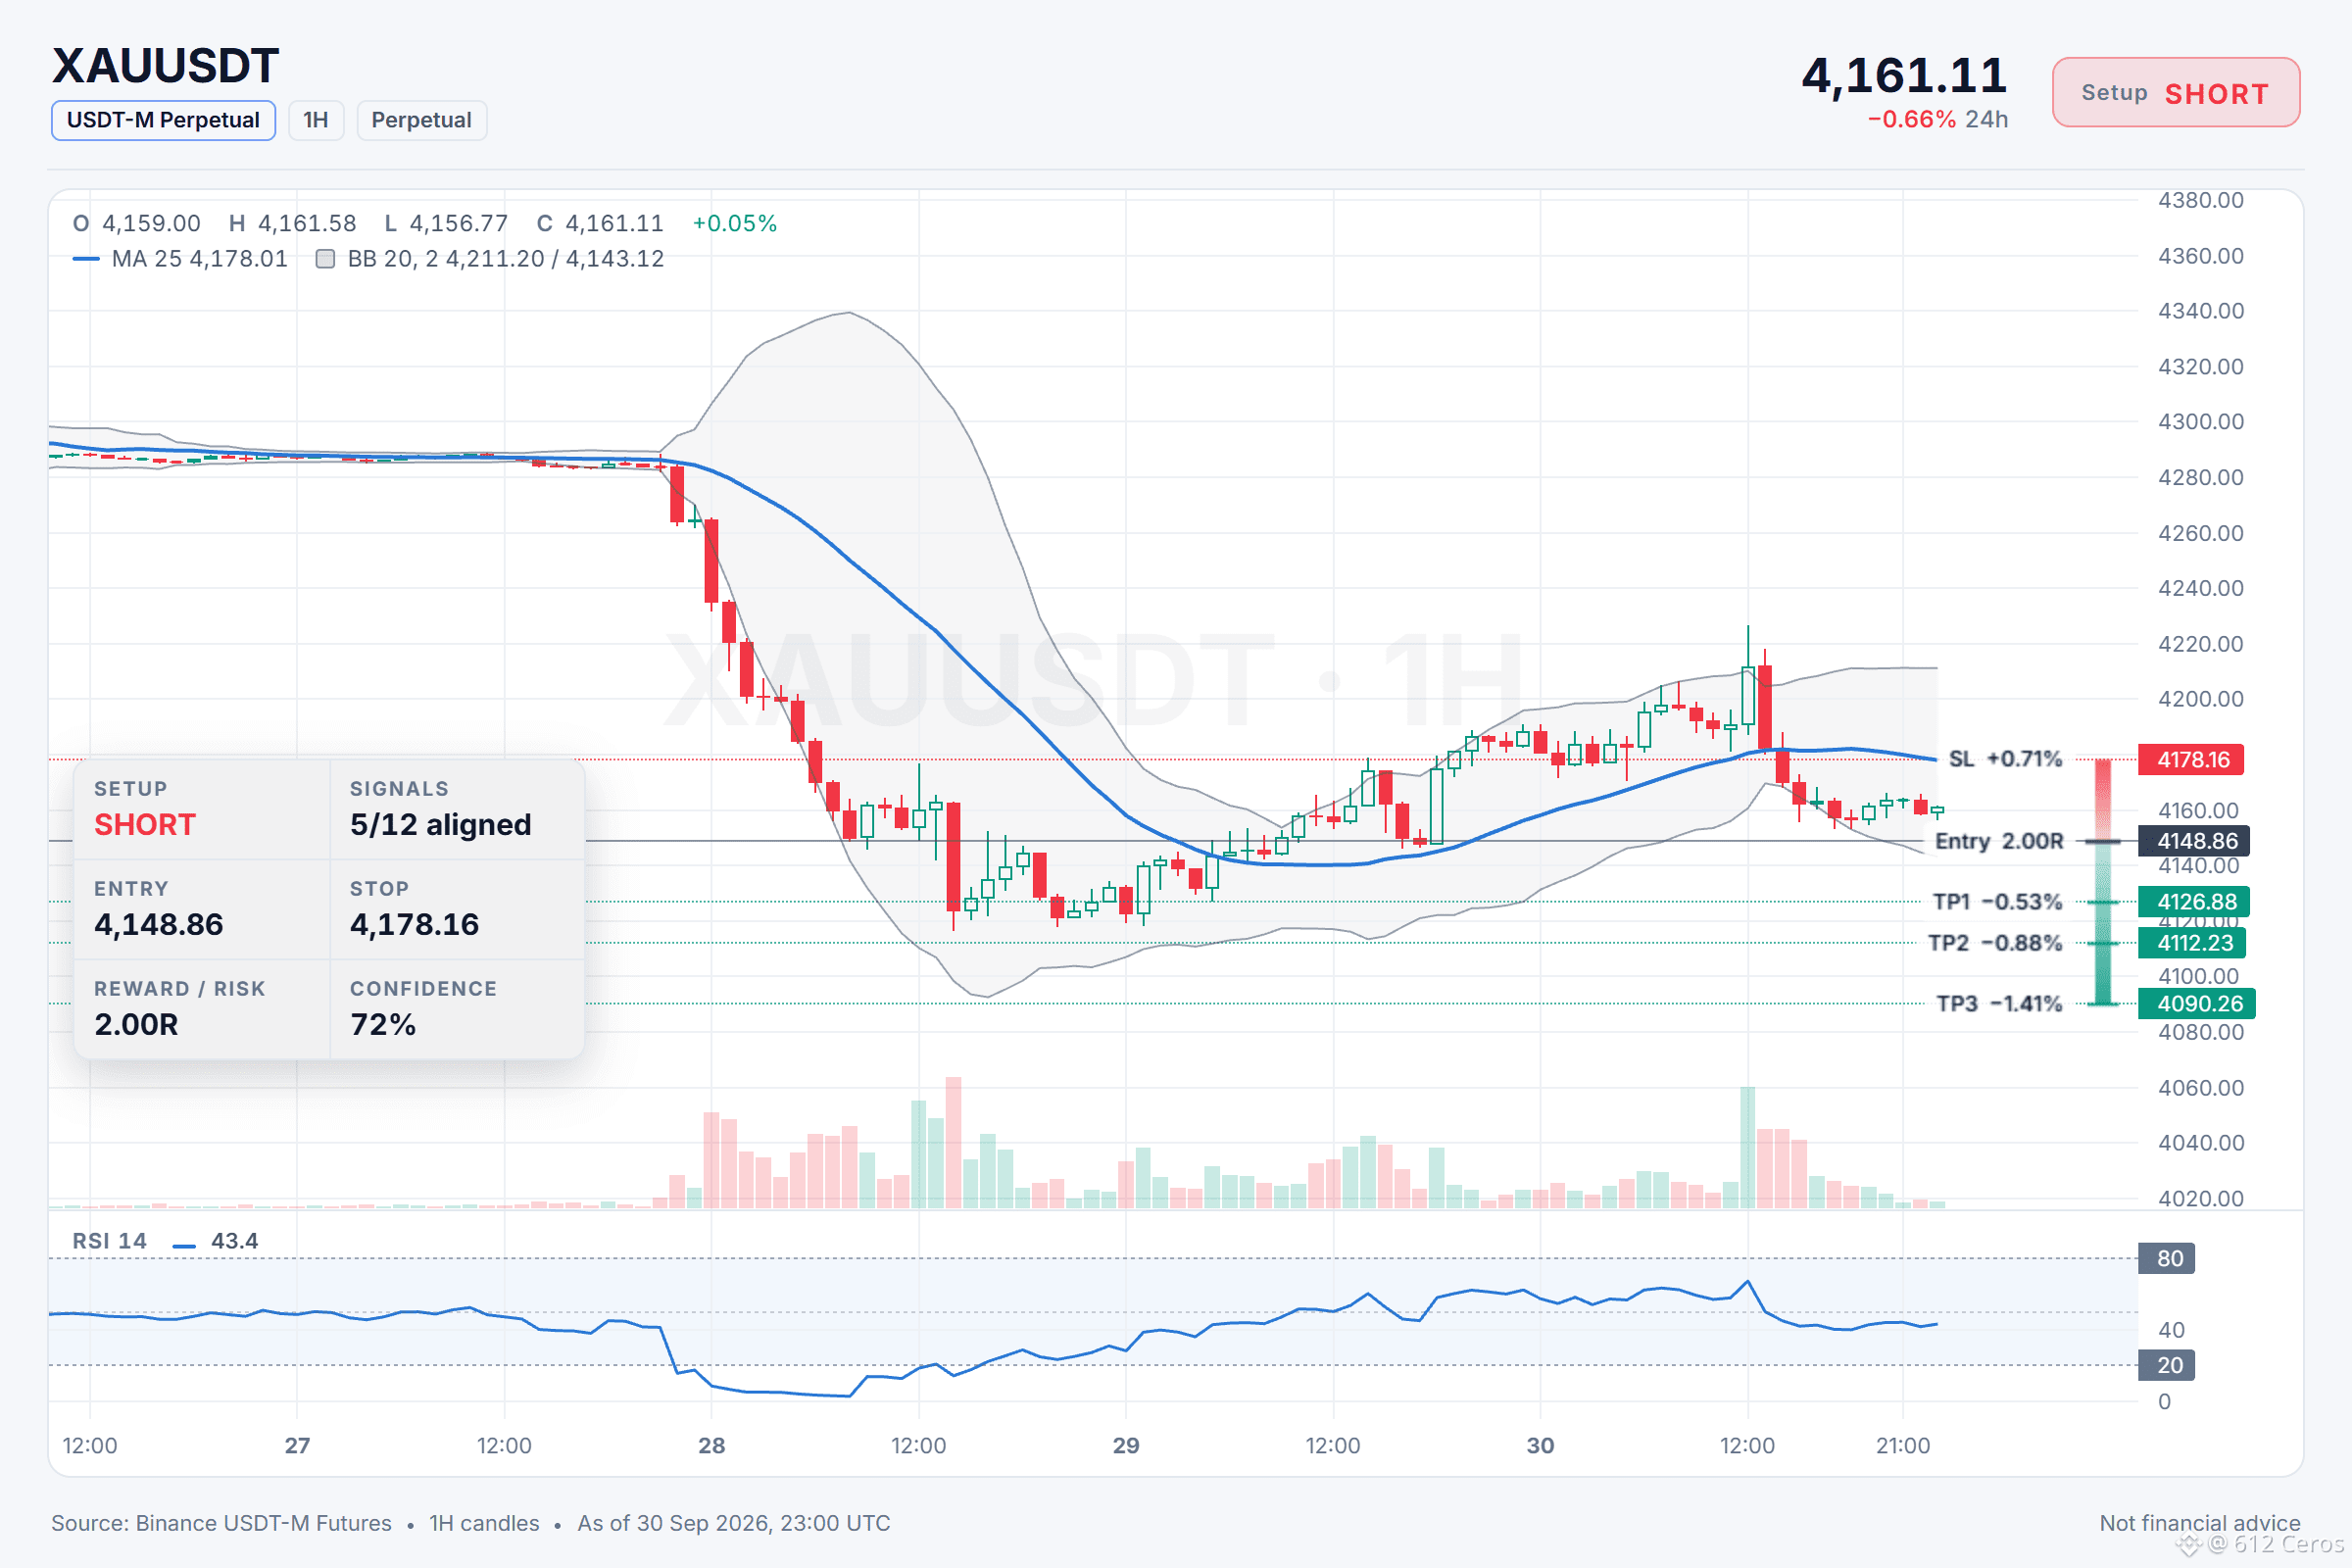
XAU is grinding lower, and the 1h setup is leaning short now
🔴 SHORT $XAU /USDT: expecting price to go DOWN
Bias: SHORT · Leaning · 5/12 signals agree, 0 against, 7 undecided
📍 Entry: 4147.88 – 4149.84 · limit order inside the zone, don't chase
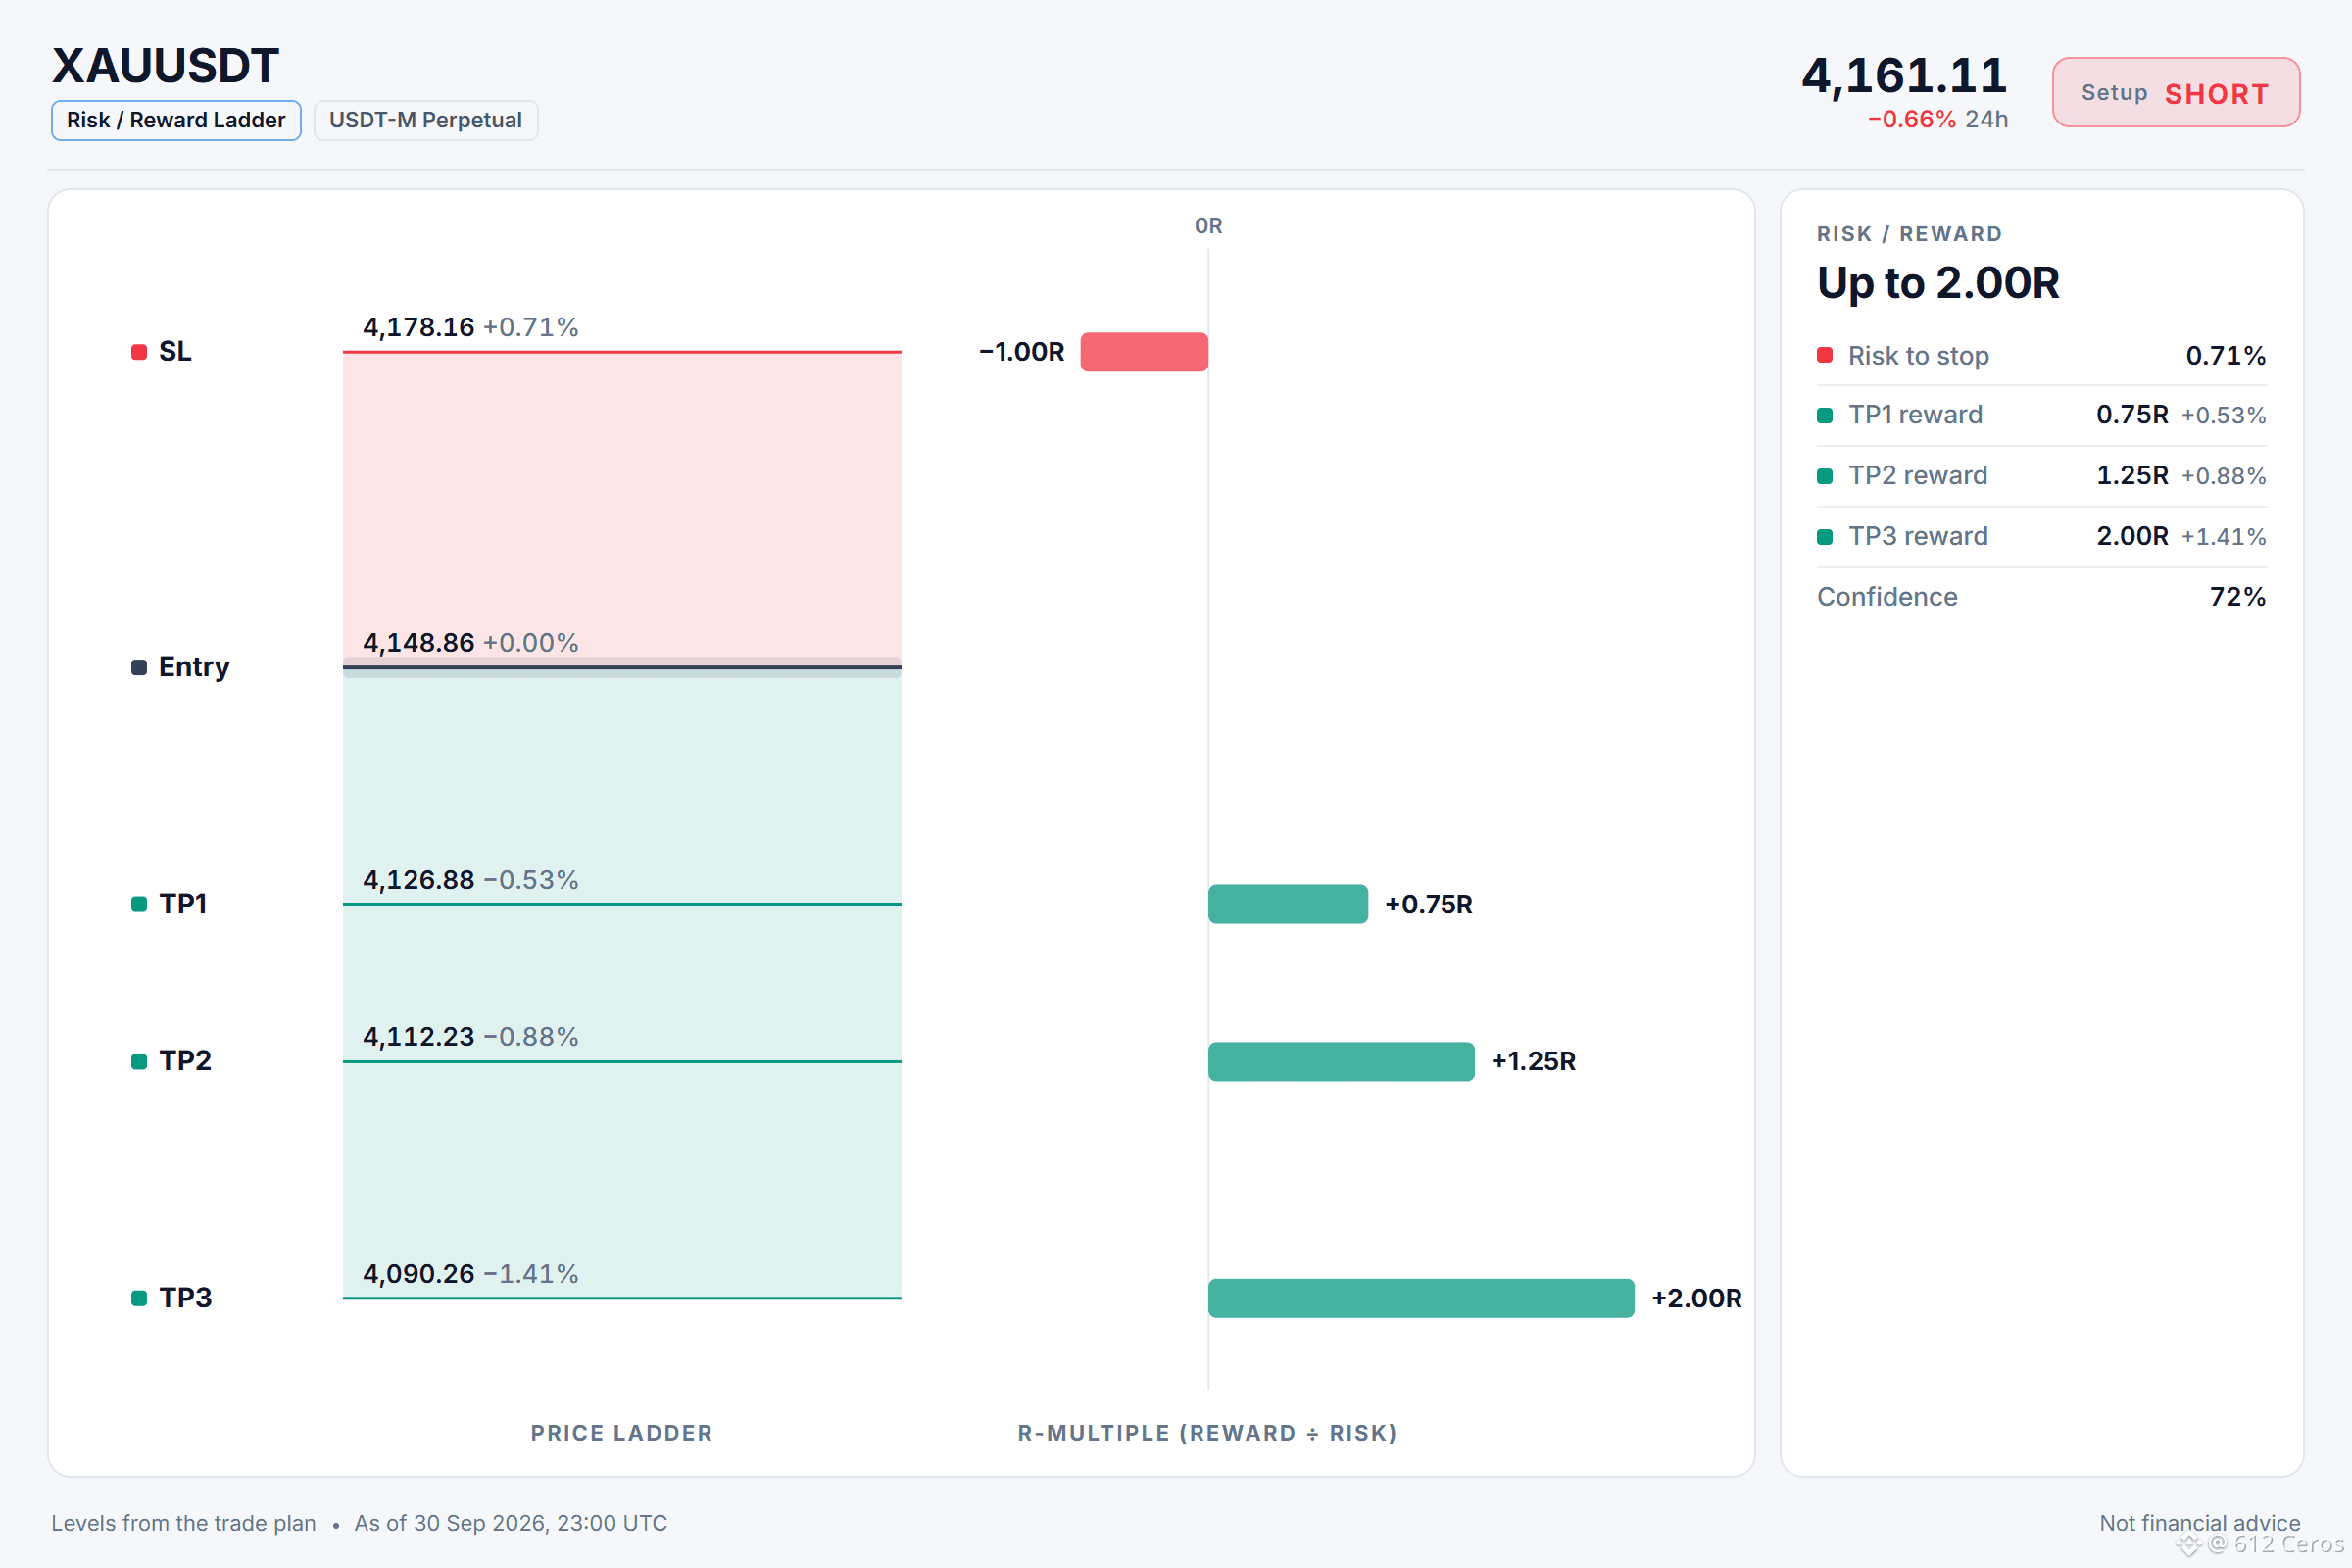
🎯 TP1: 4126.88 (-0.5%) · take about half, then move SL to entry
🎯 TP2: 4112.23 (-0.9%) · take most of the rest
🎯 TP3: 4090.26 (-1.4%) · final target
🛑 SL: 4178.16 (+0.7%) · close everything, never move it further away
⚖️ Reward vs risk: 0.75R / 1.25R / 2R at TP1 / TP2 / TP3
TP1 alone pays less than the stop costs, which is why the stop moves to entry after it.
⏳ Timing: 15m momentum already agrees. Skip it if TP1 prints before you get filled.
⚠️ Leaning only: 7 of 12 signals are still undecided. Keep size light.
Why SHORT? Technical verdict: LEANING SHORT, 5/12 signals agree, 0 against, 7 undecided.
✅ Daily trend: price < EMA50 < EMA200, bearish stack → the big-picture trend is down
✅ 4h trend: price < EMA50 < EMA200, bearish stack → the swing trend is down
✅ 1h trend: price < EMA50 < EMA200, bearish stack → the short-term trend is down
🤔 Why short when the scorecard is only 5 out of 12 and the trend is leaning?
💡 The daily, 4h, and 1h trends are all bearish, stacked below their EMAs, giving a lean edge.
🤔 Where exactly should I place my entry?
💡 Between 4147.88 and 4149.84, with the invalidation at 4178.16 if the daily structure breaks.
Over to you:
Where is your invalidation for this XAU short, and do you think the 1h bearish stack holds?
Chart with every level 👇
{future}(XAUUSDT)
📲 Want more of my latest signals? Join me here:
[https://app.binance.com/uni-qr/D26WbL9t](https://app.binance.com/uni-qr/D26WbL9t)
⚠️ Personal market analysis only. NFA — manage risk and DYOR.
Educational content, not investment advice or a recommendation to buy, sell, deposit, or withdraw any asset. No paid promotion or referral/affiliate links.
XAU is grinding lower, and the 1h setup is leaning short now
🔴 SHORT $XAU /USDT: expecting price to go DOWN
Bias: SHORT · Leaning · 5/12 signals agree, 0 against, 7 undecided
📍 Entry: 4147.88 – 4149.84 · limit order inside the zone, don't chase
🎯 TP1: 4126.88 (-0.5%) · take about half, then move SL to entry
🎯 TP2: 4112.23 (-0.9%) · take most of the rest
🎯 TP3: 4090.26 (-1.4%) · final target
🛑 SL: 4178.16 (+0.7%) · close everything, never move it further away
⚖️ Reward vs risk: 0.75R / 1.25R / 2R at TP1 / TP2 / TP3
TP1 alone pays less than the stop costs, which is why the stop moves to entry after it.
⏳ Timing: 15m momentum already agrees. Skip it if TP1 prints before you get filled.
⚠️ Leaning only: 7 of 12 signals are still undecided. Keep size light.
Why SHORT? Technical verdict: LEANING SHORT, 5/12 signals agree, 0 against, 7 undecided.
✅ Daily trend: price < EMA50 < EMA200, bearish stack → the big-picture trend is down
✅ 4h trend: price < EMA50 < EMA200, bearish stack → the swing trend is down
✅ 1h trend: price < EMA50 < EMA200, bearish stack → the short-term trend is down
🤔 Why short when the scorecard is only 5 out of 12 and the trend is leaning?
💡 The daily, 4h, and 1h trends are all bearish, stacked below their EMAs, giving a lean edge.
🤔 Where exactly should I place my entry?
💡 Between 4147.88 and 4149.84, with the invalidation at 4178.16 if the daily structure breaks.
Over to you:
Where is your invalidation for this XAU short, and do you think the 1h bearish stack holds?
Chart with every level 👇
📲 Want more of my latest signals? Join me here:
https://app.binance.com/uni-qr/D26WbL9t
⚠️ Personal market analysis only. NFA — manage risk and DYOR.
Educational content, not investment advice or a recommendation to buy, sell, deposit, or withdraw any asset. No paid promotion or referral/affiliate links.
🔴 SHORT $XAU /USDT: expecting price to go DOWN
Bias: SHORT · Leaning · 5/12 signals agree, 0 against, 7 undecided
📍 Entry: 4147.88 – 4149.84 · limit order inside the zone, don't chase
🎯 TP1: 4126.88 (-0.5%) · take about half, then move SL to entry
🎯 TP2: 4112.23 (-0.9%) · take most of the rest
🎯 TP3: 4090.26 (-1.4%) · final target
🛑 SL: 4178.16 (+0.7%) · close everything, never move it further away
⚖️ Reward vs risk: 0.75R / 1.25R / 2R at TP1 / TP2 / TP3
TP1 alone pays less than the stop costs, which is why the stop moves to entry after it.
⏳ Timing: 15m momentum already agrees. Skip it if TP1 prints before you get filled.
⚠️ Leaning only: 7 of 12 signals are still undecided. Keep size light.
Why SHORT? Technical verdict: LEANING SHORT, 5/12 signals agree, 0 against, 7 undecided.
✅ Daily trend: price < EMA50 < EMA200, bearish stack → the big-picture trend is down
✅ 4h trend: price < EMA50 < EMA200, bearish stack → the swing trend is down
✅ 1h trend: price < EMA50 < EMA200, bearish stack → the short-term trend is down
🤔 Why short when the scorecard is only 5 out of 12 and the trend is leaning?
💡 The daily, 4h, and 1h trends are all bearish, stacked below their EMAs, giving a lean edge.
🤔 Where exactly should I place my entry?
💡 Between 4147.88 and 4149.84, with the invalidation at 4178.16 if the daily structure breaks.
Over to you:
Where is your invalidation for this XAU short, and do you think the 1h bearish stack holds?
Chart with every level 👇
📲 Want more of my latest signals? Join me here:
https://app.binance.com/uni-qr/D26WbL9t
⚠️ Personal market analysis only. NFA — manage risk and DYOR.
Educational content, not investment advice or a recommendation to buy, sell, deposit, or withdraw any asset. No paid promotion or referral/affiliate links.
2
979
·
--
Haussier
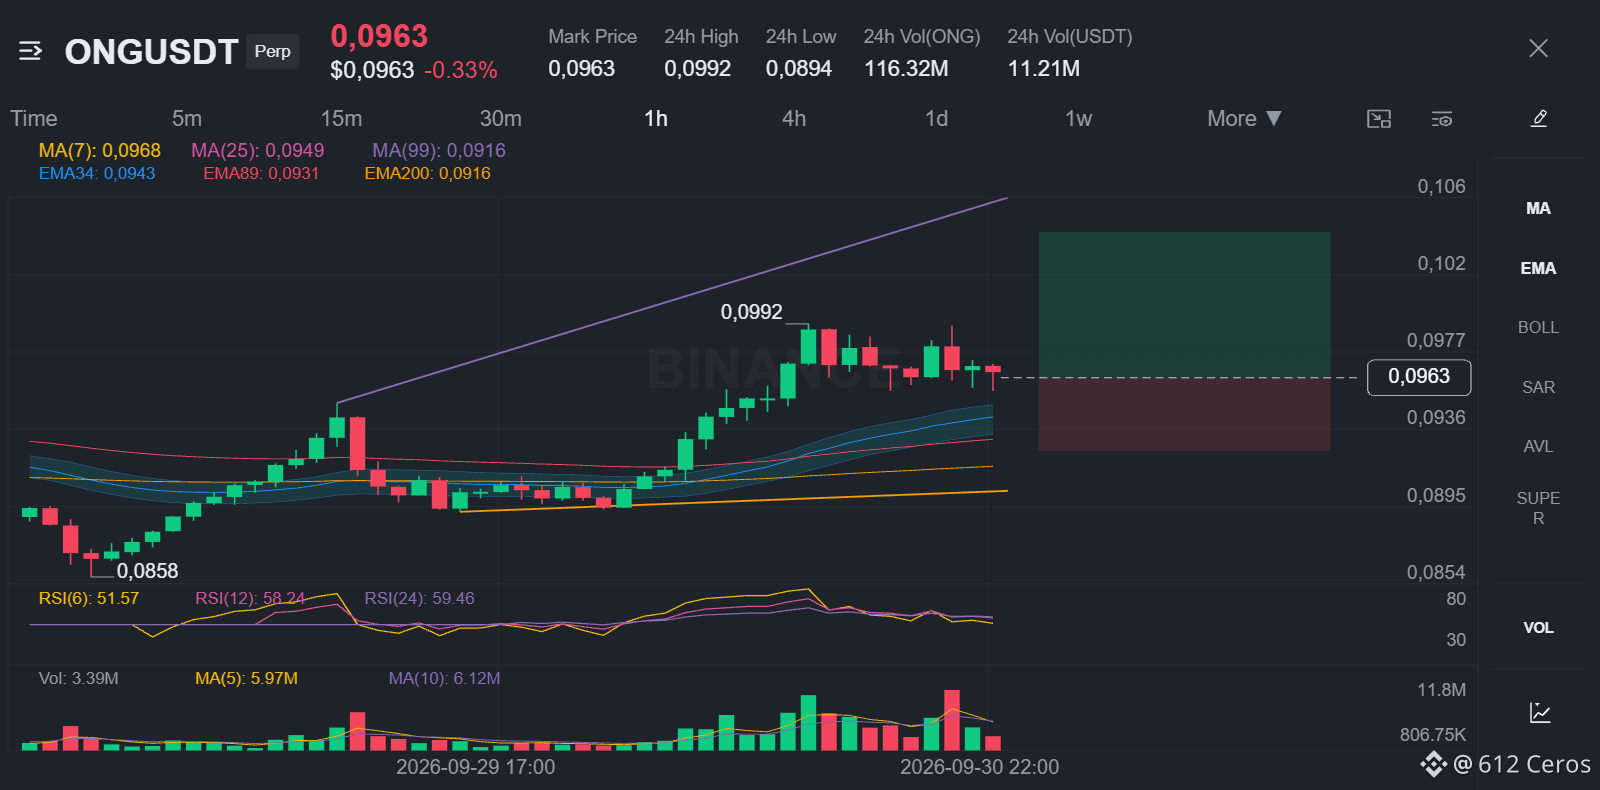
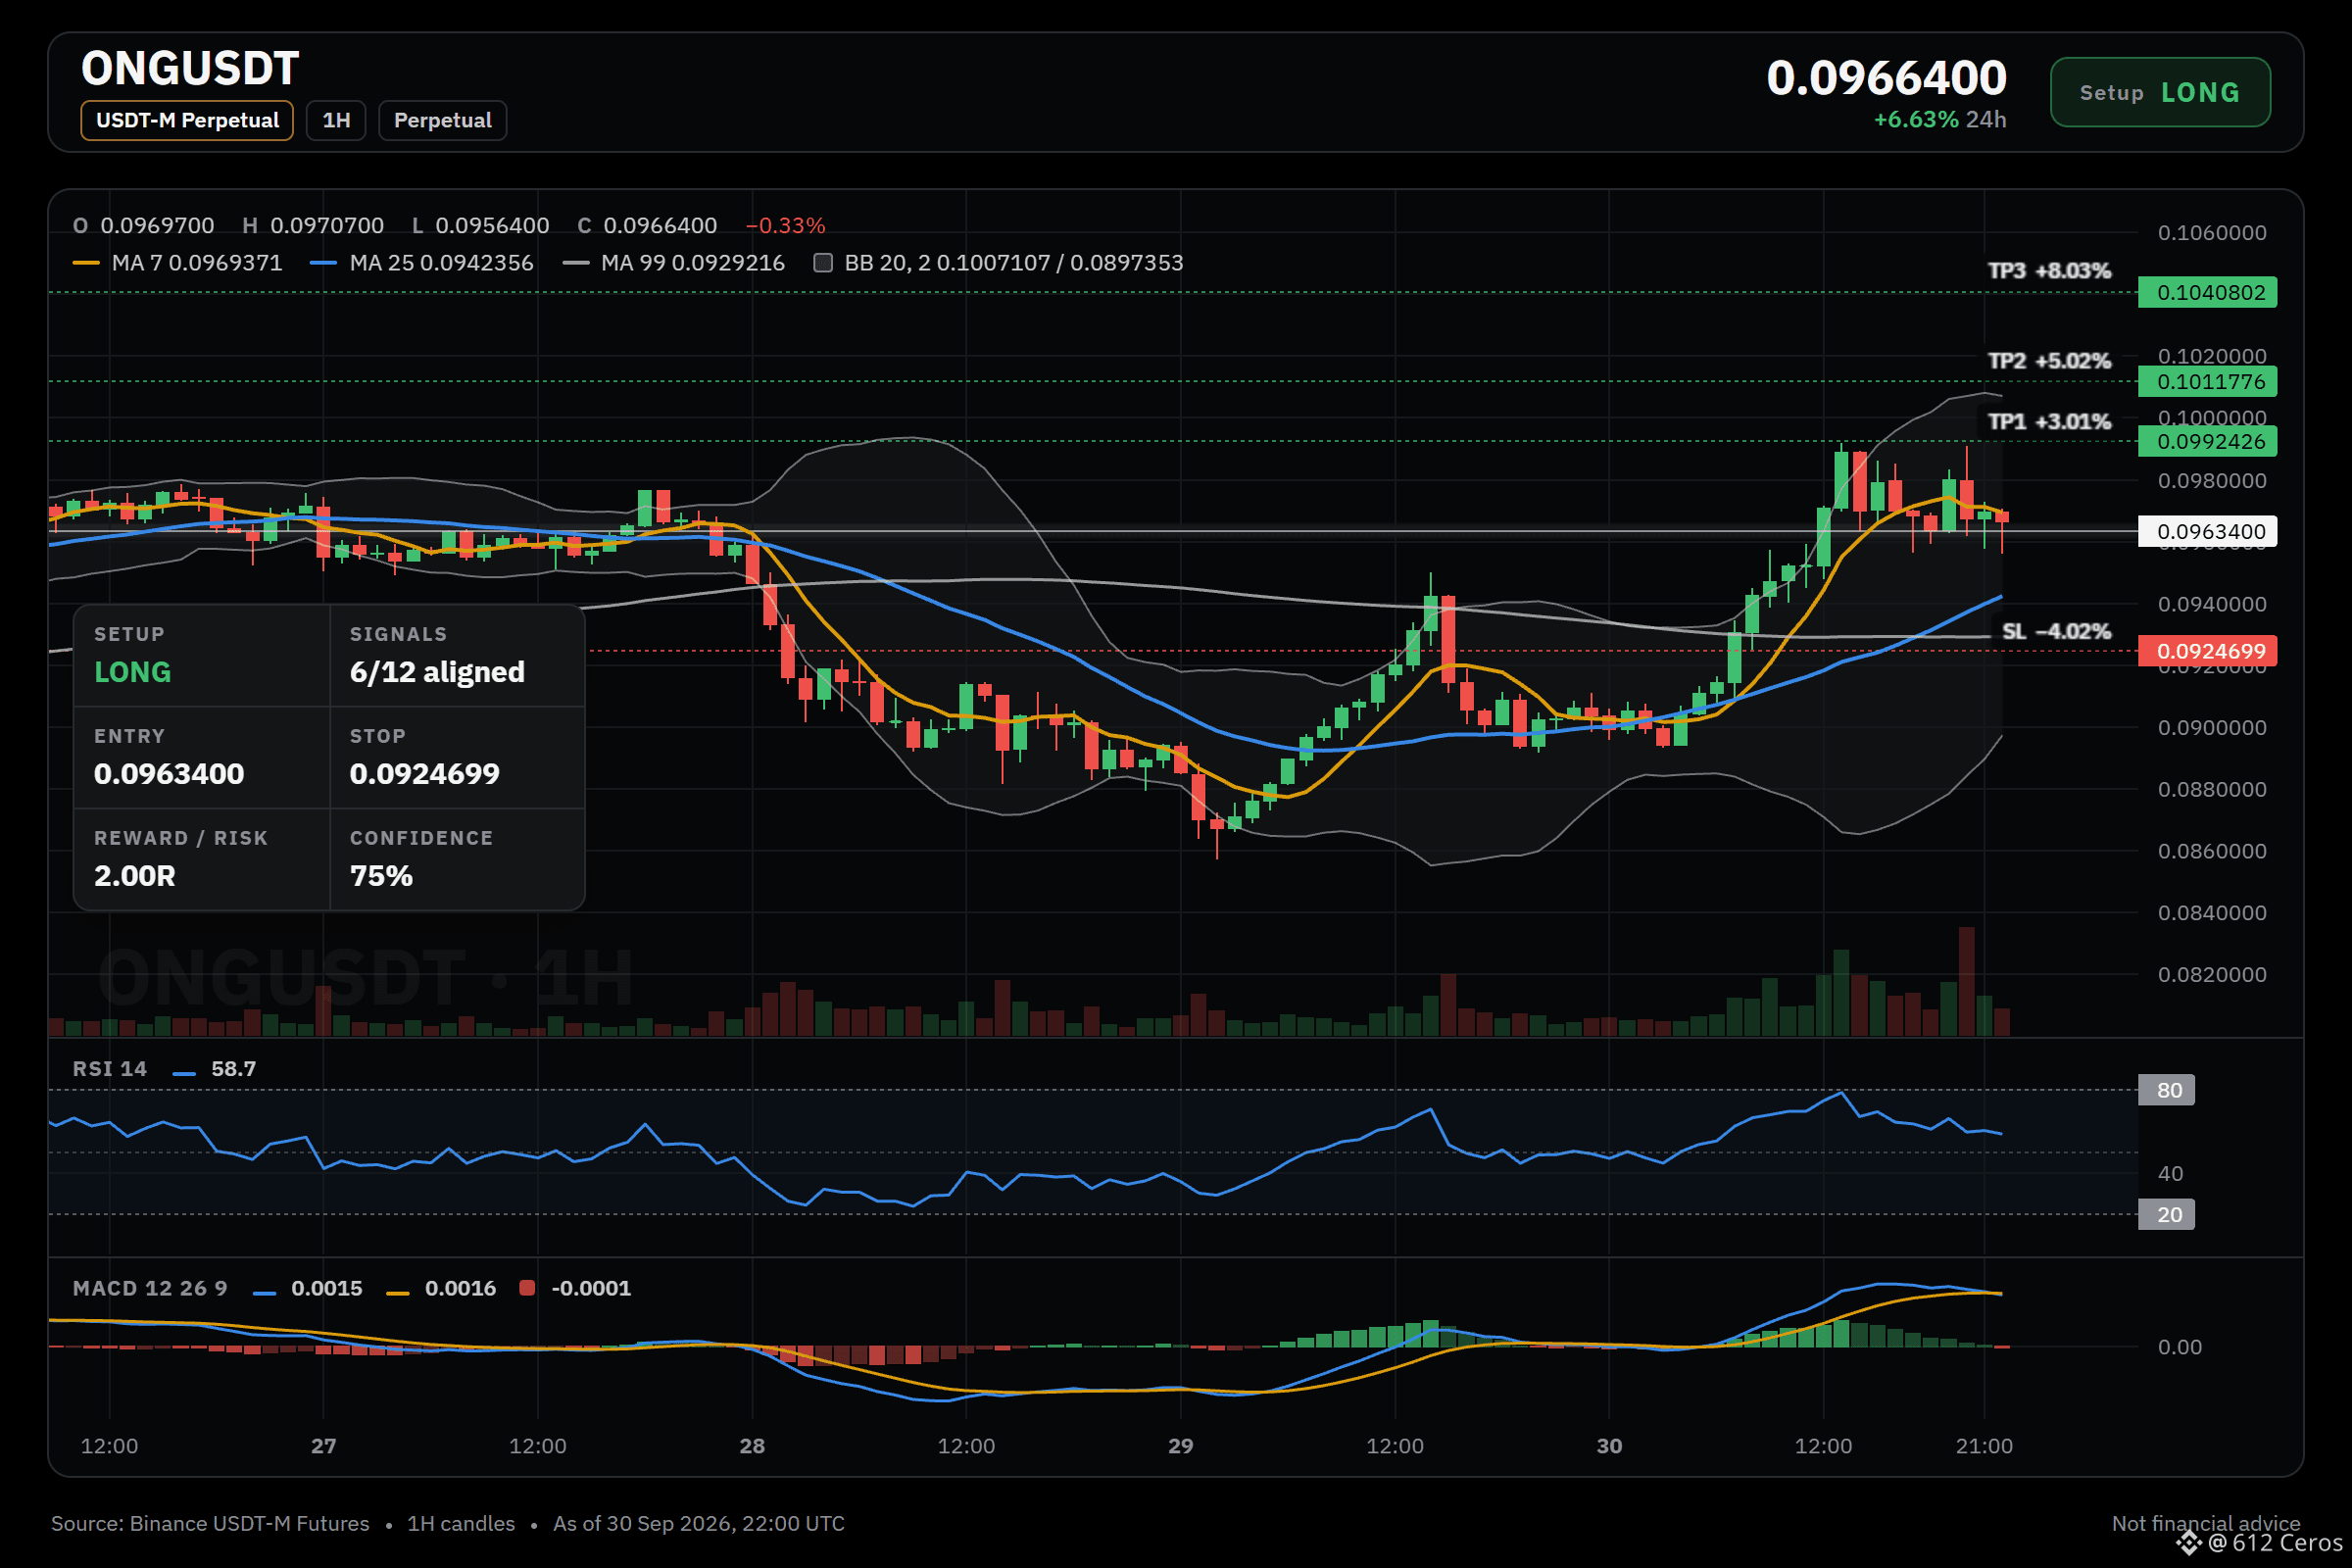
ONG long setup: the levels I'm watching
🟢 LONG $ONG /USDT: expecting price to go UP
Bias: LONG · Strong · 6/12 signals agree, 0 against, 6 undecided
📍 Entry: 0.0961126 – 0.0965674 · limit order inside the zone, don't chase
🎯 TP1: 0.0992426 (+3.0%) · take about half, then move SL to entry
🎯 TP2: 0.1011776 (+5.0%) · take most of the rest
🎯 TP3: 0.1040802 (+8.0%) · final target
🛑 SL: 0.0924699 (-4.0%) · close everything, never move it further away
⚖️ Reward vs risk: 0.75R / 1.25R / 2R at TP1 / TP2 / TP3
TP1 alone pays less than the stop costs, which is why the stop moves to entry after it.
⏳ Timing: 15m momentum has not turned yet, only enter inside the zone. Skip it if TP1 prints first.
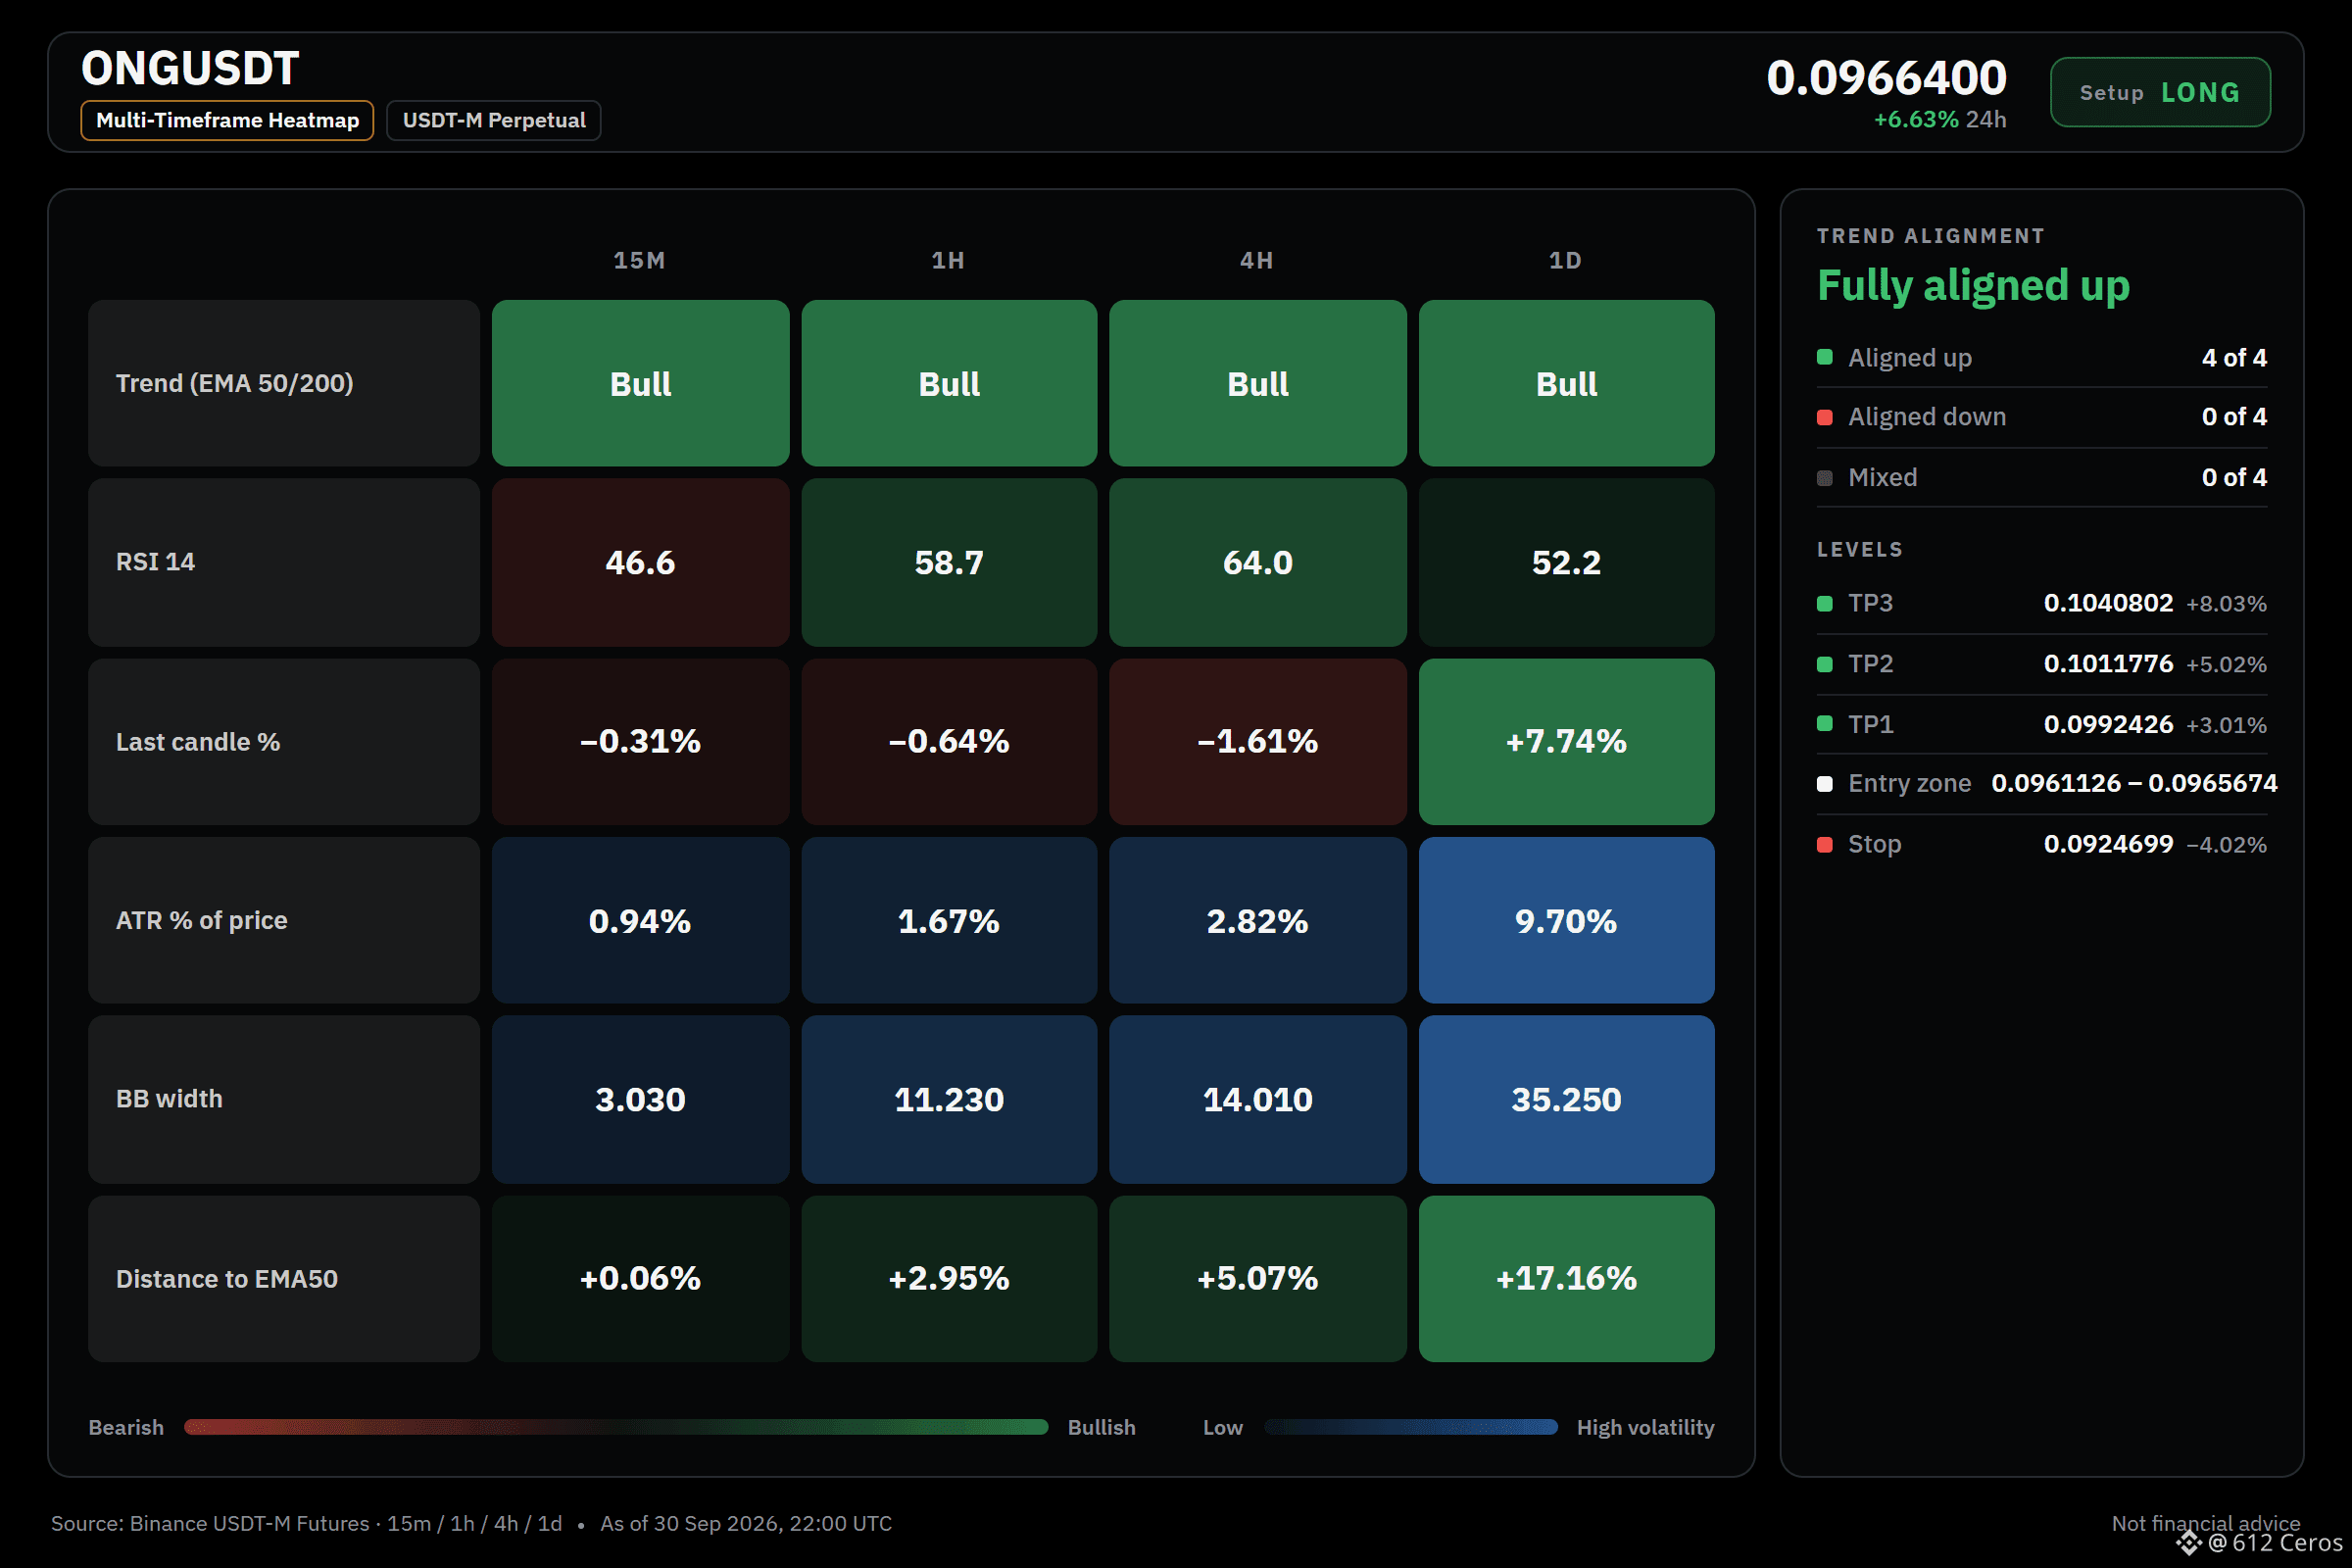
Why LONG? Technical verdict: STRONG LONG, 6/12 signals agree, 0 against, 6 undecided.
What supports it (6):
• Daily trend: price > EMA50 > EMA200, bullish stack → the big-picture trend is up
• 4h trend: price > EMA50 > EMA200, bullish stack → the swing trend is up
• 1h trend: price > EMA50 > EMA200, bullish stack → the short-term trend is up
• 4h RSI: 64.0, bullish momentum (above 55) → buyers have the momentum
• 1h RSI: 58.7, bullish momentum (above 55) → buyers have the momentum
• Relative strength vs BTC: outperforming, +6.57% vs BTC over the last day → stronger than BTC
No factor points the other way right now.
In plain words:
The daily trend reads bullish, and 6/12 signals aligned favour the long side. The plan is to work the 0.0961126 – 0.0965674 zone, scale out at 0.0992426 and 0.1011776, and stay patient for 0.1040802. A move through 0.0924699 means the idea is wrong and the stop does its job.
Debate:
Does ONG tag 0.0992426 first, or the stop?
Chart with every level 👇
{future}(ONGUSDT)
📲 Want more of my latest signals? Join me here:
[https://app.binance.com/uni-qr/D26WbL9t](https://app.binance.com/uni-qr/D26WbL9t)
⚠️ Personal market analysis only. NFA — manage risk and DYOR.
Educational content, not investment advice or a recommendation to buy, sell, deposit, or withdraw any asset. No paid promotion or referral/affiliate links.
ONG long setup: the levels I'm watching
🟢 LONG $ONG /USDT: expecting price to go UP
Bias: LONG · Strong · 6/12 signals agree, 0 against, 6 undecided
📍 Entry: 0.0961126 – 0.0965674 · limit order inside the zone, don't chase
🎯 TP1: 0.0992426 (+3.0%) · take about half, then move SL to entry
🎯 TP2: 0.1011776 (+5.0%) · take most of the rest
🎯 TP3: 0.1040802 (+8.0%) · final target
🛑 SL: 0.0924699 (-4.0%) · close everything, never move it further away
⚖️ Reward vs risk: 0.75R / 1.25R / 2R at TP1 / TP2 / TP3
TP1 alone pays less than the stop costs, which is why the stop moves to entry after it.
⏳ Timing: 15m momentum has not turned yet, only enter inside the zone. Skip it if TP1 prints first.
Why LONG? Technical verdict: STRONG LONG, 6/12 signals agree, 0 against, 6 undecided.
What supports it (6):
• Daily trend: price > EMA50 > EMA200, bullish stack → the big-picture trend is up
• 4h trend: price > EMA50 > EMA200, bullish stack → the swing trend is up
• 1h trend: price > EMA50 > EMA200, bullish stack → the short-term trend is up
• 4h RSI: 64.0, bullish momentum (above 55) → buyers have the momentum
• 1h RSI: 58.7, bullish momentum (above 55) → buyers have the momentum
• Relative strength vs BTC: outperforming, +6.57% vs BTC over the last day → stronger than BTC
No factor points the other way right now.
In plain words:
The daily trend reads bullish, and 6/12 signals aligned favour the long side. The plan is to work the 0.0961126 – 0.0965674 zone, scale out at 0.0992426 and 0.1011776, and stay patient for 0.1040802. A move through 0.0924699 means the idea is wrong and the stop does its job.
Debate:
Does ONG tag 0.0992426 first, or the stop?
Chart with every level 👇
📲 Want more of my latest signals? Join me here:
https://app.binance.com/uni-qr/D26WbL9t
⚠️ Personal market analysis only. NFA — manage risk and DYOR.
Educational content, not investment advice or a recommendation to buy, sell, deposit, or withdraw any asset. No paid promotion or referral/affiliate links.
🟢 LONG $ONG /USDT: expecting price to go UP
Bias: LONG · Strong · 6/12 signals agree, 0 against, 6 undecided
📍 Entry: 0.0961126 – 0.0965674 · limit order inside the zone, don't chase
🎯 TP1: 0.0992426 (+3.0%) · take about half, then move SL to entry
🎯 TP2: 0.1011776 (+5.0%) · take most of the rest
🎯 TP3: 0.1040802 (+8.0%) · final target
🛑 SL: 0.0924699 (-4.0%) · close everything, never move it further away
⚖️ Reward vs risk: 0.75R / 1.25R / 2R at TP1 / TP2 / TP3
TP1 alone pays less than the stop costs, which is why the stop moves to entry after it.
⏳ Timing: 15m momentum has not turned yet, only enter inside the zone. Skip it if TP1 prints first.
Why LONG? Technical verdict: STRONG LONG, 6/12 signals agree, 0 against, 6 undecided.
What supports it (6):
• Daily trend: price > EMA50 > EMA200, bullish stack → the big-picture trend is up
• 4h trend: price > EMA50 > EMA200, bullish stack → the swing trend is up
• 1h trend: price > EMA50 > EMA200, bullish stack → the short-term trend is up
• 4h RSI: 64.0, bullish momentum (above 55) → buyers have the momentum
• 1h RSI: 58.7, bullish momentum (above 55) → buyers have the momentum
• Relative strength vs BTC: outperforming, +6.57% vs BTC over the last day → stronger than BTC
No factor points the other way right now.
In plain words:
The daily trend reads bullish, and 6/12 signals aligned favour the long side. The plan is to work the 0.0961126 – 0.0965674 zone, scale out at 0.0992426 and 0.1011776, and stay patient for 0.1040802. A move through 0.0924699 means the idea is wrong and the stop does its job.
Debate:
Does ONG tag 0.0992426 first, or the stop?
Chart with every level 👇
📲 Want more of my latest signals? Join me here:
https://app.binance.com/uni-qr/D26WbL9t
⚠️ Personal market analysis only. NFA — manage risk and DYOR.
Educational content, not investment advice or a recommendation to buy, sell, deposit, or withdraw any asset. No paid promotion or referral/affiliate links.
1
749
·
--
Haussier
ACE long setup: the levels I'm watching
🟢 LONG $ACE /USDT: expecting price to go UP
Bias: LONG · Strong · 6/12 signals agree, 0 against, 6 undecided
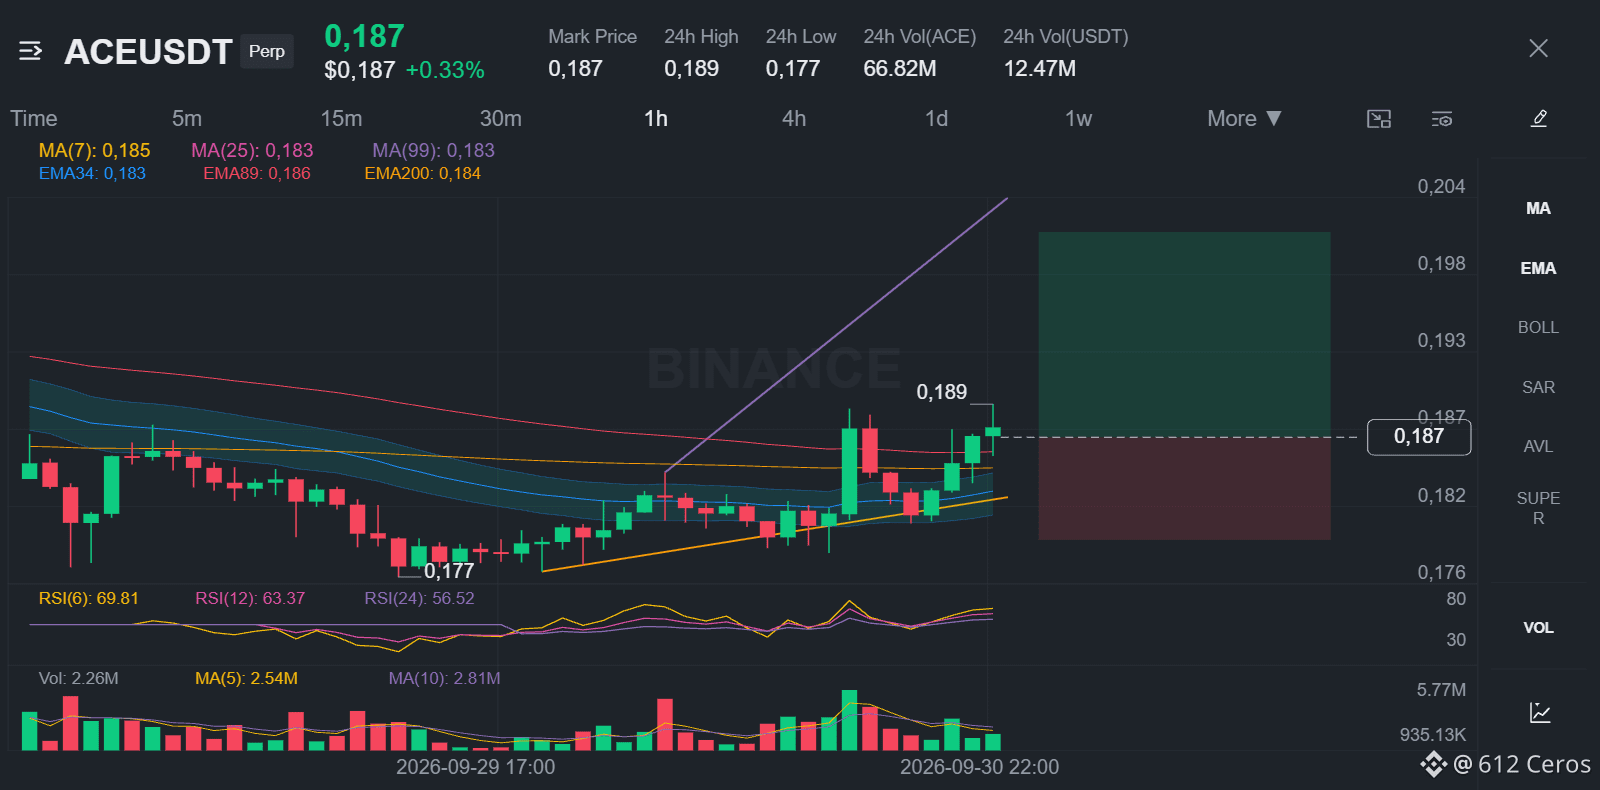
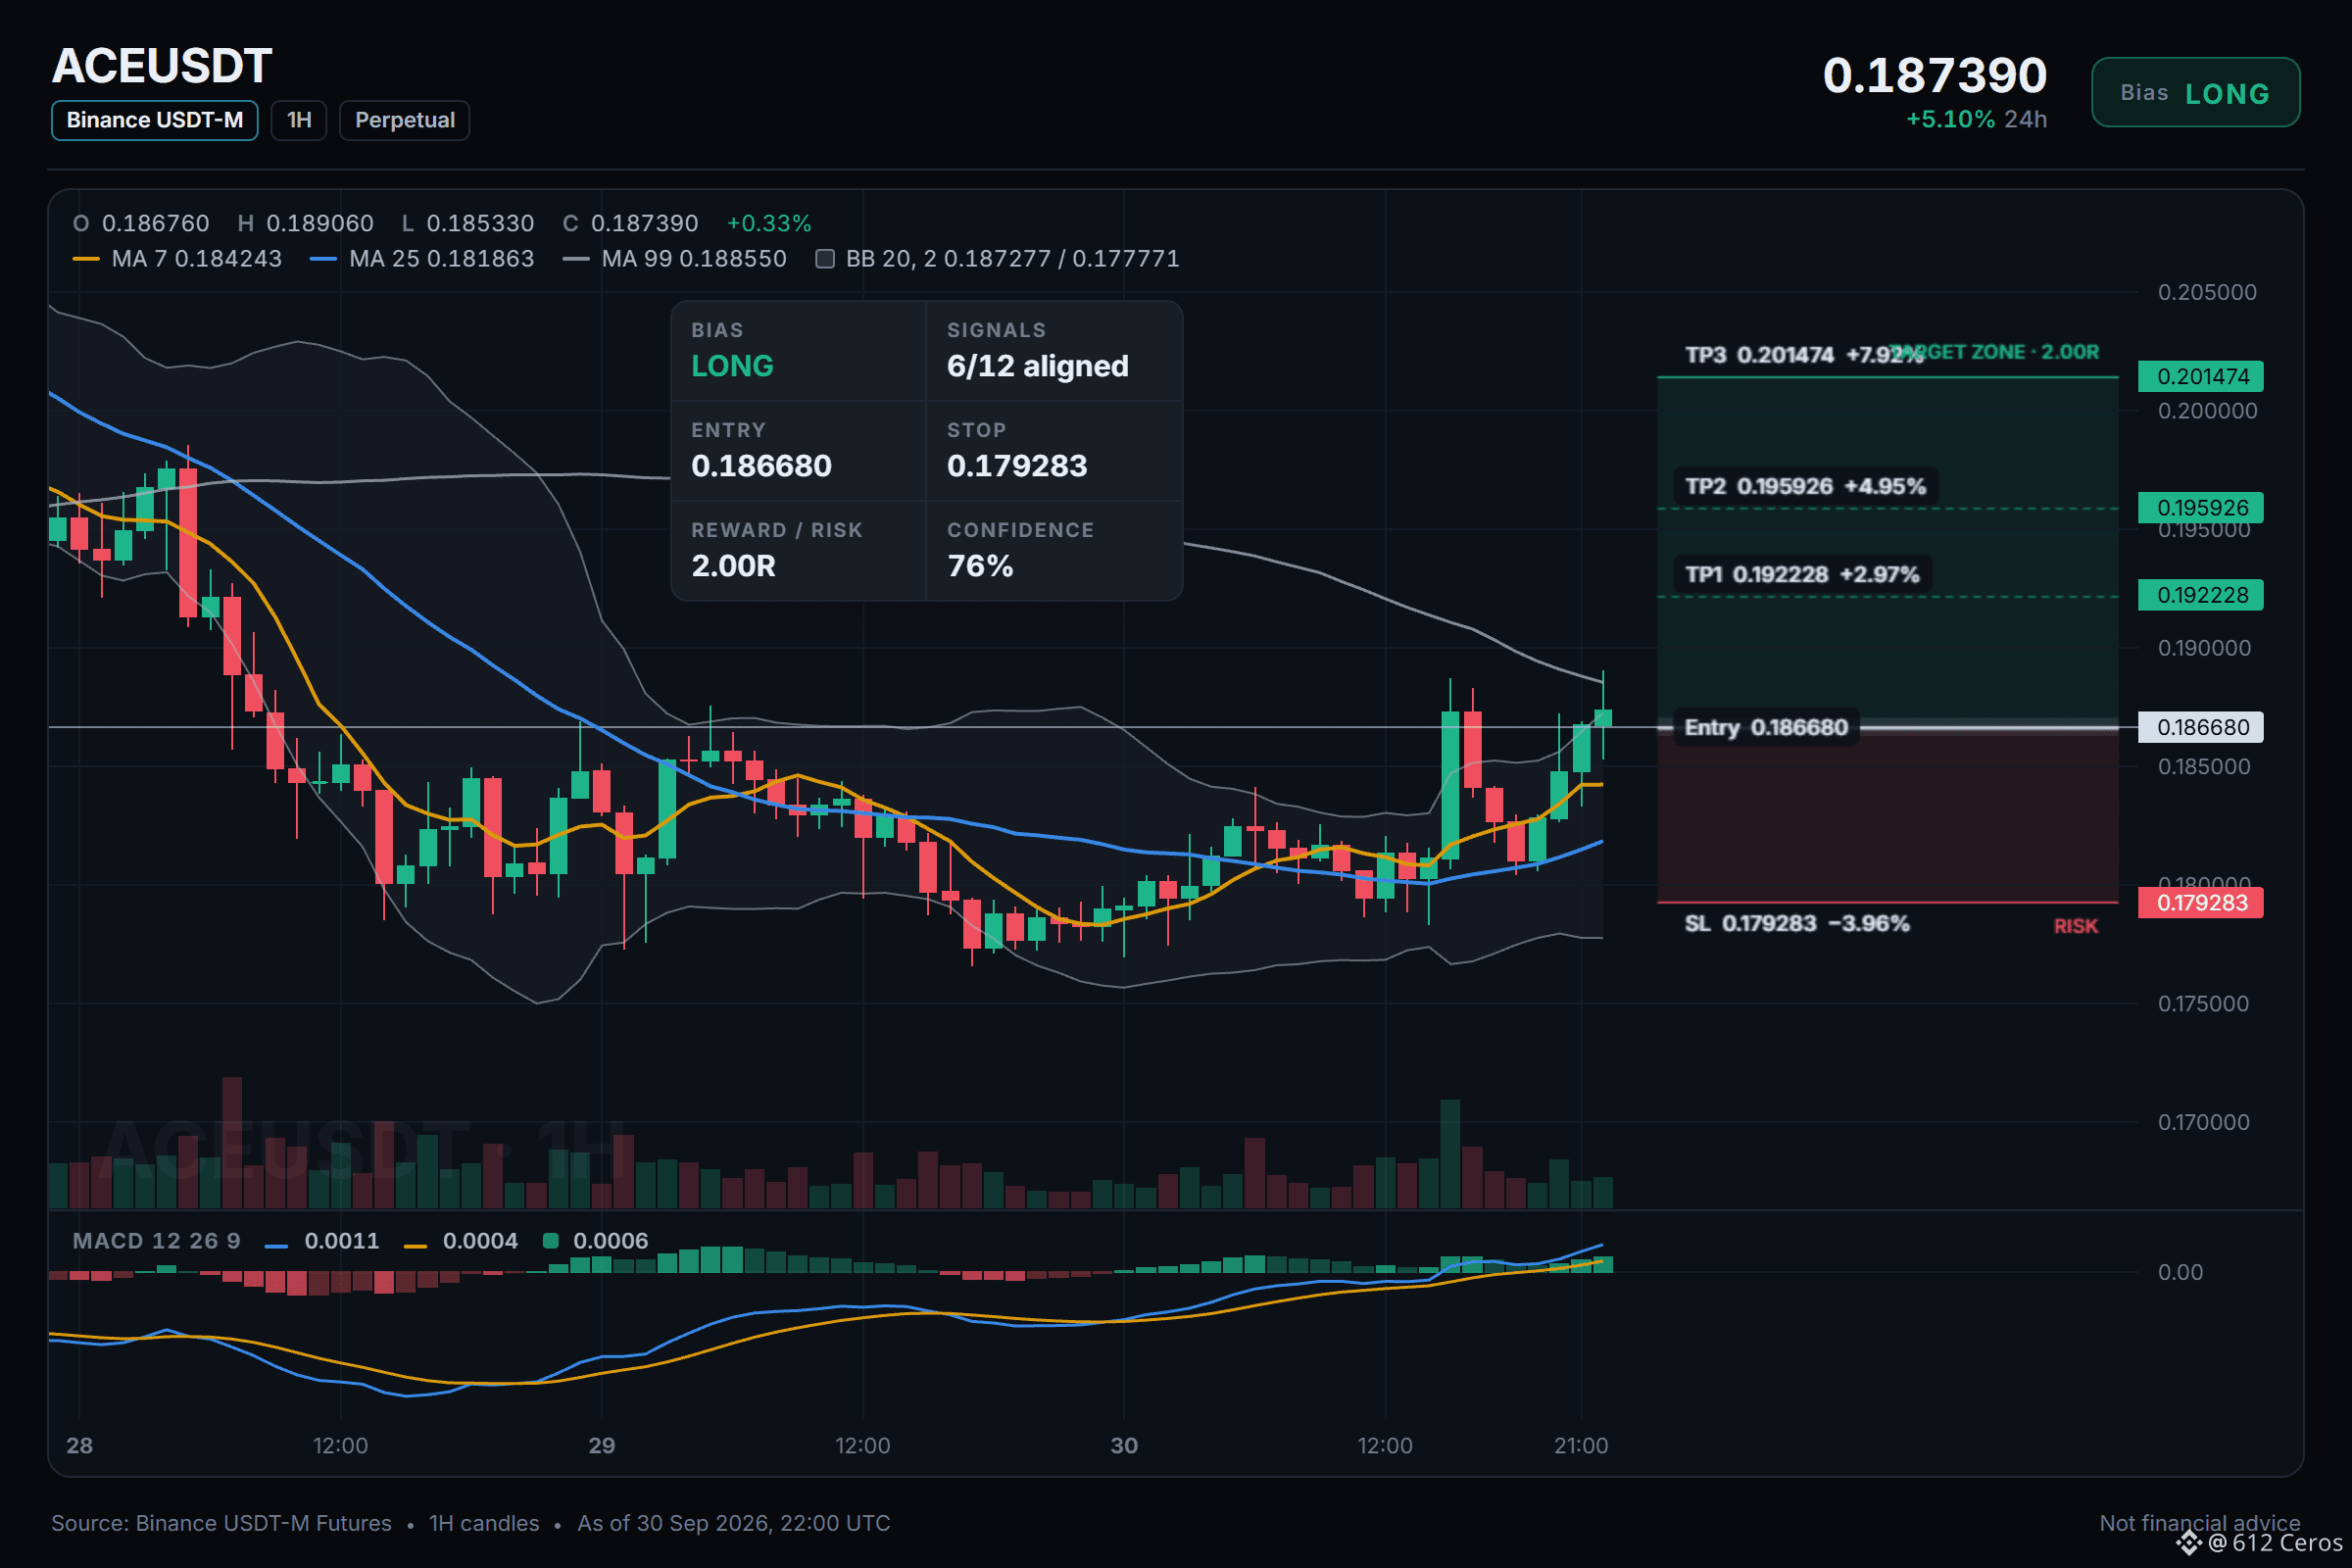
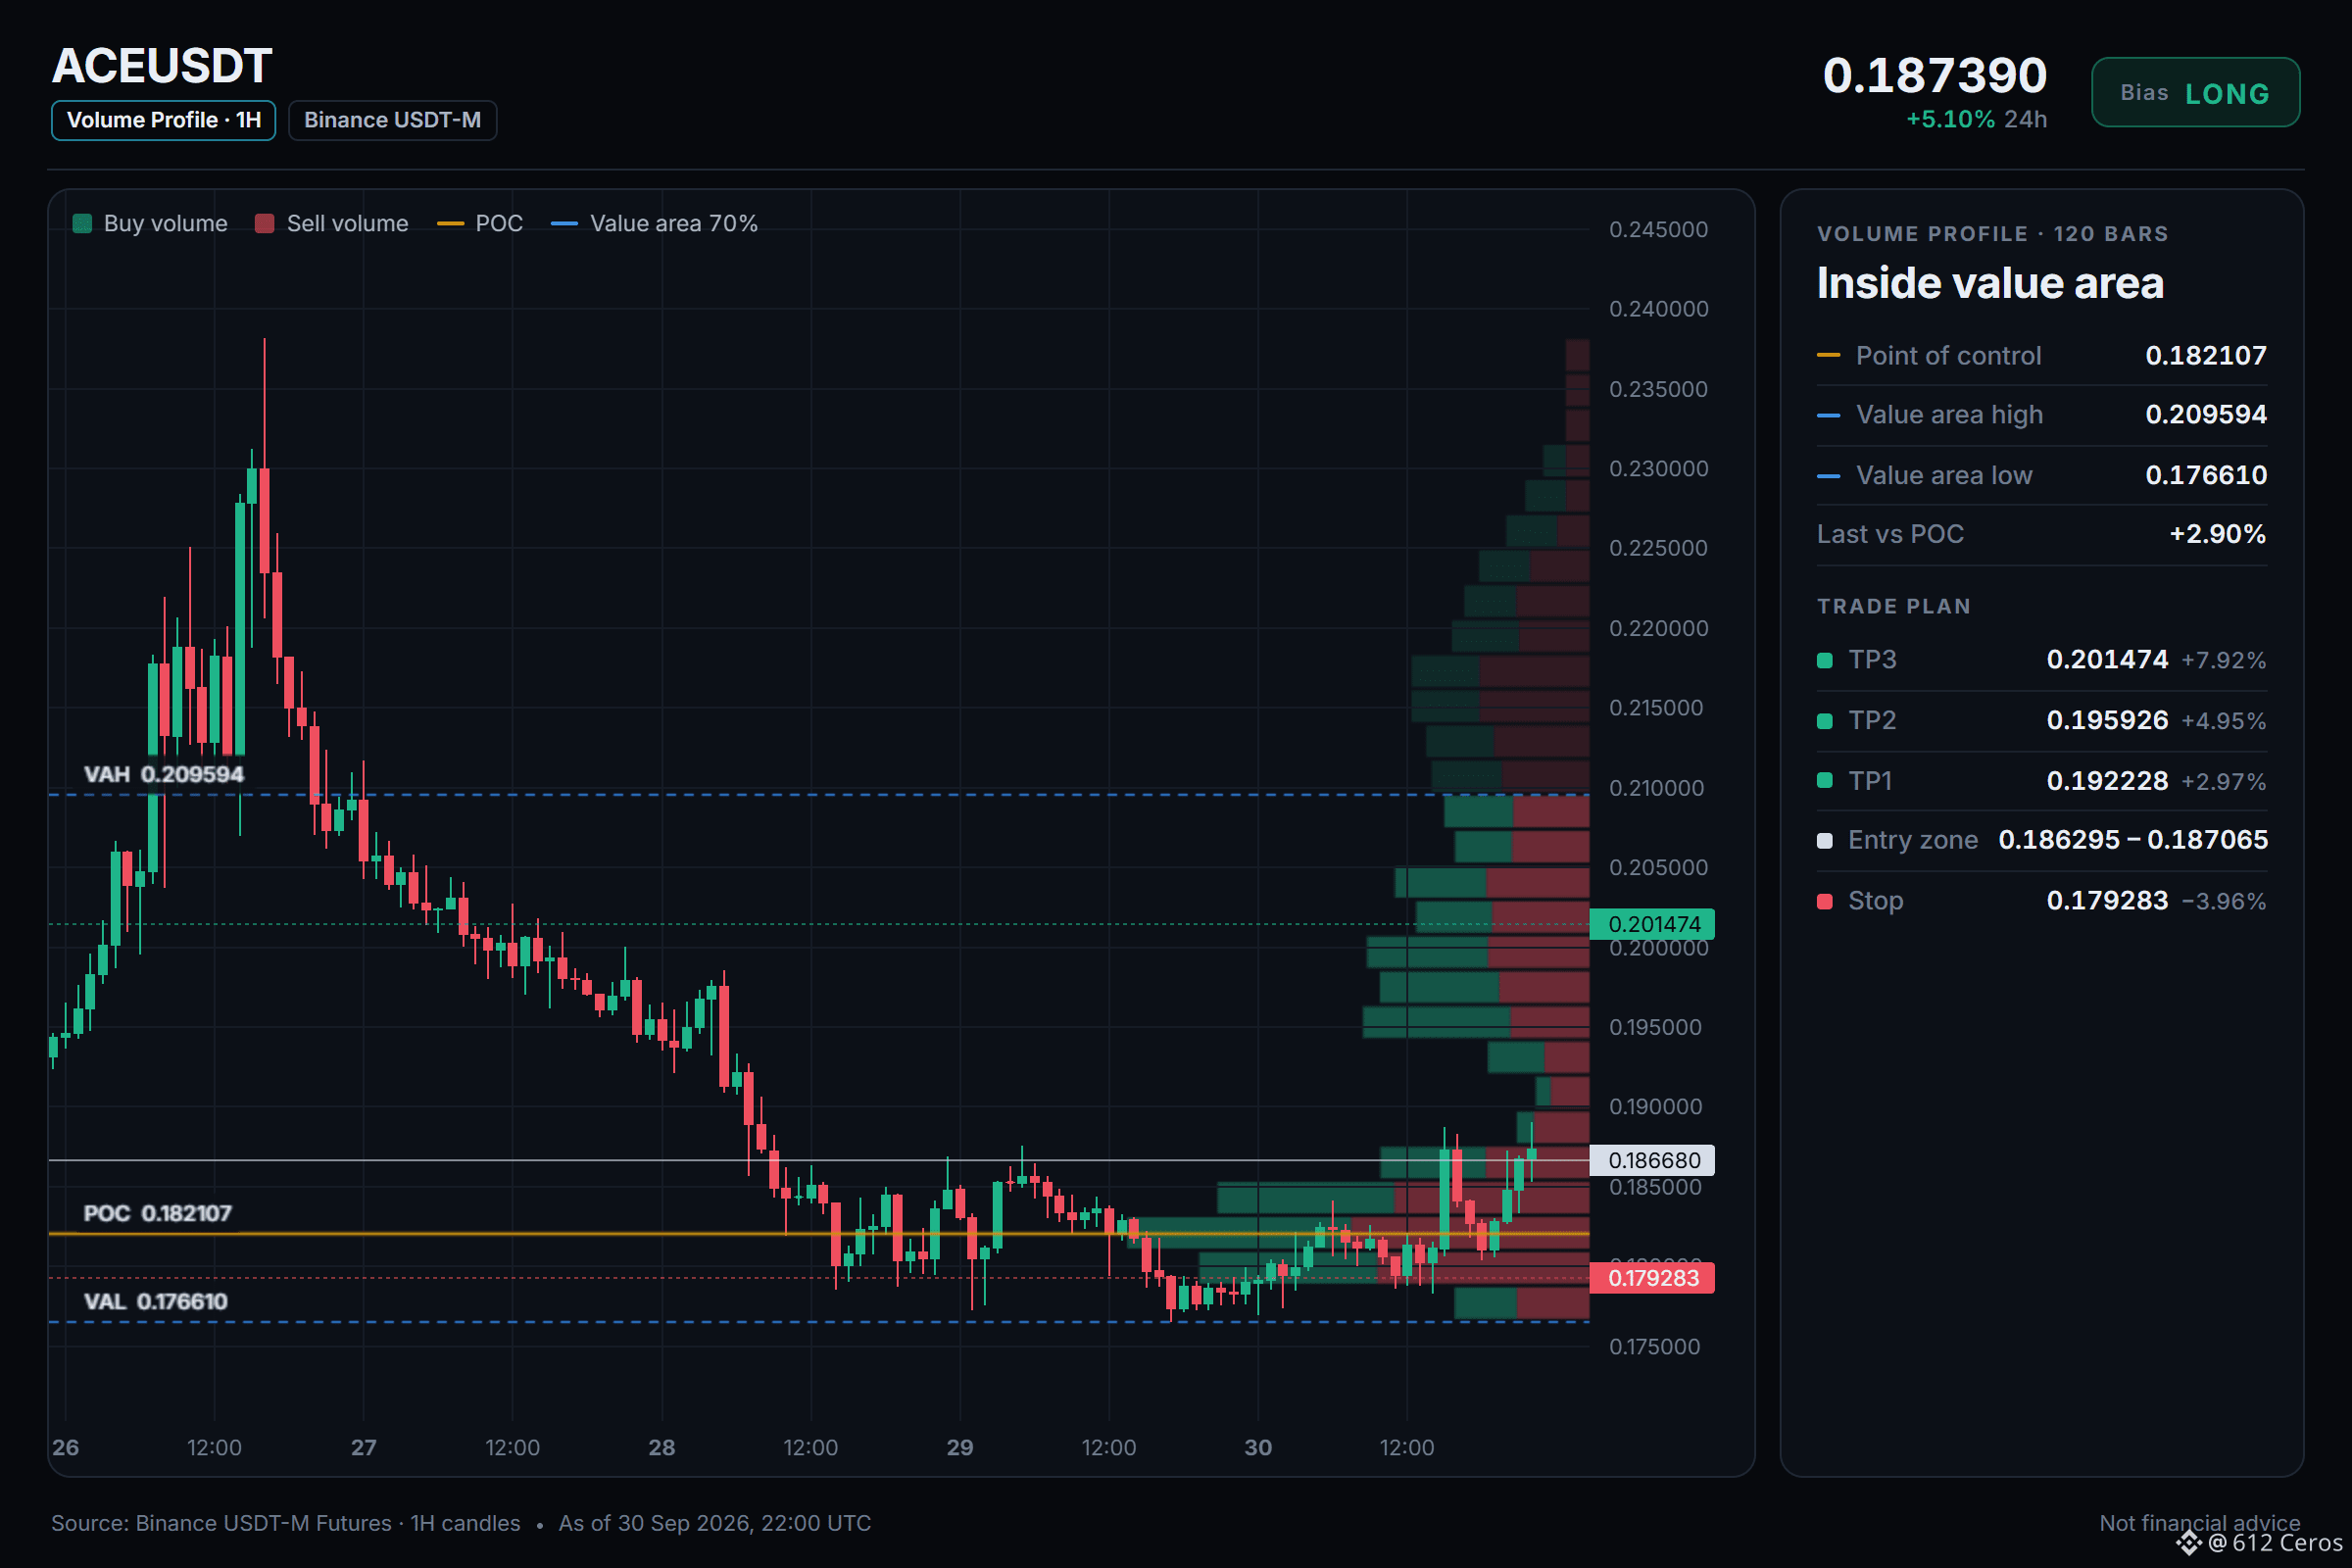
📍 Entry: 0.186295 – 0.187065 · limit order inside the zone, don't chase
🎯 TP1: 0.192228 (+3.0%) · take about half, then move SL to entry
🎯 TP2: 0.195926 (+5.0%) · take most of the rest
🎯 TP3: 0.201474 (+7.9%) · final target
🛑 SL: 0.179283 (-4.0%) · close everything, never move it further away
⚖️ Reward vs risk: 0.75R / 1.25R / 2R at TP1 / TP2 / TP3
TP1 alone pays less than the stop costs, which is why the stop moves to entry after it.
⏳ Timing: 15m momentum already agrees. Skip it if TP1 prints before you get filled.
Why LONG? Technical verdict: STRONG LONG, 6/12 signals agree, 0 against, 6 undecided.
✅ Daily trend: price > EMA50 > EMA200, bullish stack → the big-picture trend is up
✅ 4h trend: price > EMA50 > EMA200, bullish stack → the swing trend is up
✅ 1h trend: price > EMA50 > EMA200, bullish stack → the short-term trend is up
✅ Trend strength (ADX/DI, 15m): ADX 23.0 with buyers in control (DI+ 33.1 vs DI− 15.1) → buyers are driving the move
✅ 1h RSI: 61.9, bullish momentum (above 55) → buyers have the momentum
✅ Relative strength vs BTC: outperforming, +4.58% vs BTC over the last day → stronger than BTC
No factor points the other way right now.
The reasoning:
The daily trend reads bullish, and 6/12 signals aligned favour the long side. The plan is to work the 0.186295 – 0.187065 zone, scale out at 0.192228 and 0.195926, and stay patient for 0.201474. A move through 0.179283 means the idea is wrong and the stop does its job.
Over to you:
Does ACE tag 0.192228 first, or the stop?
Full setup on the chart 👇
{future}(ACEUSDT)
📲 Want more of my latest signals? Join me here:
[https://app.binance.com/uni-qr/D26WbL9t](https://app.binance.com/uni-qr/D26WbL9t)
⚠️ Personal market analysis only. NFA — manage risk and DYOR.
Educational content, not investment advice or a recommendation to buy, sell, deposit, or withdraw any asset. No paid promotion or referral/affiliate links.
ACE long setup: the levels I'm watching
🟢 LONG $ACE /USDT: expecting price to go UP
Bias: LONG · Strong · 6/12 signals agree, 0 against, 6 undecided
📍 Entry: 0.186295 – 0.187065 · limit order inside the zone, don't chase
🎯 TP1: 0.192228 (+3.0%) · take about half, then move SL to entry
🎯 TP2: 0.195926 (+5.0%) · take most of the rest
🎯 TP3: 0.201474 (+7.9%) · final target
🛑 SL: 0.179283 (-4.0%) · close everything, never move it further away
⚖️ Reward vs risk: 0.75R / 1.25R / 2R at TP1 / TP2 / TP3
TP1 alone pays less than the stop costs, which is why the stop moves to entry after it.
⏳ Timing: 15m momentum already agrees. Skip it if TP1 prints before you get filled.
Why LONG? Technical verdict: STRONG LONG, 6/12 signals agree, 0 against, 6 undecided.
✅ Daily trend: price > EMA50 > EMA200, bullish stack → the big-picture trend is up
✅ 4h trend: price > EMA50 > EMA200, bullish stack → the swing trend is up
✅ 1h trend: price > EMA50 > EMA200, bullish stack → the short-term trend is up
✅ Trend strength (ADX/DI, 15m): ADX 23.0 with buyers in control (DI+ 33.1 vs DI− 15.1) → buyers are driving the move
✅ 1h RSI: 61.9, bullish momentum (above 55) → buyers have the momentum
✅ Relative strength vs BTC: outperforming, +4.58% vs BTC over the last day → stronger than BTC
No factor points the other way right now.
The reasoning:
The daily trend reads bullish, and 6/12 signals aligned favour the long side. The plan is to work the 0.186295 – 0.187065 zone, scale out at 0.192228 and 0.195926, and stay patient for 0.201474. A move through 0.179283 means the idea is wrong and the stop does its job.
Over to you:
Does ACE tag 0.192228 first, or the stop?
Full setup on the chart 👇
📲 Want more of my latest signals? Join me here:
https://app.binance.com/uni-qr/D26WbL9t
⚠️ Personal market analysis only. NFA — manage risk and DYOR.
Educational content, not investment advice or a recommendation to buy, sell, deposit, or withdraw any asset. No paid promotion or referral/affiliate links.
🟢 LONG $ACE /USDT: expecting price to go UP
Bias: LONG · Strong · 6/12 signals agree, 0 against, 6 undecided
📍 Entry: 0.186295 – 0.187065 · limit order inside the zone, don't chase
🎯 TP1: 0.192228 (+3.0%) · take about half, then move SL to entry
🎯 TP2: 0.195926 (+5.0%) · take most of the rest
🎯 TP3: 0.201474 (+7.9%) · final target
🛑 SL: 0.179283 (-4.0%) · close everything, never move it further away
⚖️ Reward vs risk: 0.75R / 1.25R / 2R at TP1 / TP2 / TP3
TP1 alone pays less than the stop costs, which is why the stop moves to entry after it.
⏳ Timing: 15m momentum already agrees. Skip it if TP1 prints before you get filled.
Why LONG? Technical verdict: STRONG LONG, 6/12 signals agree, 0 against, 6 undecided.
✅ Daily trend: price > EMA50 > EMA200, bullish stack → the big-picture trend is up
✅ 4h trend: price > EMA50 > EMA200, bullish stack → the swing trend is up
✅ 1h trend: price > EMA50 > EMA200, bullish stack → the short-term trend is up
✅ Trend strength (ADX/DI, 15m): ADX 23.0 with buyers in control (DI+ 33.1 vs DI− 15.1) → buyers are driving the move
✅ 1h RSI: 61.9, bullish momentum (above 55) → buyers have the momentum
✅ Relative strength vs BTC: outperforming, +4.58% vs BTC over the last day → stronger than BTC
No factor points the other way right now.
The reasoning:
The daily trend reads bullish, and 6/12 signals aligned favour the long side. The plan is to work the 0.186295 – 0.187065 zone, scale out at 0.192228 and 0.195926, and stay patient for 0.201474. A move through 0.179283 means the idea is wrong and the stop does its job.
Over to you:
Does ACE tag 0.192228 first, or the stop?
Full setup on the chart 👇
📲 Want more of my latest signals? Join me here:
https://app.binance.com/uni-qr/D26WbL9t
⚠️ Personal market analysis only. NFA — manage risk and DYOR.
Educational content, not investment advice or a recommendation to buy, sell, deposit, or withdraw any asset. No paid promotion or referral/affiliate links.
1
752
·
--
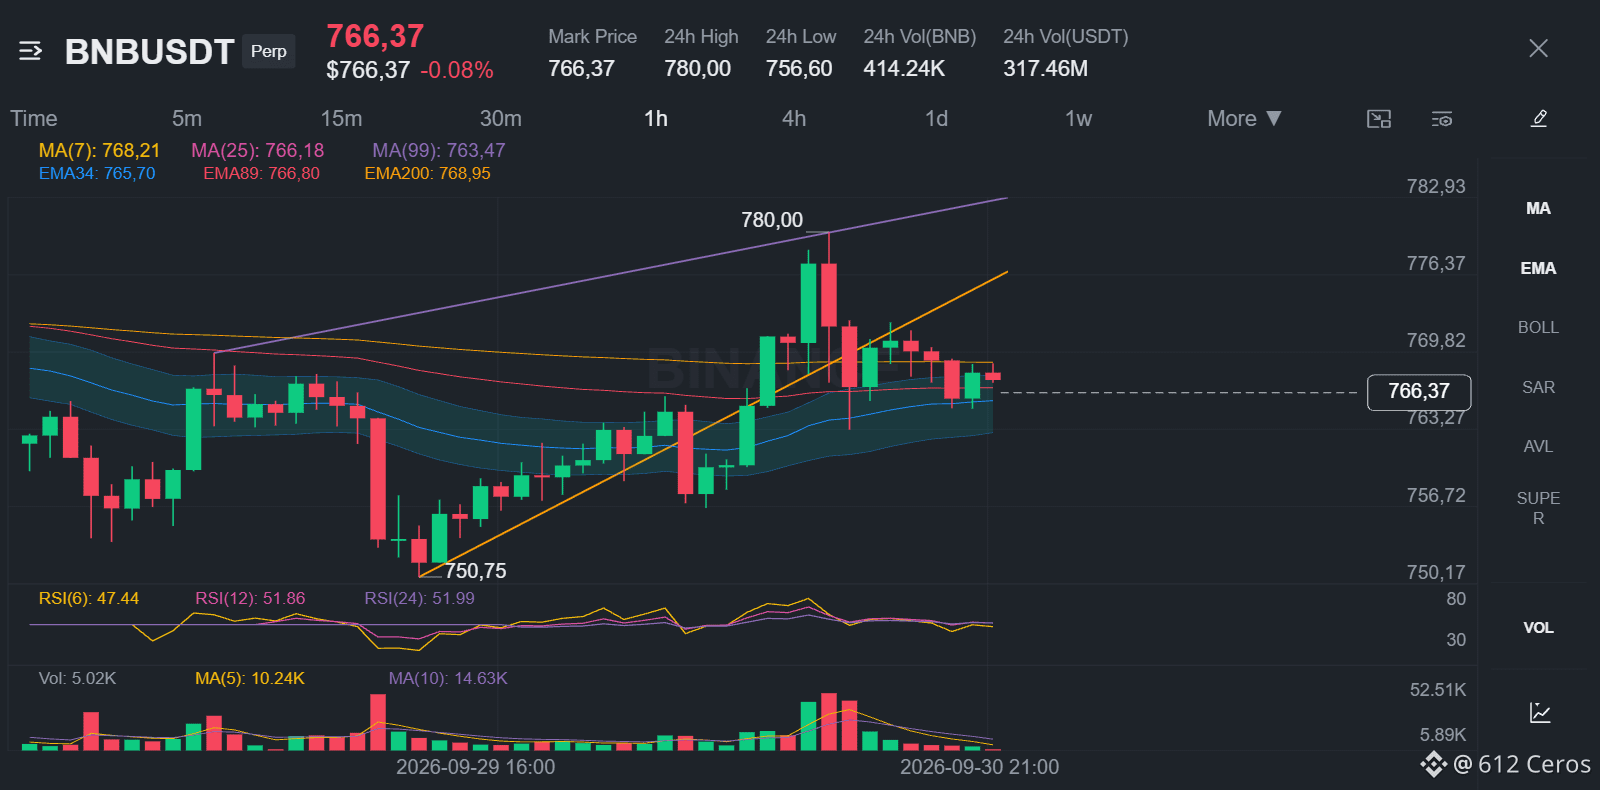
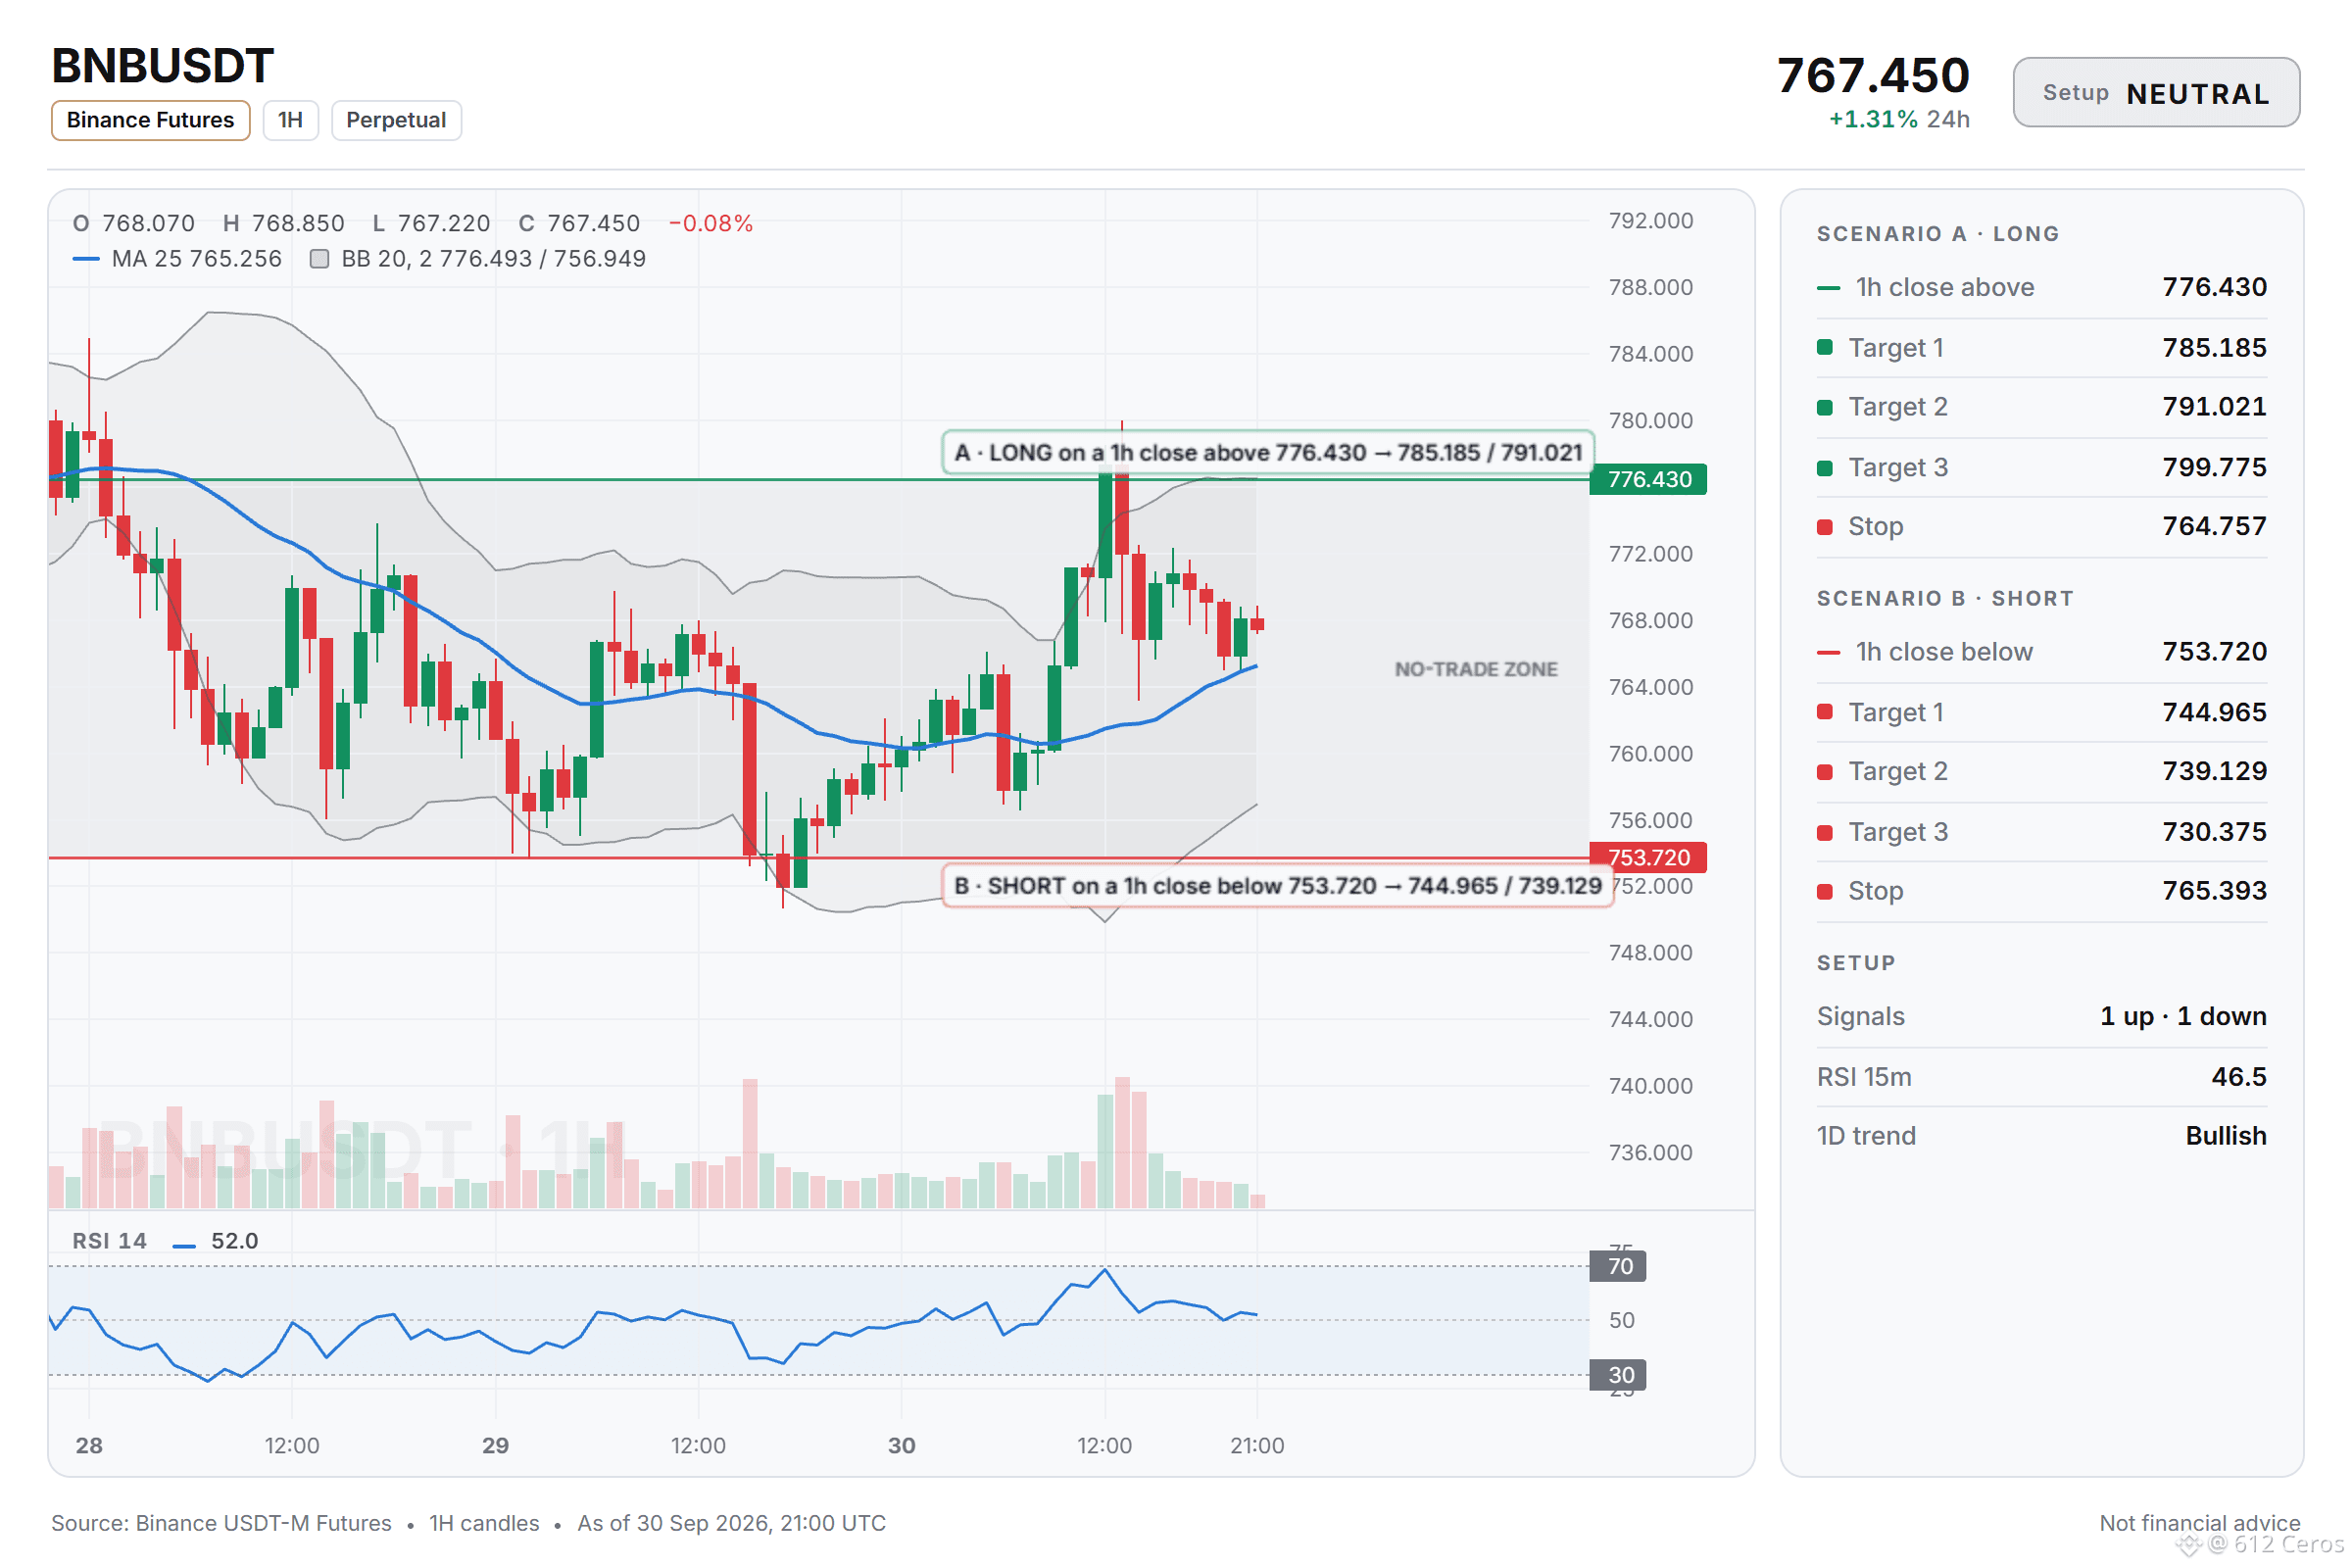
BNB lacks directional momentum right now
⚪ $BNB /USDT: NO TRADE YET, waiting for one side to break
Bias: NEUTRAL · 1 bullish vs 1 bearish
Two scenarios, no position yet:
🟢 Scenario A: LONG on a 1h close above 776.430 (top of the resistance zone)
Trigger 776.430 → targets 785.185 / 791.021 / 799.775, stop 764.757
🔴 Scenario B: SHORT on a 1h close below 753.720 (bottom of the support zone)
Trigger 753.720 → targets 744.965 / 739.129 / 730.375, stop 765.393
⏸ Between 753.720 and 776.430 (3.0% wide): no edge, no trade.
Technical read: NEUTRAL. 1 of 12 signals bullish, 1 bearish, 10 undecided.
What leans up:
🟢 Daily trend: price > EMA50 > EMA200, bullish stack → the big-picture trend is up
What leans down:
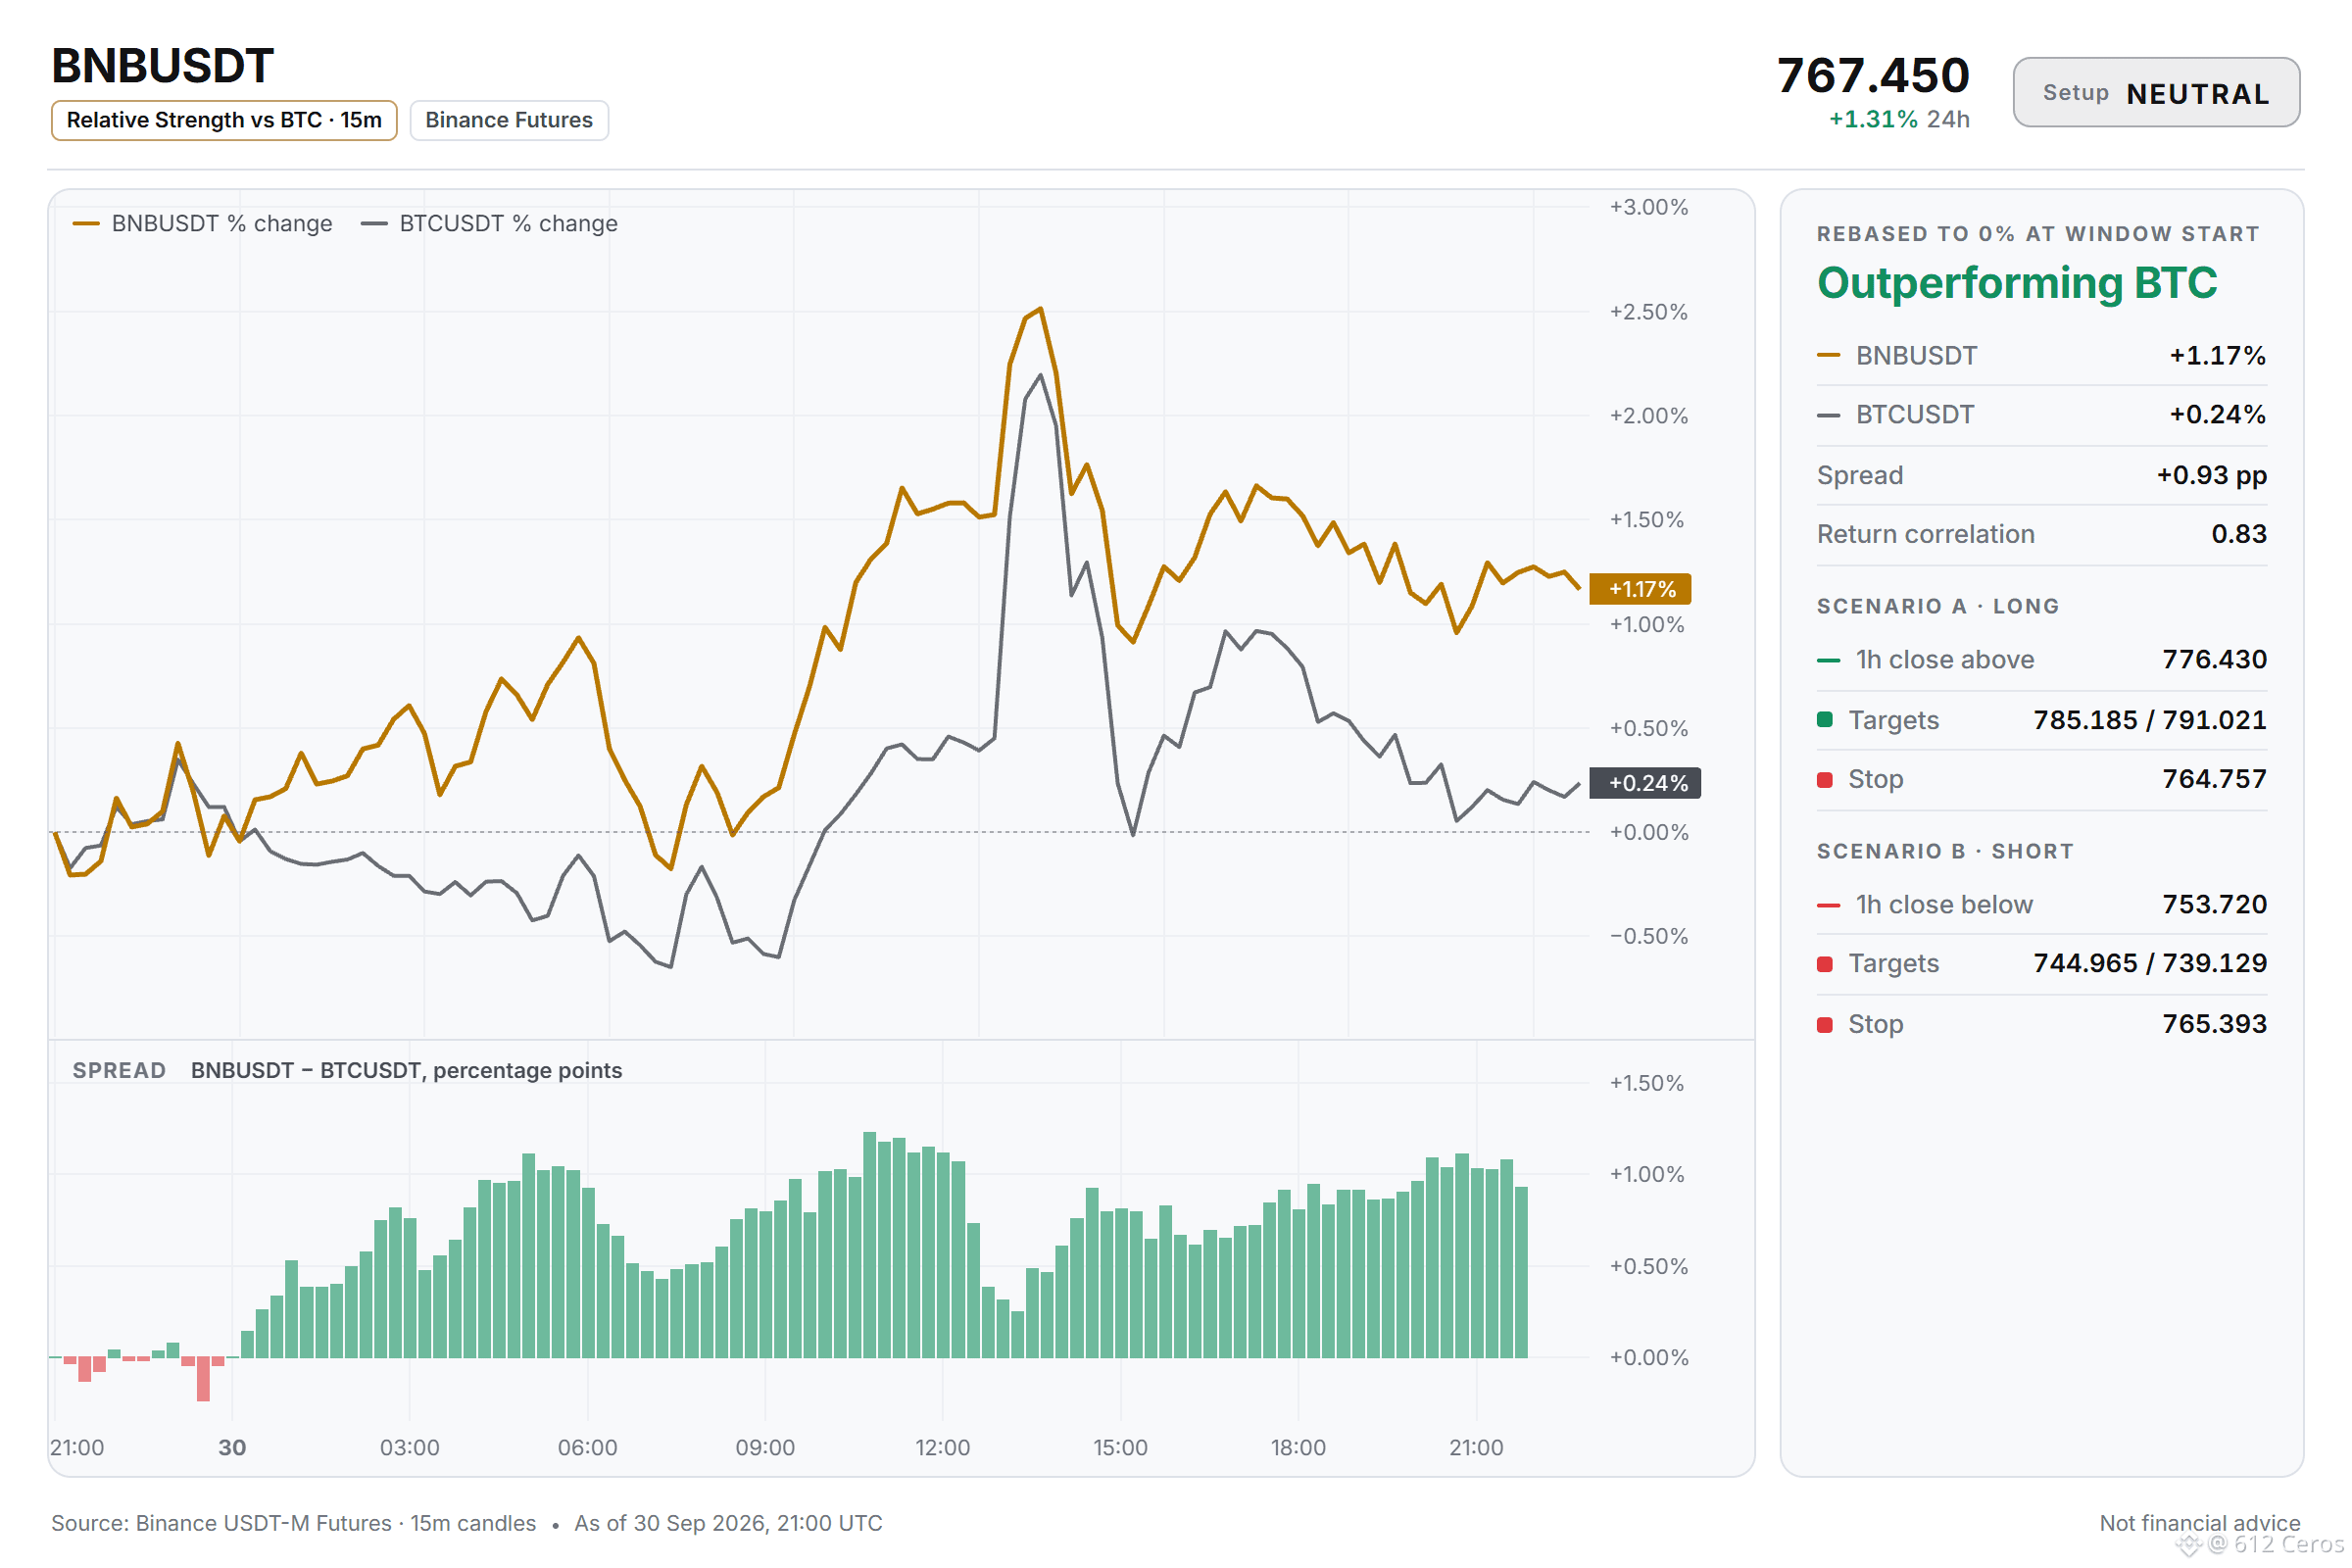
🔴 BTC backdrop: BTC trend is bearish and correlation is 0.89 → BTC is falling and this coin tends to follow
My read:
There is no edge at the moment because the daily trend is bullish while the BTC backdrop is bearish (correlation 0.89). The 1h and 4h trends are mixed with RSI neutral and no clear volume confirmation. A bullish scenario needs a 1h close above 776.430. A bearish scenario needs a 1h close below 753.720. No position is recommended until one of these triggers is confirmed.
Debate:
Which trigger level do you think will hold first, 776.430 or 753.720?
See it on the chart 👇
{future}(BNBUSDT)
📲 Want more of my latest signals? Join me here:
[https://app.binance.com/uni-qr/D26WbL9t](https://app.binance.com/uni-qr/D26WbL9t)
⚠️ Personal market analysis only. NFA — manage risk and DYOR.
Educational content, not investment advice or a recommendation to buy, sell, deposit, or withdraw any asset. No paid promotion or referral/affiliate links.
BNB lacks directional momentum right now
⚪ $BNB /USDT: NO TRADE YET, waiting for one side to break
Bias: NEUTRAL · 1 bullish vs 1 bearish
Two scenarios, no position yet:
🟢 Scenario A: LONG on a 1h close above 776.430 (top of the resistance zone)
Trigger 776.430 → targets 785.185 / 791.021 / 799.775, stop 764.757
🔴 Scenario B: SHORT on a 1h close below 753.720 (bottom of the support zone)
Trigger 753.720 → targets 744.965 / 739.129 / 730.375, stop 765.393
⏸ Between 753.720 and 776.430 (3.0% wide): no edge, no trade.
Technical read: NEUTRAL. 1 of 12 signals bullish, 1 bearish, 10 undecided.
What leans up:
🟢 Daily trend: price > EMA50 > EMA200, bullish stack → the big-picture trend is up
What leans down:
🔴 BTC backdrop: BTC trend is bearish and correlation is 0.89 → BTC is falling and this coin tends to follow
My read:
There is no edge at the moment because the daily trend is bullish while the BTC backdrop is bearish (correlation 0.89). The 1h and 4h trends are mixed with RSI neutral and no clear volume confirmation. A bullish scenario needs a 1h close above 776.430. A bearish scenario needs a 1h close below 753.720. No position is recommended until one of these triggers is confirmed.
Debate:
Which trigger level do you think will hold first, 776.430 or 753.720?
See it on the chart 👇
📲 Want more of my latest signals? Join me here:
https://app.binance.com/uni-qr/D26WbL9t
⚠️ Personal market analysis only. NFA — manage risk and DYOR.
Educational content, not investment advice or a recommendation to buy, sell, deposit, or withdraw any asset. No paid promotion or referral/affiliate links.
⚪ $BNB /USDT: NO TRADE YET, waiting for one side to break
Bias: NEUTRAL · 1 bullish vs 1 bearish
Two scenarios, no position yet:
🟢 Scenario A: LONG on a 1h close above 776.430 (top of the resistance zone)
Trigger 776.430 → targets 785.185 / 791.021 / 799.775, stop 764.757
🔴 Scenario B: SHORT on a 1h close below 753.720 (bottom of the support zone)
Trigger 753.720 → targets 744.965 / 739.129 / 730.375, stop 765.393
⏸ Between 753.720 and 776.430 (3.0% wide): no edge, no trade.
Technical read: NEUTRAL. 1 of 12 signals bullish, 1 bearish, 10 undecided.
What leans up:
🟢 Daily trend: price > EMA50 > EMA200, bullish stack → the big-picture trend is up
What leans down:
🔴 BTC backdrop: BTC trend is bearish and correlation is 0.89 → BTC is falling and this coin tends to follow
My read:
There is no edge at the moment because the daily trend is bullish while the BTC backdrop is bearish (correlation 0.89). The 1h and 4h trends are mixed with RSI neutral and no clear volume confirmation. A bullish scenario needs a 1h close above 776.430. A bearish scenario needs a 1h close below 753.720. No position is recommended until one of these triggers is confirmed.
Debate:
Which trigger level do you think will hold first, 776.430 or 753.720?
See it on the chart 👇
📲 Want more of my latest signals? Join me here:
https://app.binance.com/uni-qr/D26WbL9t
⚠️ Personal market analysis only. NFA — manage risk and DYOR.
Educational content, not investment advice or a recommendation to buy, sell, deposit, or withdraw any asset. No paid promotion or referral/affiliate links.
1
630
·
--
BTC is resting at a crossroads, waiting for a 1h close to break it.
⚪ $BTC /USDT: NO TRADE YET, waiting for one side to break
Bias: NEUTRAL · 2 bullish vs 1 bearish
Two scenarios, no position yet:
🟢 Scenario A: LONG on a 1h close above 83958.61 (top of the resistance zone)
Trigger 83958.61 → targets 84900.97 / 85529.21 / 86471.57, stop 82702.13
🔴 Scenario B: SHORT on a 1h close below 82500.10 (bottom of the support zone)
Trigger 82500.10 → targets 81557.74 / 80929.50 / 79987.14, stop 83756.58
⏸ Between 82500.10 and 83958.61 (1.8% wide): no edge, no trade.
Technical read: NEUTRAL. 2 of 12 signals bullish, 1 bearish, 9 undecided.
For the bulls:
🟢 Daily trend: price > EMA50 > EMA200, bullish stack → the big-picture trend is up
🟢 4h trend: price > EMA50 > EMA200, bullish stack → the swing trend is up
For the bears:
🔴 BTC backdrop: BTC trend is bearish and correlation is 1.00 → BTC is falling and this coin tends to follow
Why I'm flat:
There is no edge right now. Two factors support upside: the daily trend is bullish with price above the EMA50 and EMA200, and the 4h trend is also bullish with the same stacked EMAs. One factor argues against: BTC backdrop is bearish with correlation at 1.00, so BTC is falling and this coin tends to follow. A long setup needs a 1h close above 83958.61, and a short setup needs a 1h close below 82500.10. I am not recommending a position yet.
Debate:
Which trigger level do you think will hold first, 83958.61 or 82500.10?
Full setup on the chart 👇
{future}(BTCUSDT)
📲 Want more of my latest signals? Join me here:
[https://app.binance.com/uni-qr/D26WbL9t](https://app.binance.com/uni-qr/D26WbL9t)
⚠️ Personal market analysis only. NFA — manage risk and DYOR.
Educational content, not investment advice or a recommendation to buy, sell, deposit, or withdraw any asset. No paid promotion or referral/affiliate links.
BTC is resting at a crossroads, waiting for a 1h close to break it.
⚪ $BTC /USDT: NO TRADE YET, waiting for one side to break
Bias: NEUTRAL · 2 bullish vs 1 bearish
Two scenarios, no position yet:
🟢 Scenario A: LONG on a 1h close above 83958.61 (top of the resistance zone)
Trigger 83958.61 → targets 84900.97 / 85529.21 / 86471.57, stop 82702.13
🔴 Scenario B: SHORT on a 1h close below 82500.10 (bottom of the support zone)
Trigger 82500.10 → targets 81557.74 / 80929.50 / 79987.14, stop 83756.58
⏸ Between 82500.10 and 83958.61 (1.8% wide): no edge, no trade.
Technical read: NEUTRAL. 2 of 12 signals bullish, 1 bearish, 9 undecided.
For the bulls:
🟢 Daily trend: price > EMA50 > EMA200, bullish stack → the big-picture trend is up
🟢 4h trend: price > EMA50 > EMA200, bullish stack → the swing trend is up
For the bears:
🔴 BTC backdrop: BTC trend is bearish and correlation is 1.00 → BTC is falling and this coin tends to follow
Why I'm flat:
There is no edge right now. Two factors support upside: the daily trend is bullish with price above the EMA50 and EMA200, and the 4h trend is also bullish with the same stacked EMAs. One factor argues against: BTC backdrop is bearish with correlation at 1.00, so BTC is falling and this coin tends to follow. A long setup needs a 1h close above 83958.61, and a short setup needs a 1h close below 82500.10. I am not recommending a position yet.
Debate:
Which trigger level do you think will hold first, 83958.61 or 82500.10?
Full setup on the chart 👇
📲 Want more of my latest signals? Join me here:
https://app.binance.com/uni-qr/D26WbL9t
⚠️ Personal market analysis only. NFA — manage risk and DYOR.
Educational content, not investment advice or a recommendation to buy, sell, deposit, or withdraw any asset. No paid promotion or referral/affiliate links.
⚪ $BTC /USDT: NO TRADE YET, waiting for one side to break
Bias: NEUTRAL · 2 bullish vs 1 bearish
Two scenarios, no position yet:
🟢 Scenario A: LONG on a 1h close above 83958.61 (top of the resistance zone)
Trigger 83958.61 → targets 84900.97 / 85529.21 / 86471.57, stop 82702.13
🔴 Scenario B: SHORT on a 1h close below 82500.10 (bottom of the support zone)
Trigger 82500.10 → targets 81557.74 / 80929.50 / 79987.14, stop 83756.58
⏸ Between 82500.10 and 83958.61 (1.8% wide): no edge, no trade.
Technical read: NEUTRAL. 2 of 12 signals bullish, 1 bearish, 9 undecided.
For the bulls:
🟢 Daily trend: price > EMA50 > EMA200, bullish stack → the big-picture trend is up
🟢 4h trend: price > EMA50 > EMA200, bullish stack → the swing trend is up
For the bears:
🔴 BTC backdrop: BTC trend is bearish and correlation is 1.00 → BTC is falling and this coin tends to follow
Why I'm flat:
There is no edge right now. Two factors support upside: the daily trend is bullish with price above the EMA50 and EMA200, and the 4h trend is also bullish with the same stacked EMAs. One factor argues against: BTC backdrop is bearish with correlation at 1.00, so BTC is falling and this coin tends to follow. A long setup needs a 1h close above 83958.61, and a short setup needs a 1h close below 82500.10. I am not recommending a position yet.
Debate:
Which trigger level do you think will hold first, 83958.61 or 82500.10?
Full setup on the chart 👇
📲 Want more of my latest signals? Join me here:
https://app.binance.com/uni-qr/D26WbL9t
⚠️ Personal market analysis only. NFA — manage risk and DYOR.
Educational content, not investment advice or a recommendation to buy, sell, deposit, or withdraw any asset. No paid promotion or referral/affiliate links.
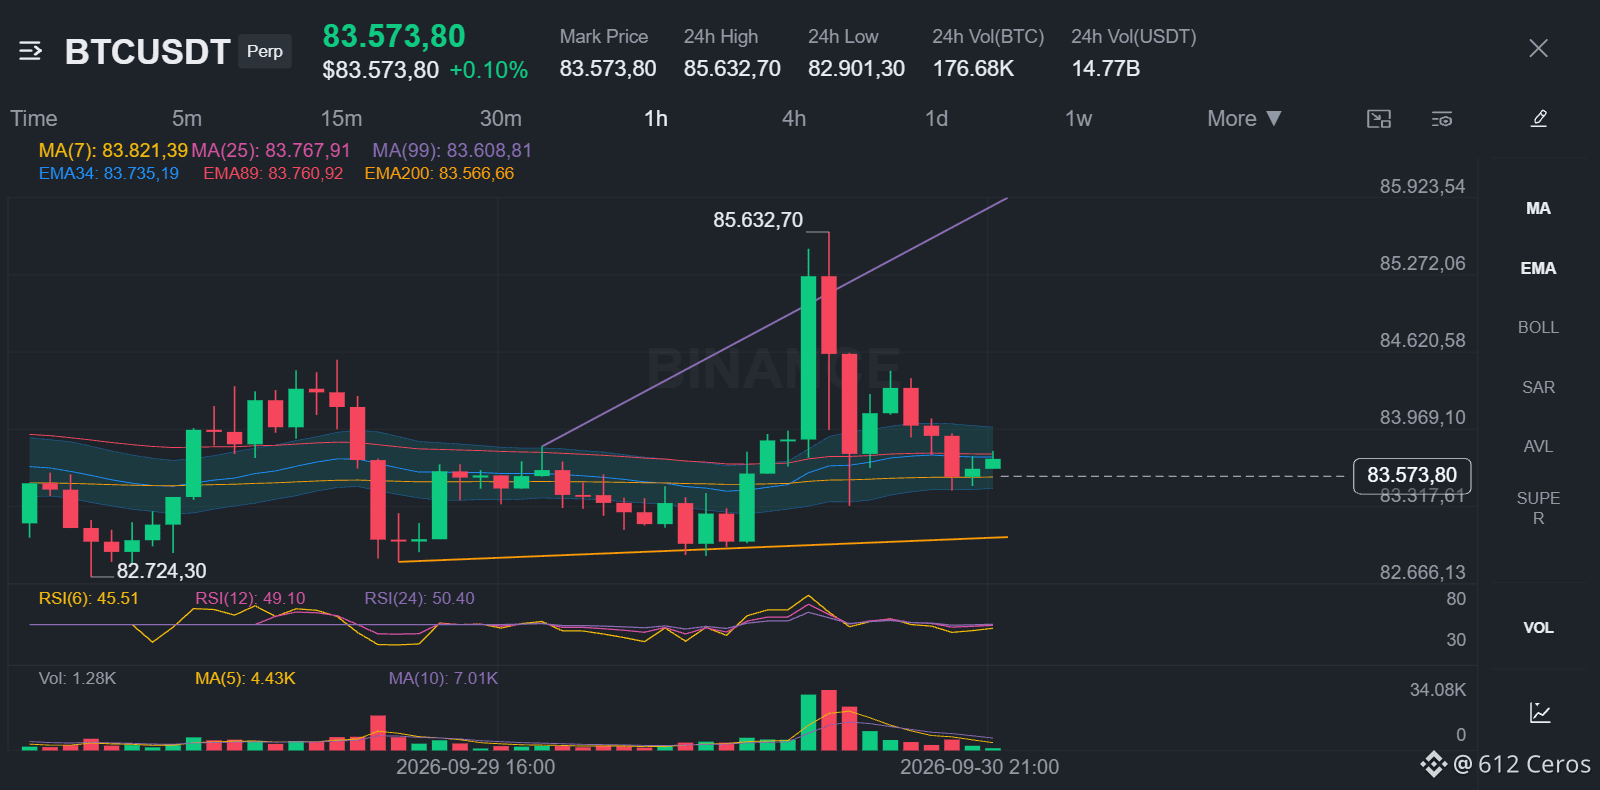
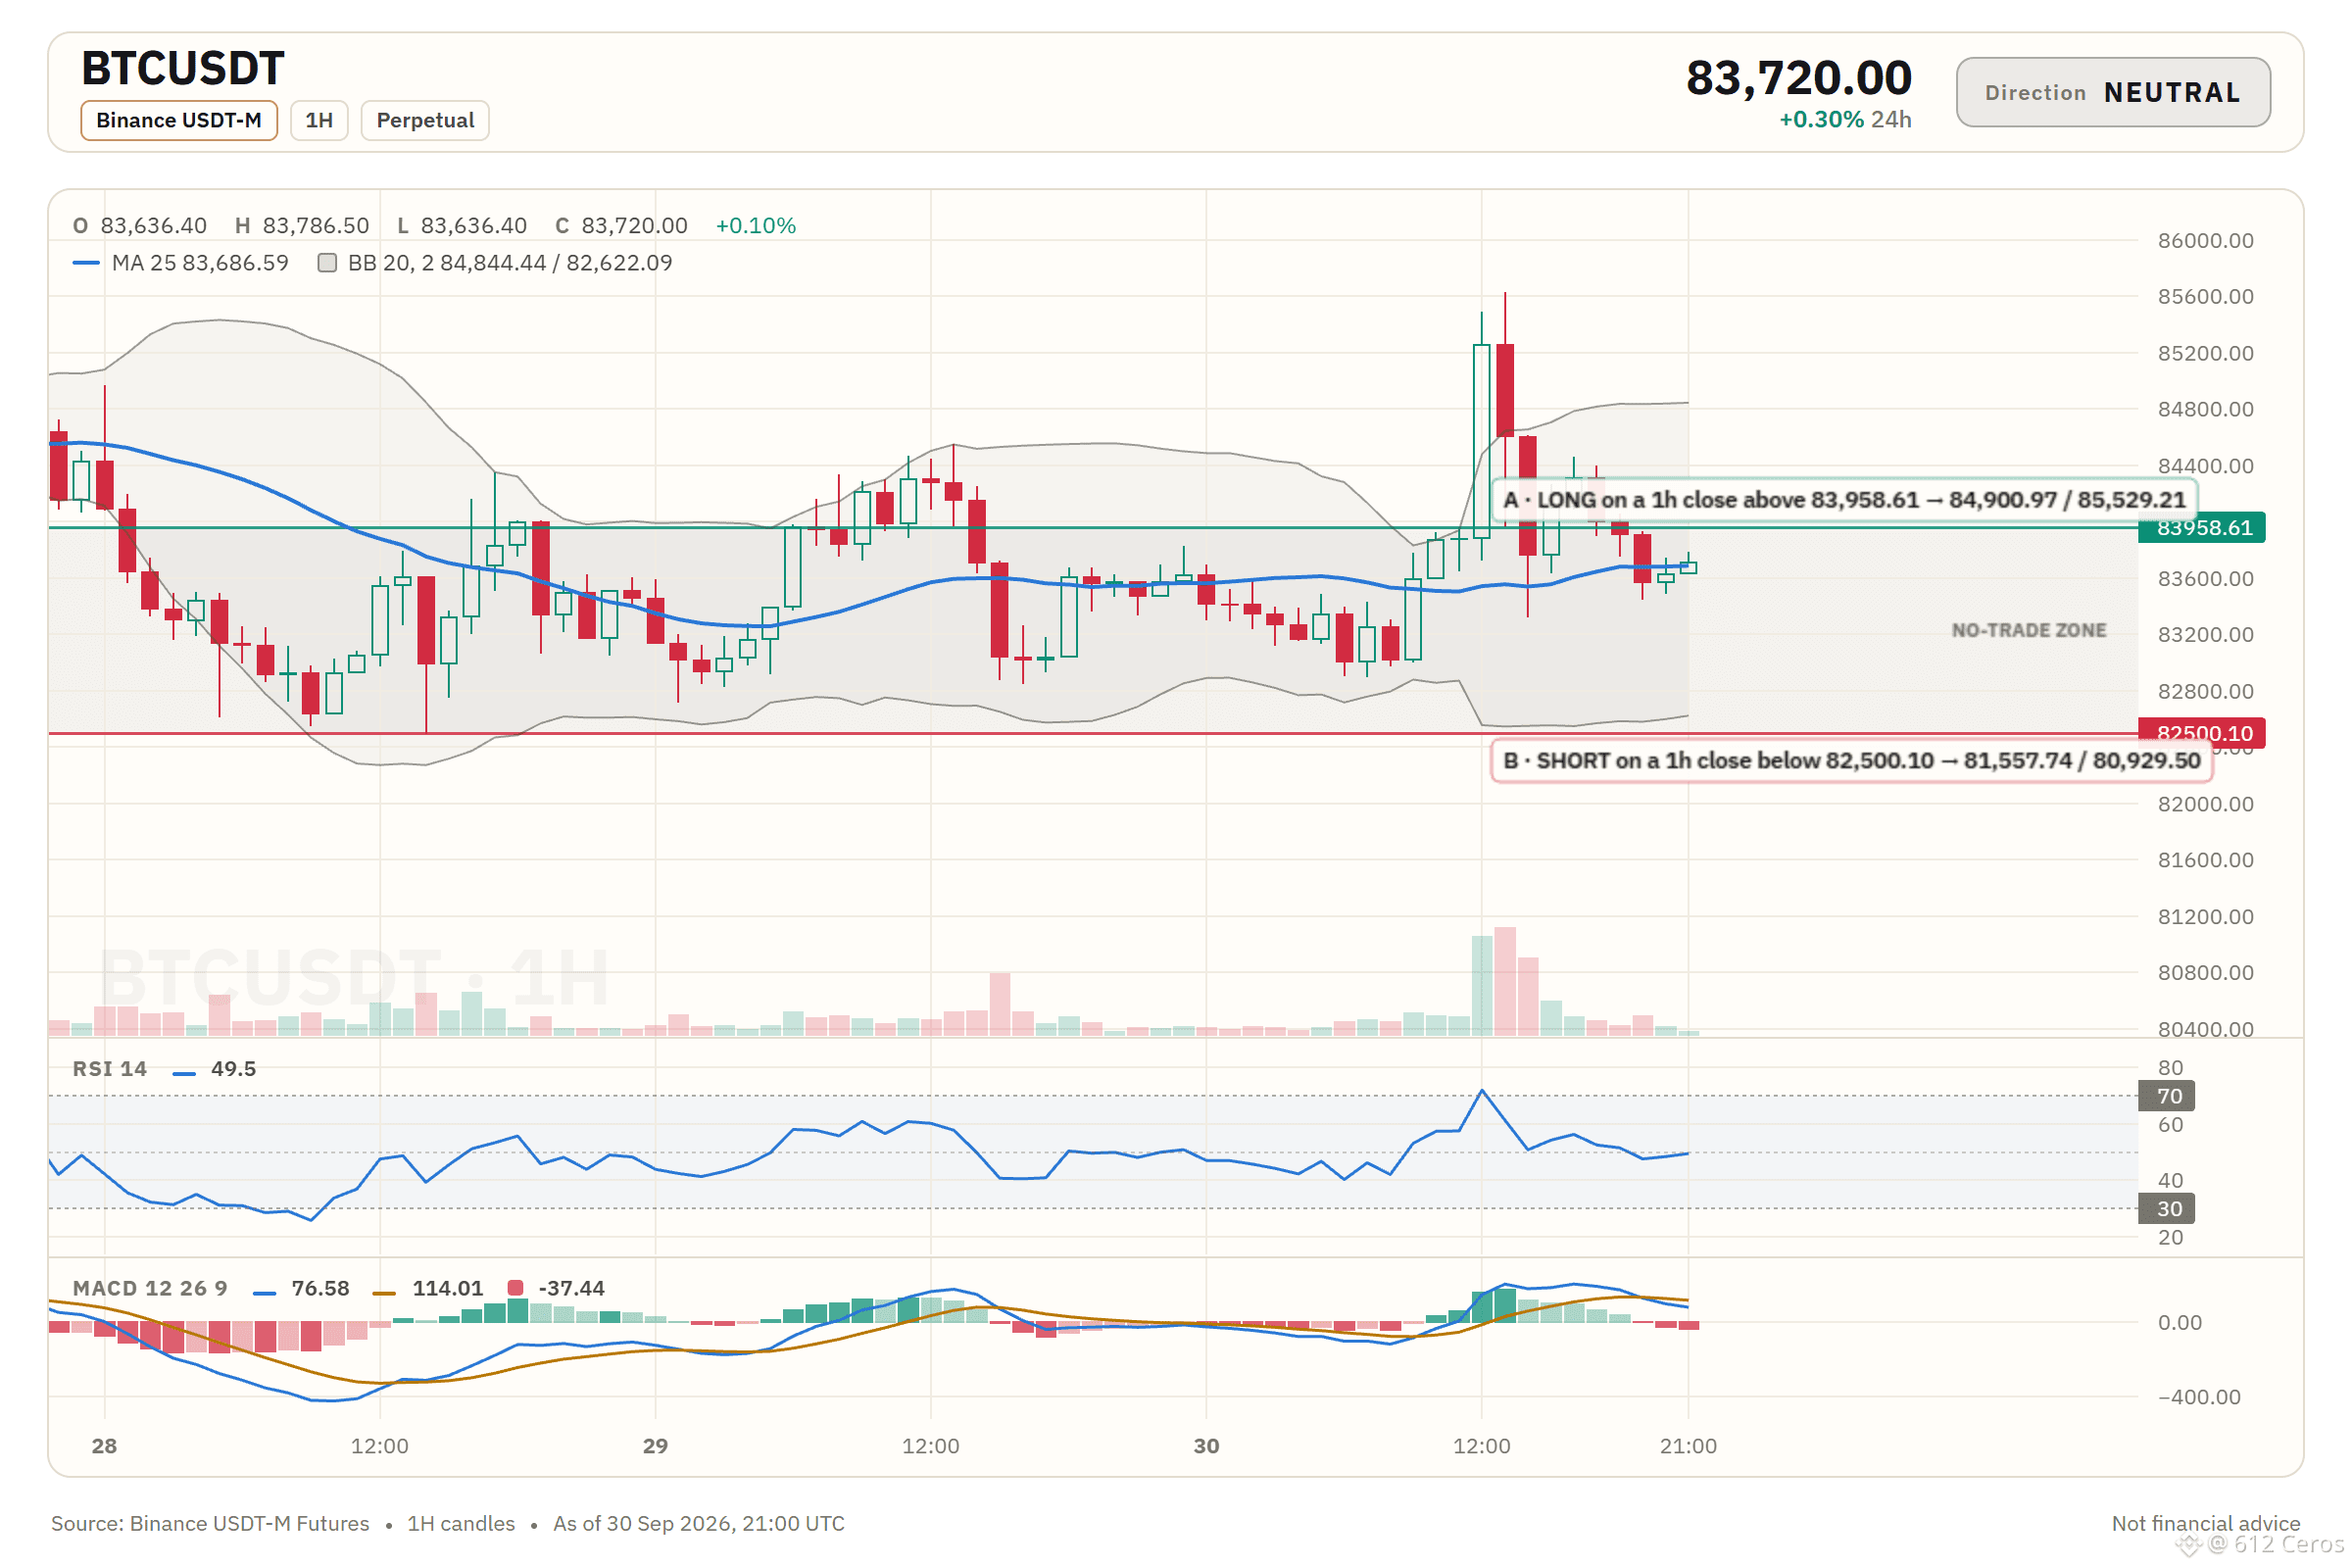
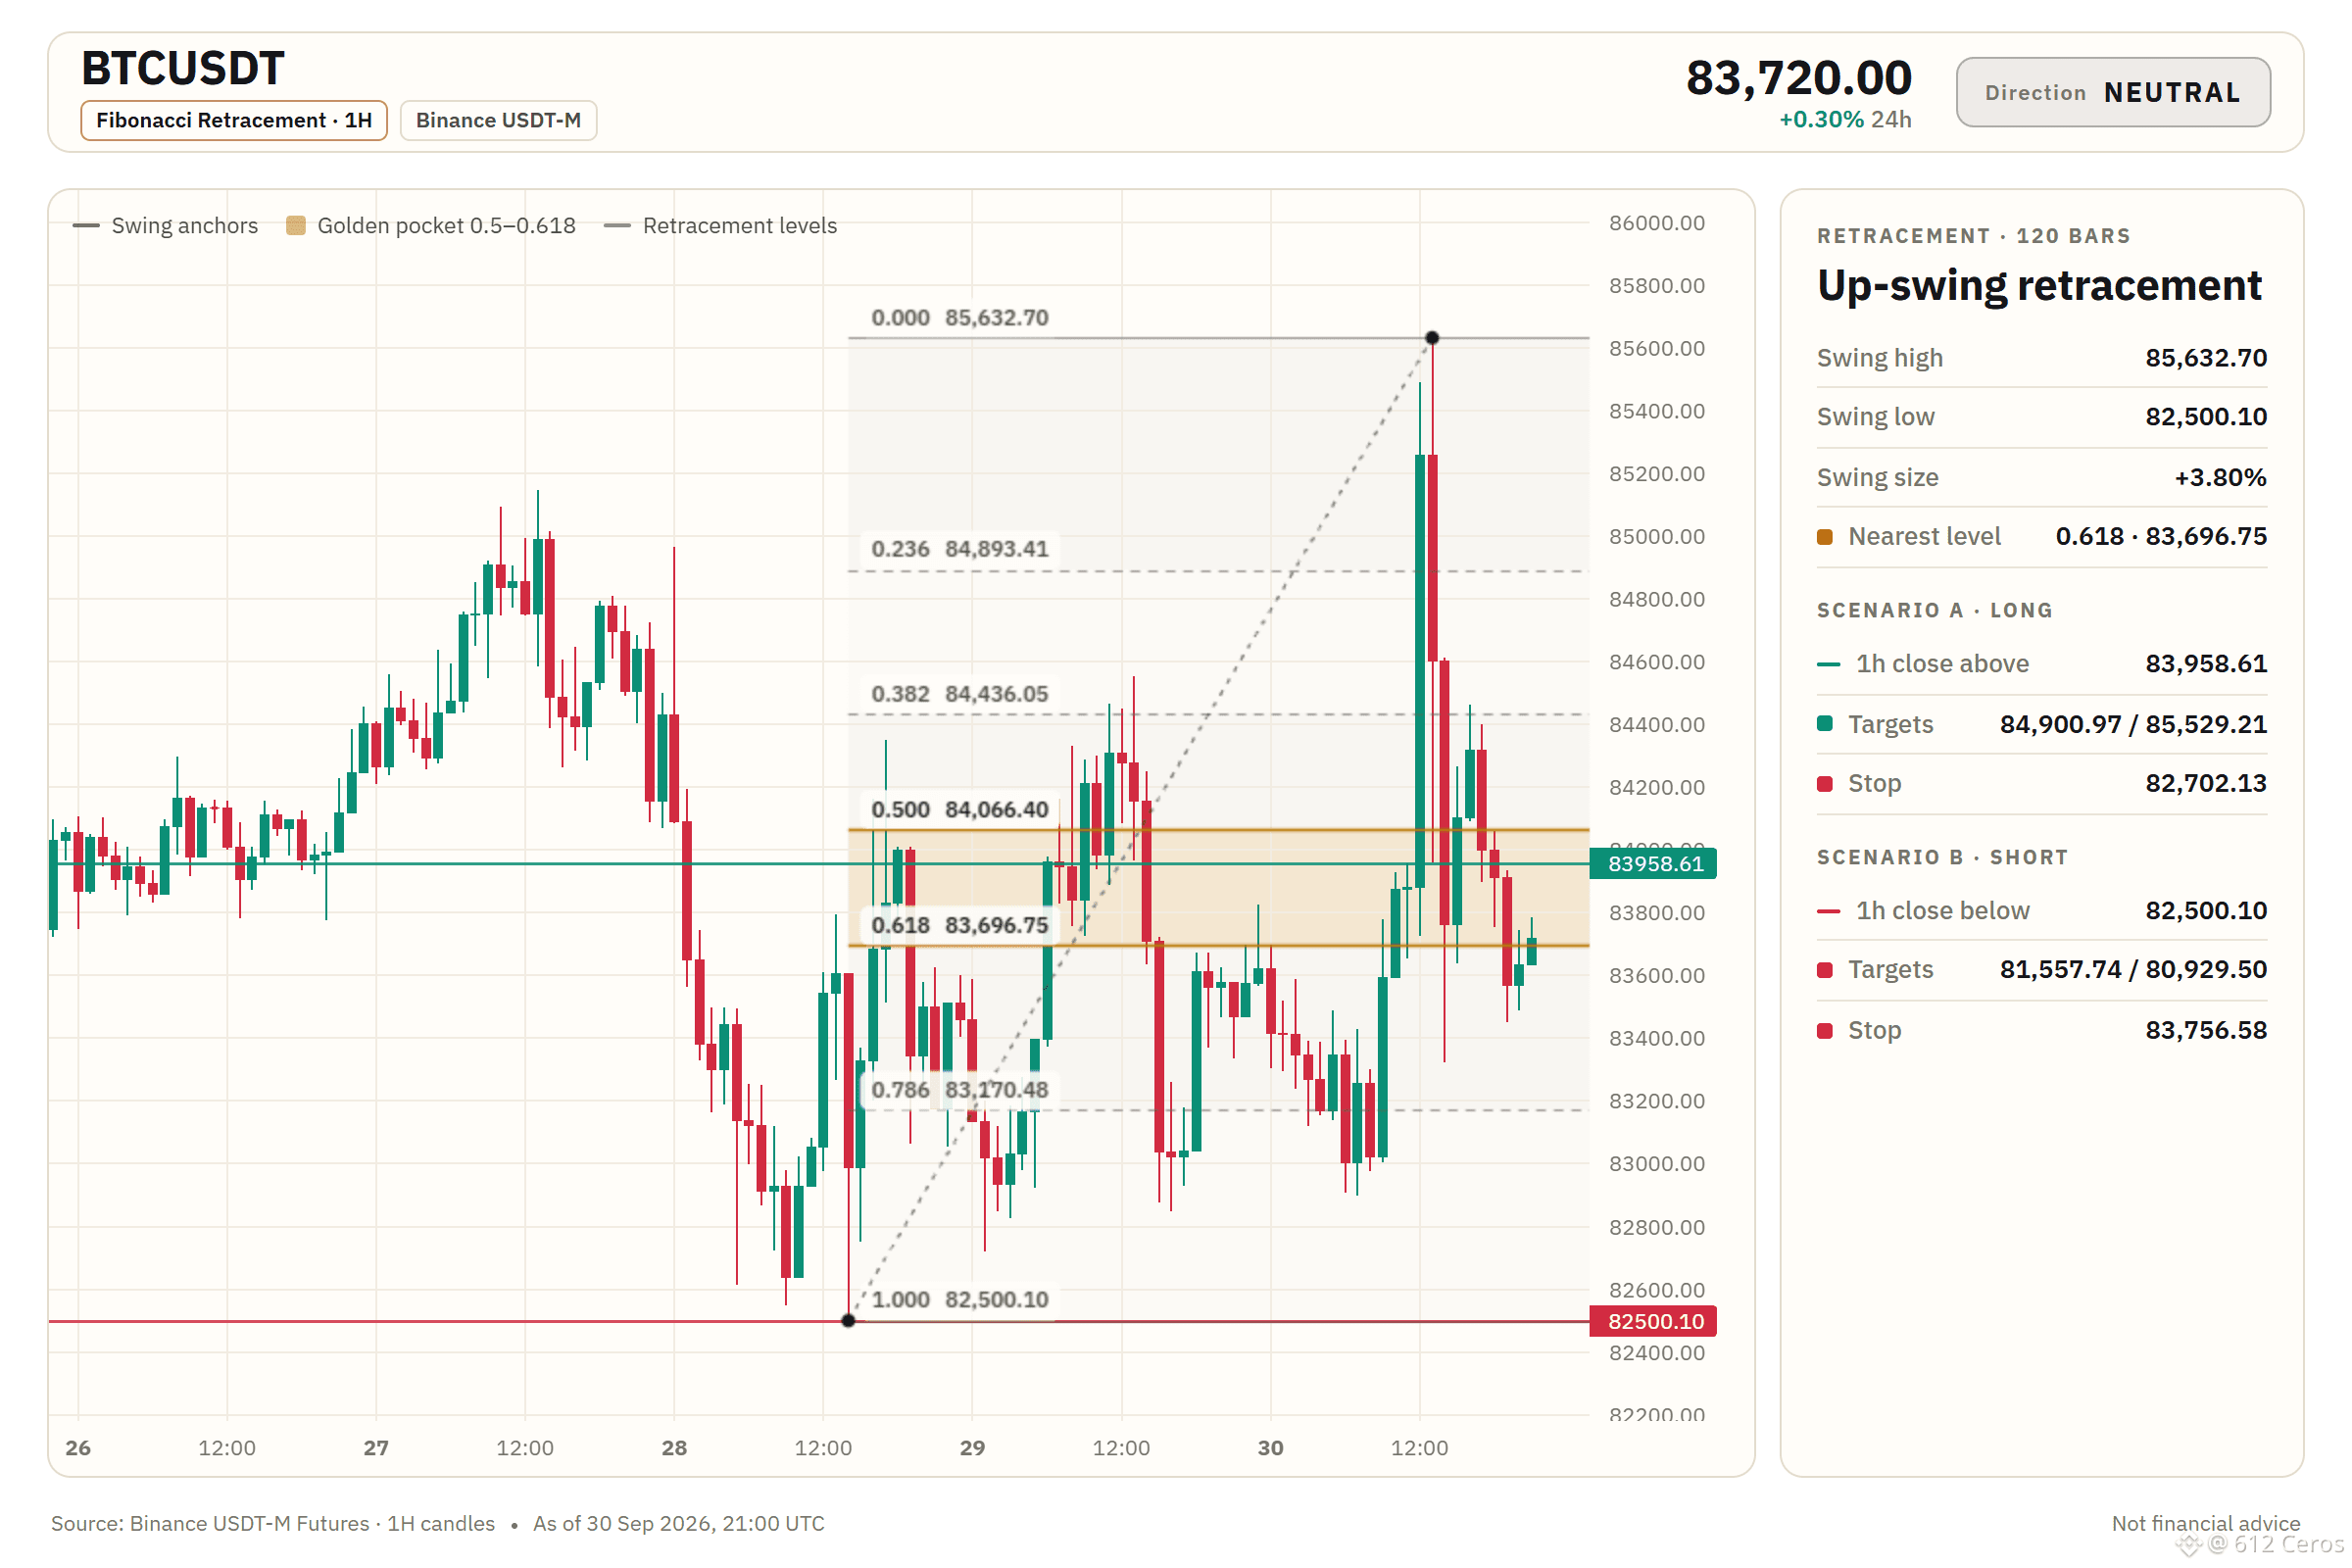
3
1.5k
·
--
LSKUSDT short setup hit TP1 ✅ Spot move was +4.68% from entry to TP1. It took about 1d 20h. Always manage risk and size positions carefully.
LSKUSDT short setup hit TP1 ✅ Spot move was +4.68% from entry to TP1. It took about 1d 20h. Always manage risk and size positions carefully.
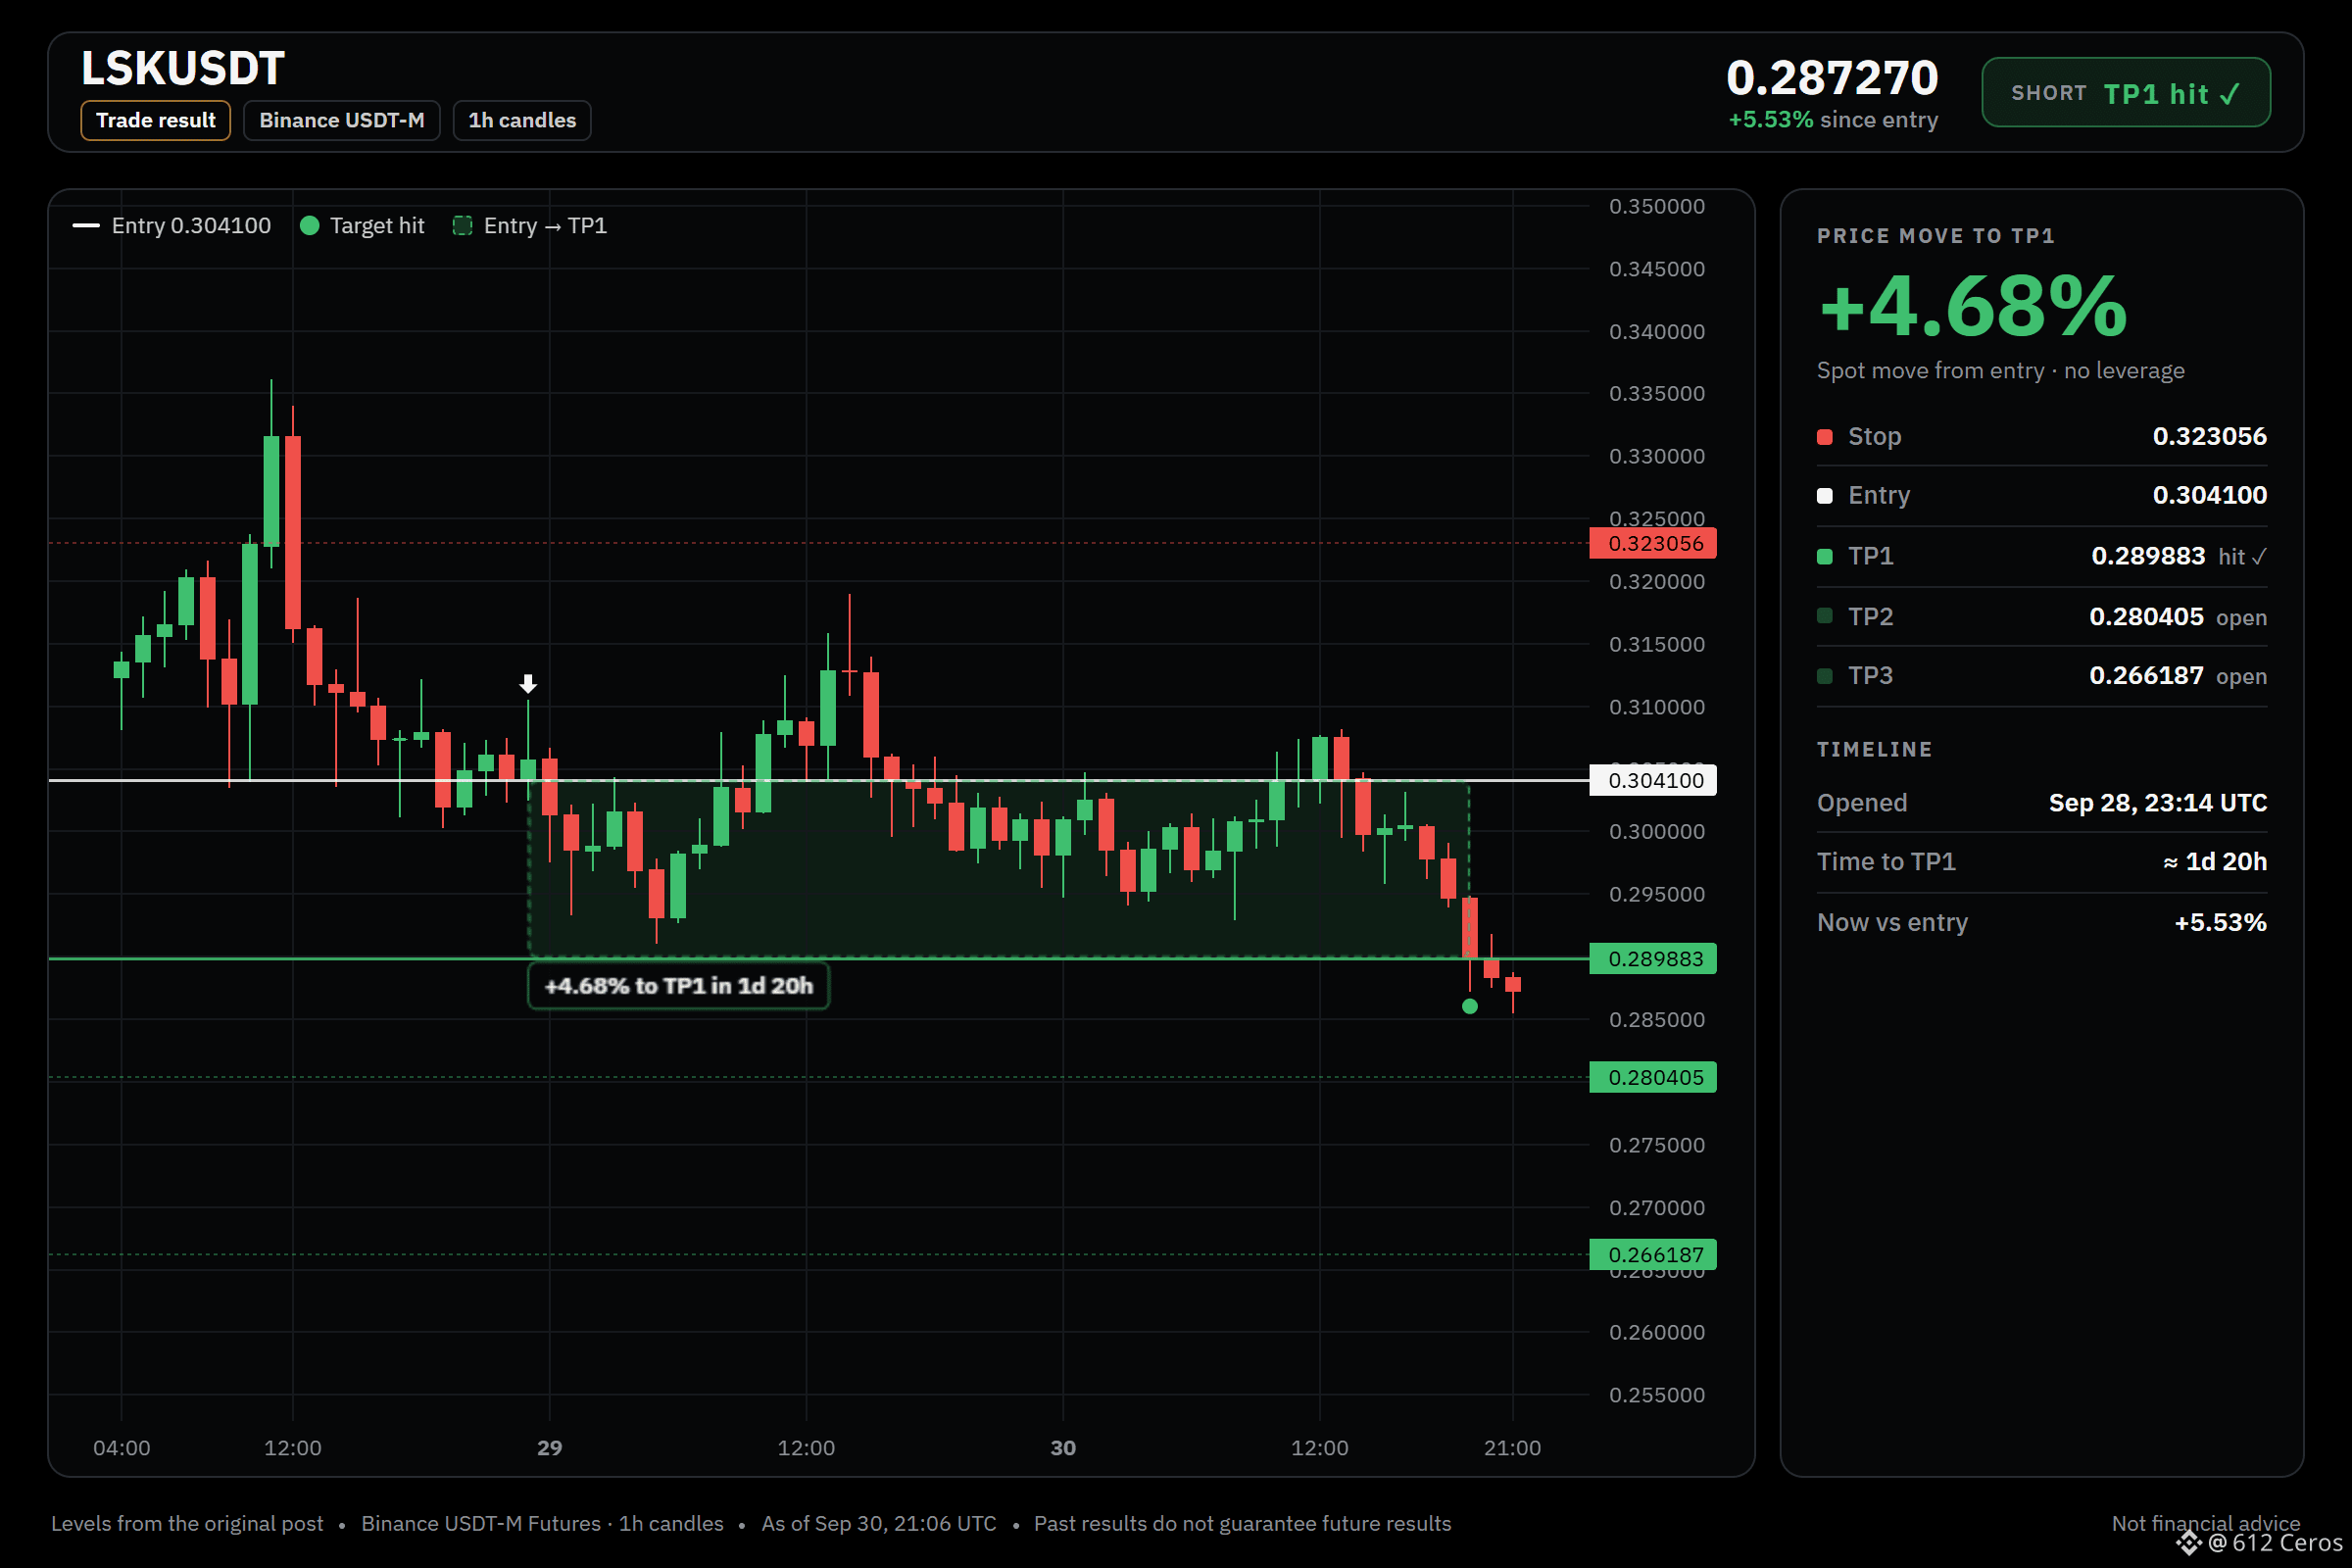
612 Ceros
·
--
BaissierLSK is trying to flip a bullish daily trend on thin confirmation.
$LSK /USDT - 🔴 Bias: SHORT (Leaning) · 5/12 signals aligned
⚠️ Heads up: counter-trend reversal bet, 5 signals of confirmation. Riskier than trading with the trend — keep size light.
What I checked: 5/12 signals aligned
✅ 1h trend: price < EMA50 < EMA200, bearish stack
✅ Trend strength (ADX/DI, 15m): ADX 23.7 with sellers in control (DI+ 15.5 vs DI− 20.4)
✅ 4h RSI: 37.9, bearish momentum (below 45)
✅ 1h RSI: 39.5, bearish momentum (below 45)
✅ Relative strength vs BTC: underperforming, −1.93% vs BTC over the last day
⚠️ Daily trend: price > EMA50 > EMA200, bullish stack
⚠️ Invalidation: the idea is wrong beyond 0.362223
Bottom line: The strongest supporting factors are the bearish 1h stack with price below both EMA50 and EMA200, the 4h RSI at 37.9 showing bearish momentum, and the 1h RSI at 39.5 also in bearish territory. The main against factor is the daily trend, which shows a bullish stack with price above EMA50 above EMA200. This is a counter-trend reversal bet, so conviction is moderate and sizing must be smaller than a trend-following setup.
📍 Entry: 0.303249 – 0.304951
🎯 TP1: 0.289883 | TP2: 0.280405 | TP3: 0.266187
🛑 SL: 0.323056
Your call:
Are you shorting this at the 0.304100 level, or are you waiting for a different entry?
Full setup on the chart 👇
📲 Want more of my latest signals? Join me here:
https://app.binance.com/uni-qr/D26WbL9t
⚠️ Personal market analysis only. NFA — manage risk and DYOR.
Educational content, not investment advice or a recommendation to buy, sell, deposit, or withdraw any asset. No paid promotion or referral/affiliate links.
$LSK /USDT - 🔴 Bias: SHORT (Leaning) · 5/12 signals aligned
⚠️ Heads up: counter-trend reversal bet, 5 signals of confirmation. Riskier than trading with the trend — keep size light.
What I checked: 5/12 signals aligned
✅ 1h trend: price < EMA50 < EMA200, bearish stack
✅ Trend strength (ADX/DI, 15m): ADX 23.7 with sellers in control (DI+ 15.5 vs DI− 20.4)
✅ 4h RSI: 37.9, bearish momentum (below 45)
✅ 1h RSI: 39.5, bearish momentum (below 45)
✅ Relative strength vs BTC: underperforming, −1.93% vs BTC over the last day
⚠️ Daily trend: price > EMA50 > EMA200, bullish stack
⚠️ Invalidation: the idea is wrong beyond 0.362223
Bottom line: The strongest supporting factors are the bearish 1h stack with price below both EMA50 and EMA200, the 4h RSI at 37.9 showing bearish momentum, and the 1h RSI at 39.5 also in bearish territory. The main against factor is the daily trend, which shows a bullish stack with price above EMA50 above EMA200. This is a counter-trend reversal bet, so conviction is moderate and sizing must be smaller than a trend-following setup.
📍 Entry: 0.303249 – 0.304951
🎯 TP1: 0.289883 | TP2: 0.280405 | TP3: 0.266187
🛑 SL: 0.323056
Your call:
Are you shorting this at the 0.304100 level, or are you waiting for a different entry?
Full setup on the chart 👇
📲 Want more of my latest signals? Join me here:
https://app.binance.com/uni-qr/D26WbL9t
⚠️ Personal market analysis only. NFA — manage risk and DYOR.
Educational content, not investment advice or a recommendation to buy, sell, deposit, or withdraw any asset. No paid promotion or referral/affiliate links.
2
1.9k
·
--
Baissier
Daily trend is bullish, so this short is already fighting the tide.
🔴 SHORT $PORTAL /USDT: expecting price to go DOWN
Bias: SHORT · Leaning · 7/12 signals agree, 1 against, 4 undecided
📍 Entry: 0.0166513 – 0.0167087 · limit order inside the zone, don't chase
🎯 TP1: 0.0160502 (-3.8%) · take about half, then move SL to entry
🎯 TP2: 0.0156303 (-6.3%) · take most of the rest
🎯 TP3: 0.0150005 (-10.1%) · final target
🛑 SL: 0.0175197 (+5.0%) · close everything, never move it further away
⚖️ Reward vs risk: 0.75R / 1.25R / 2R at TP1 / TP2 / TP3
TP1 alone pays less than the stop costs, which is why the stop moves to entry after it.
⏳ Timing: 15m momentum already agrees. Skip it if TP1 prints before you get filled.
⚠️ Heads up: counter-trend reversal bet, 7 signals of confirmation. Riskier than trading with the trend — keep size light.
Why SHORT? Technical verdict: LEANING SHORT, 7/12 signals agree, 1 against, 4 undecided.
✅ 1h trend: price < EMA50 < EMA200, bearish stack → the short-term trend is down
✅ Trend strength (ADX/DI, 15m): ADX 37.4 with sellers in control (DI+ 13.3 vs DI− 37.1) → sellers are driving the move
✅ 4h RSI: 41.9, bearish momentum (below 45) → sellers have the momentum
⚠️ Daily trend: price > EMA50 > EMA200, bullish stack → the big-picture trend is up
🤔 Why short when the daily trend is bullish?
💡 The daily trend is bullish, so this is a counter-trend reversal bet.
🤔 Where is the entry and invalidation?
💡 Enter between 0.0166513 and 0.0167087.
Over to you:
If you are long or waiting for a flip, what level would change your mind?
Full setup on the chart 👇
{future}(PORTALUSDT)
📲 Want more of my latest signals? Join me here:
[https://app.binance.com/uni-qr/D26WbL9t](https://app.binance.com/uni-qr/D26WbL9t)
⚠️ Personal market analysis only. NFA — manage risk and DYOR.
Educational content, not investment advice or a recommendation to buy, sell, deposit, or withdraw any asset. No paid promotion or referral/affiliate links.
Daily trend is bullish, so this short is already fighting the tide.
🔴 SHORT $PORTAL /USDT: expecting price to go DOWN
Bias: SHORT · Leaning · 7/12 signals agree, 1 against, 4 undecided
📍 Entry: 0.0166513 – 0.0167087 · limit order inside the zone, don't chase
🎯 TP1: 0.0160502 (-3.8%) · take about half, then move SL to entry
🎯 TP2: 0.0156303 (-6.3%) · take most of the rest
🎯 TP3: 0.0150005 (-10.1%) · final target
🛑 SL: 0.0175197 (+5.0%) · close everything, never move it further away
⚖️ Reward vs risk: 0.75R / 1.25R / 2R at TP1 / TP2 / TP3
TP1 alone pays less than the stop costs, which is why the stop moves to entry after it.
⏳ Timing: 15m momentum already agrees. Skip it if TP1 prints before you get filled.
⚠️ Heads up: counter-trend reversal bet, 7 signals of confirmation. Riskier than trading with the trend — keep size light.
Why SHORT? Technical verdict: LEANING SHORT, 7/12 signals agree, 1 against, 4 undecided.
✅ 1h trend: price < EMA50 < EMA200, bearish stack → the short-term trend is down
✅ Trend strength (ADX/DI, 15m): ADX 37.4 with sellers in control (DI+ 13.3 vs DI− 37.1) → sellers are driving the move
✅ 4h RSI: 41.9, bearish momentum (below 45) → sellers have the momentum
⚠️ Daily trend: price > EMA50 > EMA200, bullish stack → the big-picture trend is up
🤔 Why short when the daily trend is bullish?
💡 The daily trend is bullish, so this is a counter-trend reversal bet.
🤔 Where is the entry and invalidation?
💡 Enter between 0.0166513 and 0.0167087.
Over to you:
If you are long or waiting for a flip, what level would change your mind?
Full setup on the chart 👇
📲 Want more of my latest signals? Join me here:
https://app.binance.com/uni-qr/D26WbL9t
⚠️ Personal market analysis only. NFA — manage risk and DYOR.
Educational content, not investment advice or a recommendation to buy, sell, deposit, or withdraw any asset. No paid promotion or referral/affiliate links.
🔴 SHORT $PORTAL /USDT: expecting price to go DOWN
Bias: SHORT · Leaning · 7/12 signals agree, 1 against, 4 undecided
📍 Entry: 0.0166513 – 0.0167087 · limit order inside the zone, don't chase
🎯 TP1: 0.0160502 (-3.8%) · take about half, then move SL to entry
🎯 TP2: 0.0156303 (-6.3%) · take most of the rest
🎯 TP3: 0.0150005 (-10.1%) · final target
🛑 SL: 0.0175197 (+5.0%) · close everything, never move it further away
⚖️ Reward vs risk: 0.75R / 1.25R / 2R at TP1 / TP2 / TP3
TP1 alone pays less than the stop costs, which is why the stop moves to entry after it.
⏳ Timing: 15m momentum already agrees. Skip it if TP1 prints before you get filled.
⚠️ Heads up: counter-trend reversal bet, 7 signals of confirmation. Riskier than trading with the trend — keep size light.
Why SHORT? Technical verdict: LEANING SHORT, 7/12 signals agree, 1 against, 4 undecided.
✅ 1h trend: price < EMA50 < EMA200, bearish stack → the short-term trend is down
✅ Trend strength (ADX/DI, 15m): ADX 37.4 with sellers in control (DI+ 13.3 vs DI− 37.1) → sellers are driving the move
✅ 4h RSI: 41.9, bearish momentum (below 45) → sellers have the momentum
⚠️ Daily trend: price > EMA50 > EMA200, bullish stack → the big-picture trend is up
🤔 Why short when the daily trend is bullish?
💡 The daily trend is bullish, so this is a counter-trend reversal bet.
🤔 Where is the entry and invalidation?
💡 Enter between 0.0166513 and 0.0167087.
Over to you:
If you are long or waiting for a flip, what level would change your mind?
Full setup on the chart 👇
📲 Want more of my latest signals? Join me here:
https://app.binance.com/uni-qr/D26WbL9t
⚠️ Personal market analysis only. NFA — manage risk and DYOR.
Educational content, not investment advice or a recommendation to buy, sell, deposit, or withdraw any asset. No paid promotion or referral/affiliate links.
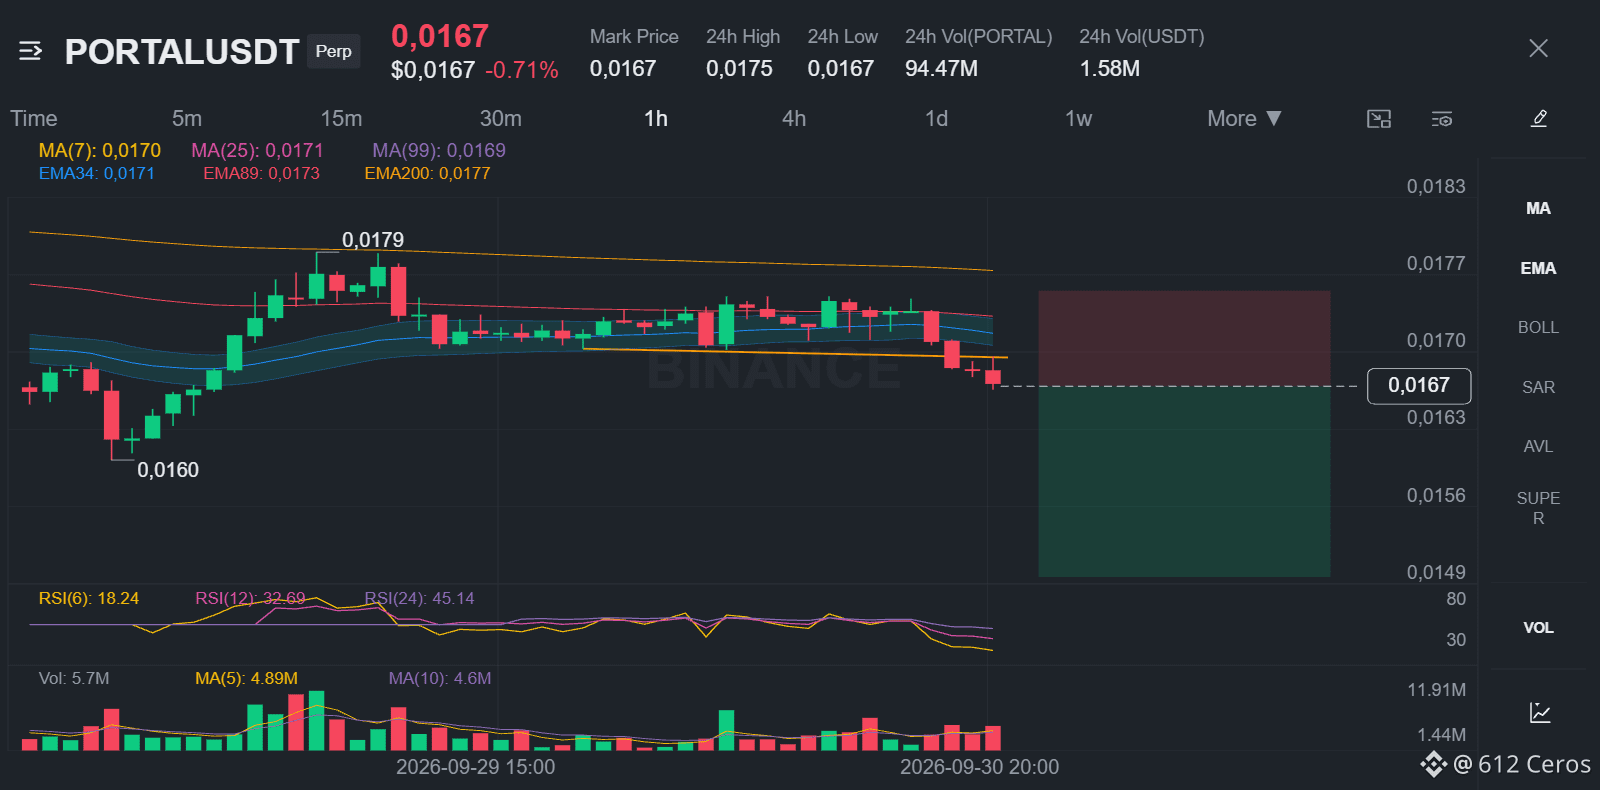
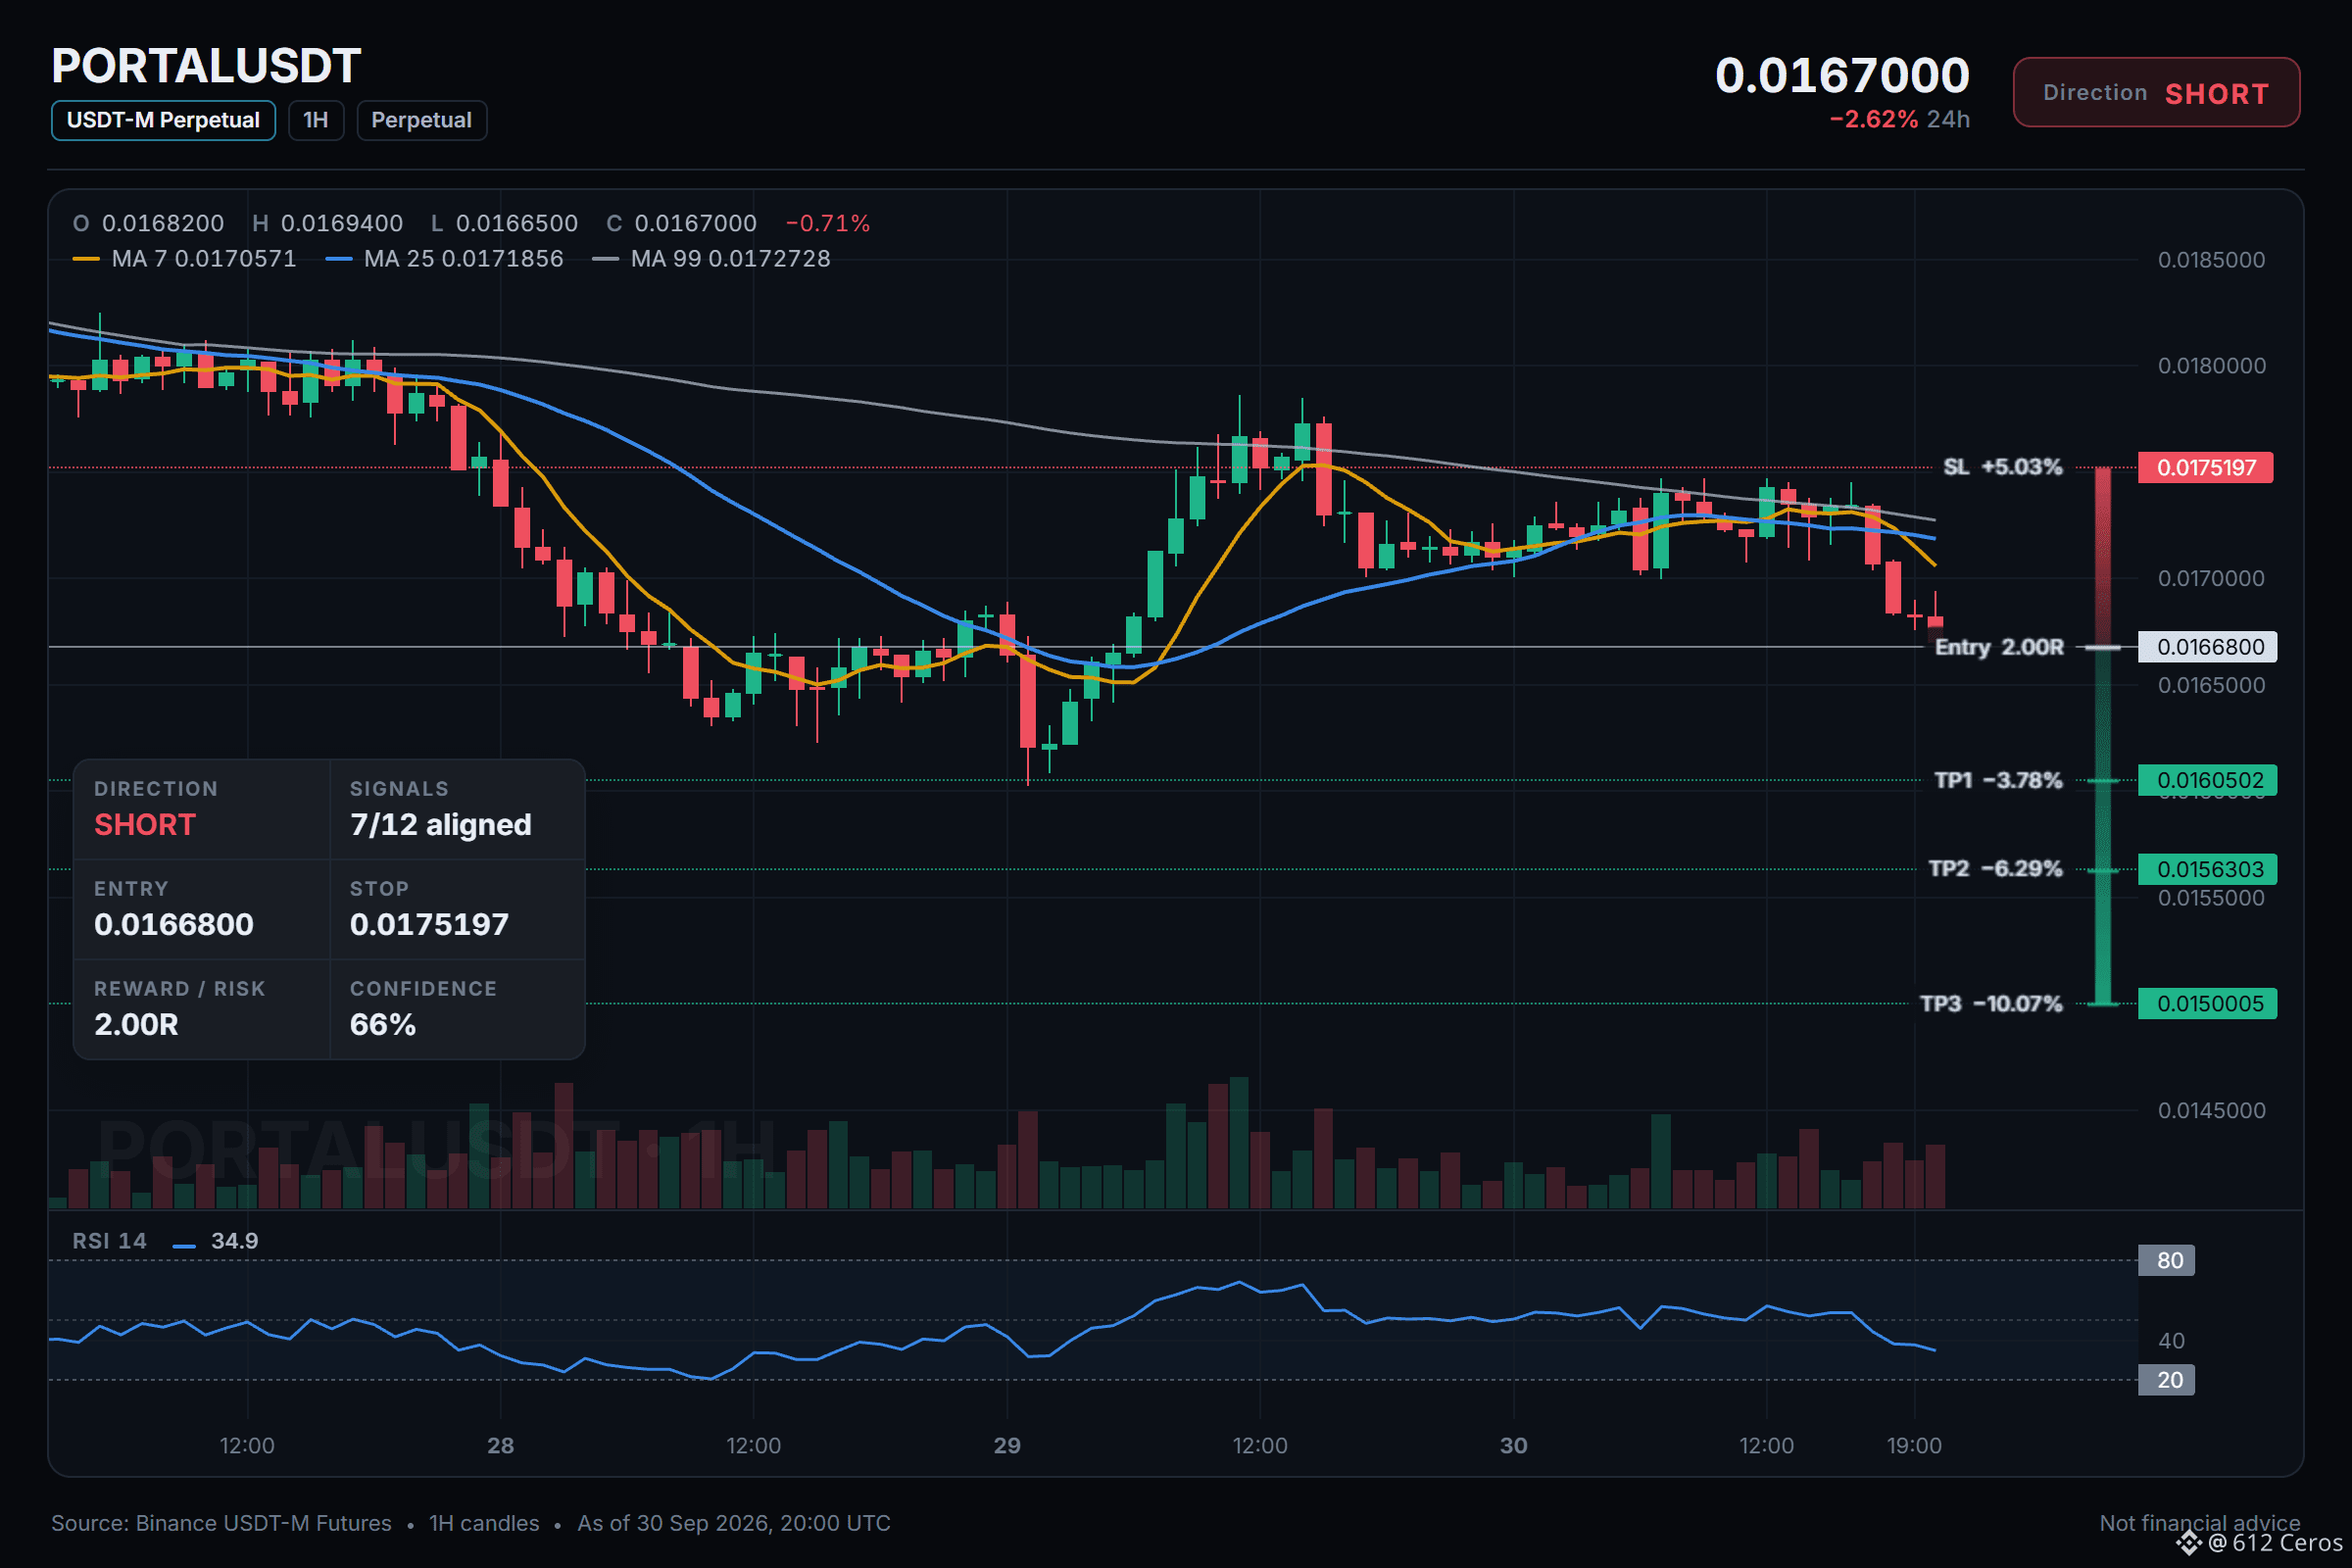
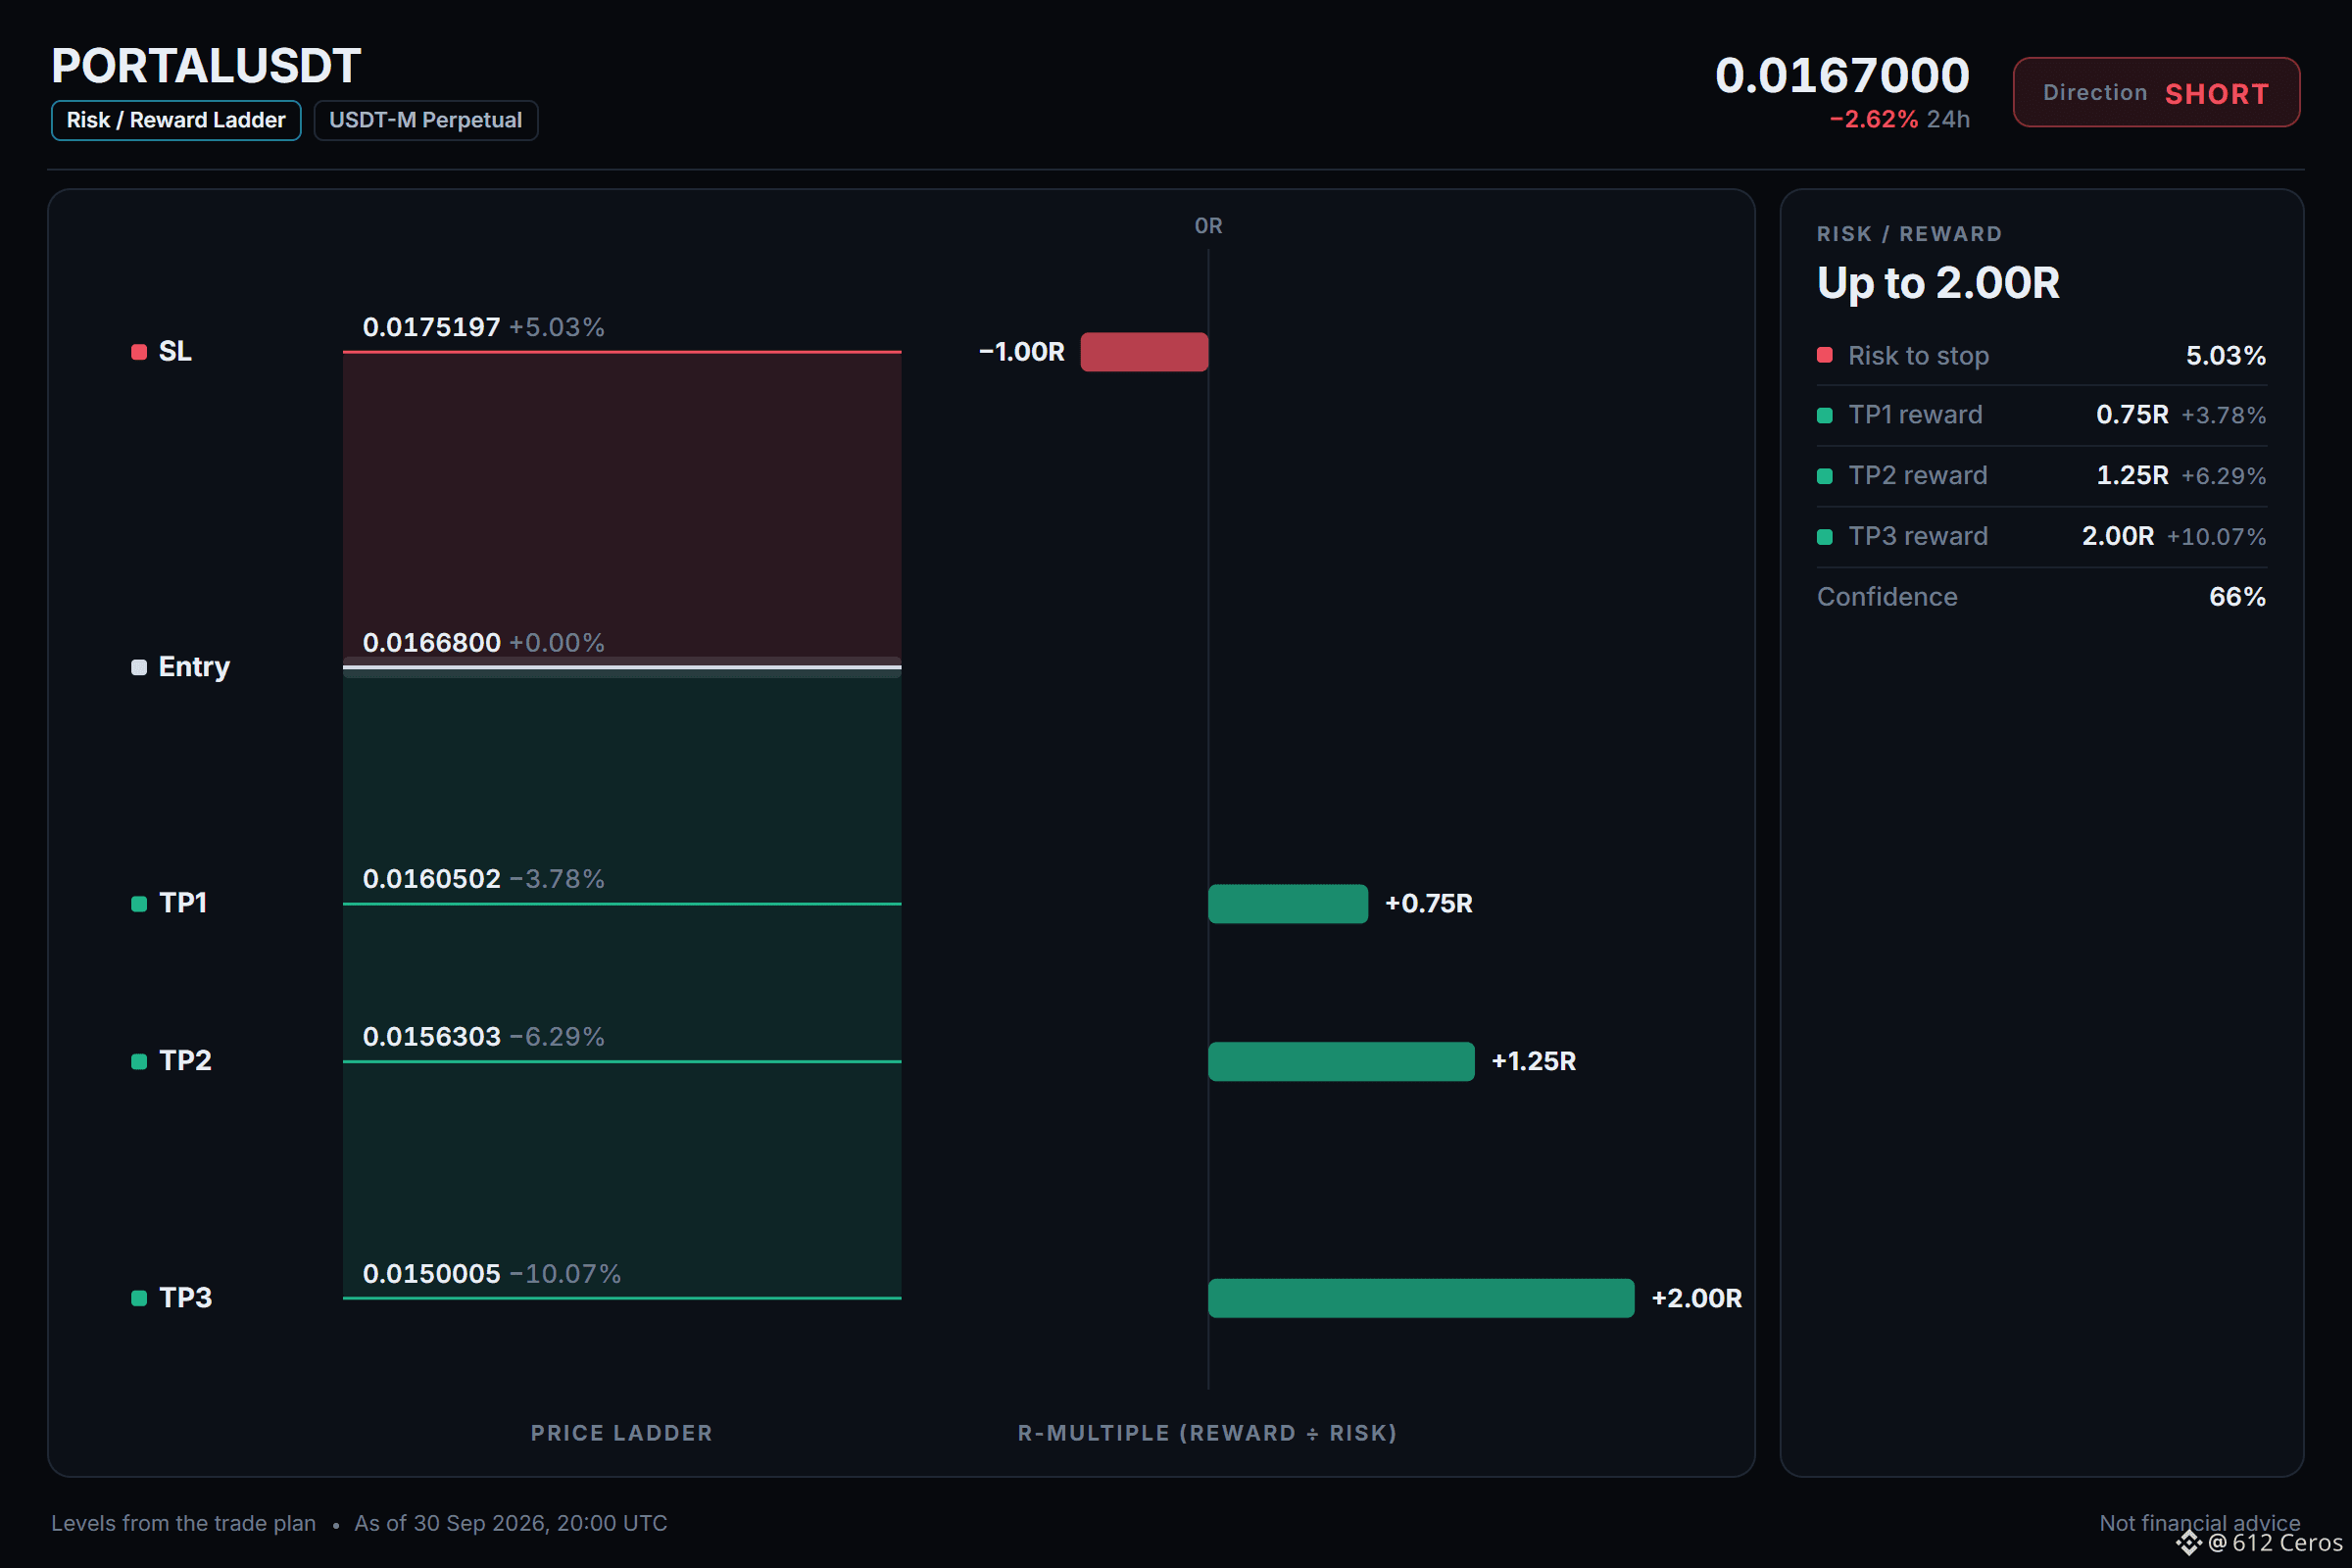
689
·
--
Range is holding, so no edge yet for SOL
⚪ $SOL /USDT: NO TRADE YET, waiting for one side to break
Bias: NEUTRAL · 2 bullish vs 4 bearish
The plan is conditional:
🟢 Scenario A: LONG on a 1h close above 123.3900 (top of the resistance zone)
Trigger 123.3900 → targets 126.0241 / 127.7801 / 130.4142, stop 119.8779
🔴 Scenario B: SHORT on a 1h close below 116.8400 (24h low)
Trigger 116.8400 → targets 114.2059 / 112.4499 / 109.8158, stop 120.3521
⏸ Between 116.8400 and 123.3900 (5.6% wide): no edge, no trade.
Technical read: NEUTRAL. 2 of 12 signals bullish, 4 bearish, 6 undecided.
Bullish side:
🟢 Daily trend: price > EMA50 > EMA200, bullish stack → the big-picture trend is up
🟢 4h trend: price > EMA50 > EMA200, bullish stack → the swing trend is up
Bearish side:
🔴 Trend strength (ADX/DI, 15m): ADX 31.9 with sellers in control (DI+ 14.9 vs DI− 33.0) → sellers are driving the move
🔴 BTC backdrop: BTC trend is bearish and correlation is 0.89 → BTC is falling and this coin tends to follow
🔴 4h RSI: 42.6, bearish momentum (below 45) → sellers have the momentum
🔴 1h RSI: 40.9, bearish momentum (below 45) → sellers have the momentum
My read:
No edge right now because the 1h price lacks clear direction and two strong factors argue against. The daily trend is bullish and the 4h trend is bullish, but sellers are driving the 15m move with ADX 31.9 (DI+ 14.9 vs DI− 33.0), and BTC is falling with 0.89 correlation. The 1h close must break 123.3900 to target the long setup, or break 116.8400 to target the short setup.
💬 Which trigger level do you think will hold first, 123.3900 or 116.8400?
Click here to view the chart 👇️
{future}(SOLUSDT)
📲 Want more of my latest signals? Join me here:
[https://app.binance.com/uni-qr/D26WbL9t](https://app.binance.com/uni-qr/D26WbL9t)
⚠️ Personal market analysis only. NFA — manage risk and DYOR.
Educational content, not investment advice or a recommendation to buy, sell, deposit, or withdraw any asset. No paid promotion or referral/affiliate links.
Range is holding, so no edge yet for SOL
⚪ $SOL /USDT: NO TRADE YET, waiting for one side to break
Bias: NEUTRAL · 2 bullish vs 4 bearish
The plan is conditional:
🟢 Scenario A: LONG on a 1h close above 123.3900 (top of the resistance zone)
Trigger 123.3900 → targets 126.0241 / 127.7801 / 130.4142, stop 119.8779
🔴 Scenario B: SHORT on a 1h close below 116.8400 (24h low)
Trigger 116.8400 → targets 114.2059 / 112.4499 / 109.8158, stop 120.3521
⏸ Between 116.8400 and 123.3900 (5.6% wide): no edge, no trade.
Technical read: NEUTRAL. 2 of 12 signals bullish, 4 bearish, 6 undecided.
Bullish side:
🟢 Daily trend: price > EMA50 > EMA200, bullish stack → the big-picture trend is up
🟢 4h trend: price > EMA50 > EMA200, bullish stack → the swing trend is up
Bearish side:
🔴 Trend strength (ADX/DI, 15m): ADX 31.9 with sellers in control (DI+ 14.9 vs DI− 33.0) → sellers are driving the move
🔴 BTC backdrop: BTC trend is bearish and correlation is 0.89 → BTC is falling and this coin tends to follow
🔴 4h RSI: 42.6, bearish momentum (below 45) → sellers have the momentum
🔴 1h RSI: 40.9, bearish momentum (below 45) → sellers have the momentum
My read:
No edge right now because the 1h price lacks clear direction and two strong factors argue against. The daily trend is bullish and the 4h trend is bullish, but sellers are driving the 15m move with ADX 31.9 (DI+ 14.9 vs DI− 33.0), and BTC is falling with 0.89 correlation. The 1h close must break 123.3900 to target the long setup, or break 116.8400 to target the short setup.
💬 Which trigger level do you think will hold first, 123.3900 or 116.8400?
Click here to view the chart 👇️
📲 Want more of my latest signals? Join me here:
https://app.binance.com/uni-qr/D26WbL9t
⚠️ Personal market analysis only. NFA — manage risk and DYOR.
Educational content, not investment advice or a recommendation to buy, sell, deposit, or withdraw any asset. No paid promotion or referral/affiliate links.
⚪ $SOL /USDT: NO TRADE YET, waiting for one side to break
Bias: NEUTRAL · 2 bullish vs 4 bearish
The plan is conditional:
🟢 Scenario A: LONG on a 1h close above 123.3900 (top of the resistance zone)
Trigger 123.3900 → targets 126.0241 / 127.7801 / 130.4142, stop 119.8779
🔴 Scenario B: SHORT on a 1h close below 116.8400 (24h low)
Trigger 116.8400 → targets 114.2059 / 112.4499 / 109.8158, stop 120.3521
⏸ Between 116.8400 and 123.3900 (5.6% wide): no edge, no trade.
Technical read: NEUTRAL. 2 of 12 signals bullish, 4 bearish, 6 undecided.
Bullish side:
🟢 Daily trend: price > EMA50 > EMA200, bullish stack → the big-picture trend is up
🟢 4h trend: price > EMA50 > EMA200, bullish stack → the swing trend is up
Bearish side:
🔴 Trend strength (ADX/DI, 15m): ADX 31.9 with sellers in control (DI+ 14.9 vs DI− 33.0) → sellers are driving the move
🔴 BTC backdrop: BTC trend is bearish and correlation is 0.89 → BTC is falling and this coin tends to follow
🔴 4h RSI: 42.6, bearish momentum (below 45) → sellers have the momentum
🔴 1h RSI: 40.9, bearish momentum (below 45) → sellers have the momentum
My read:
No edge right now because the 1h price lacks clear direction and two strong factors argue against. The daily trend is bullish and the 4h trend is bullish, but sellers are driving the 15m move with ADX 31.9 (DI+ 14.9 vs DI− 33.0), and BTC is falling with 0.89 correlation. The 1h close must break 123.3900 to target the long setup, or break 116.8400 to target the short setup.
💬 Which trigger level do you think will hold first, 123.3900 or 116.8400?
Click here to view the chart 👇️
📲 Want more of my latest signals? Join me here:
https://app.binance.com/uni-qr/D26WbL9t
⚠️ Personal market analysis only. NFA — manage risk and DYOR.
Educational content, not investment advice or a recommendation to buy, sell, deposit, or withdraw any asset. No paid promotion or referral/affiliate links.
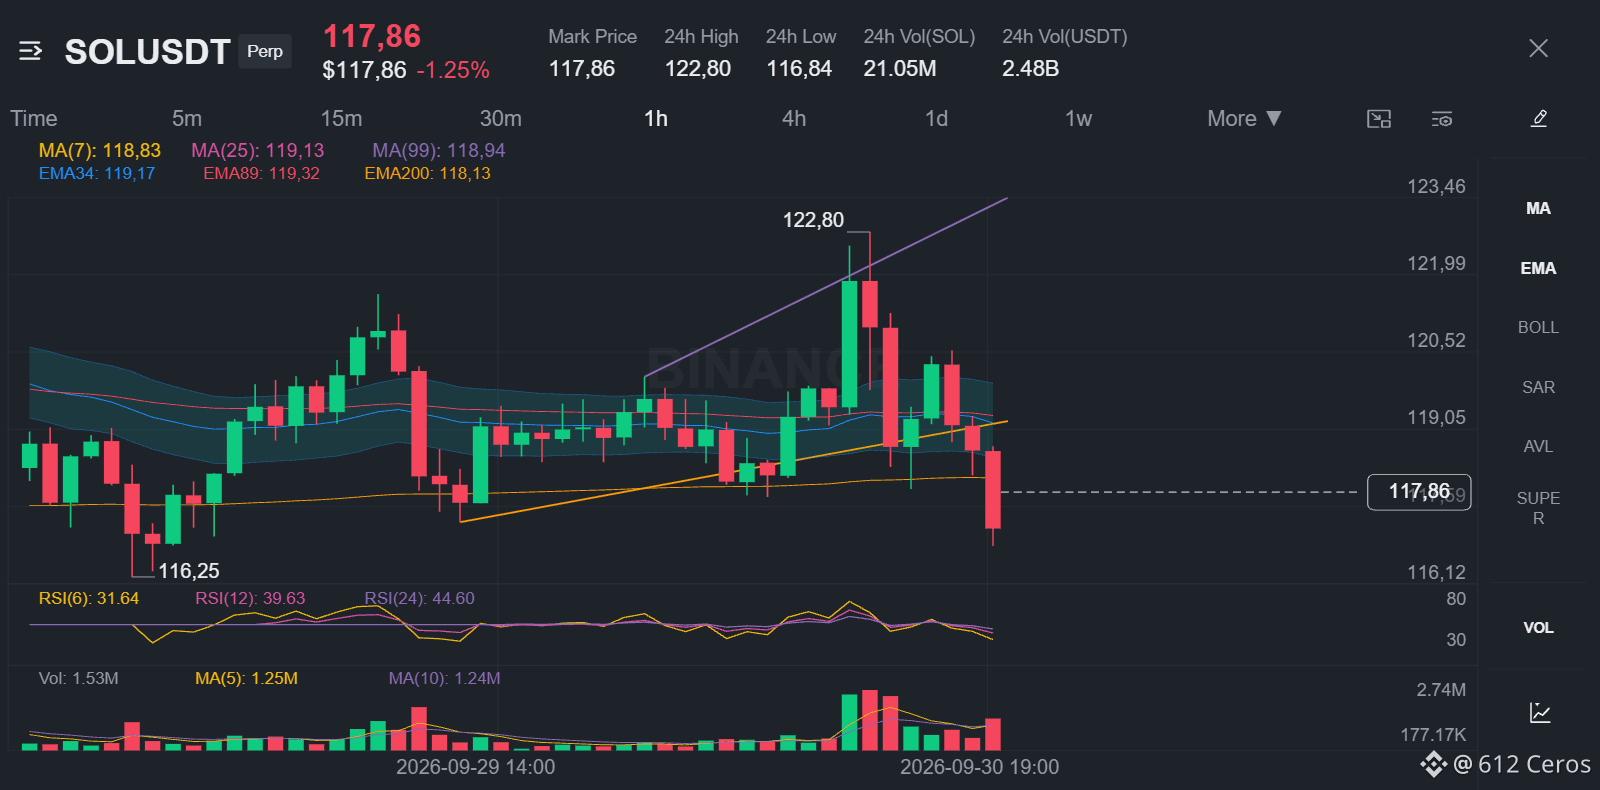
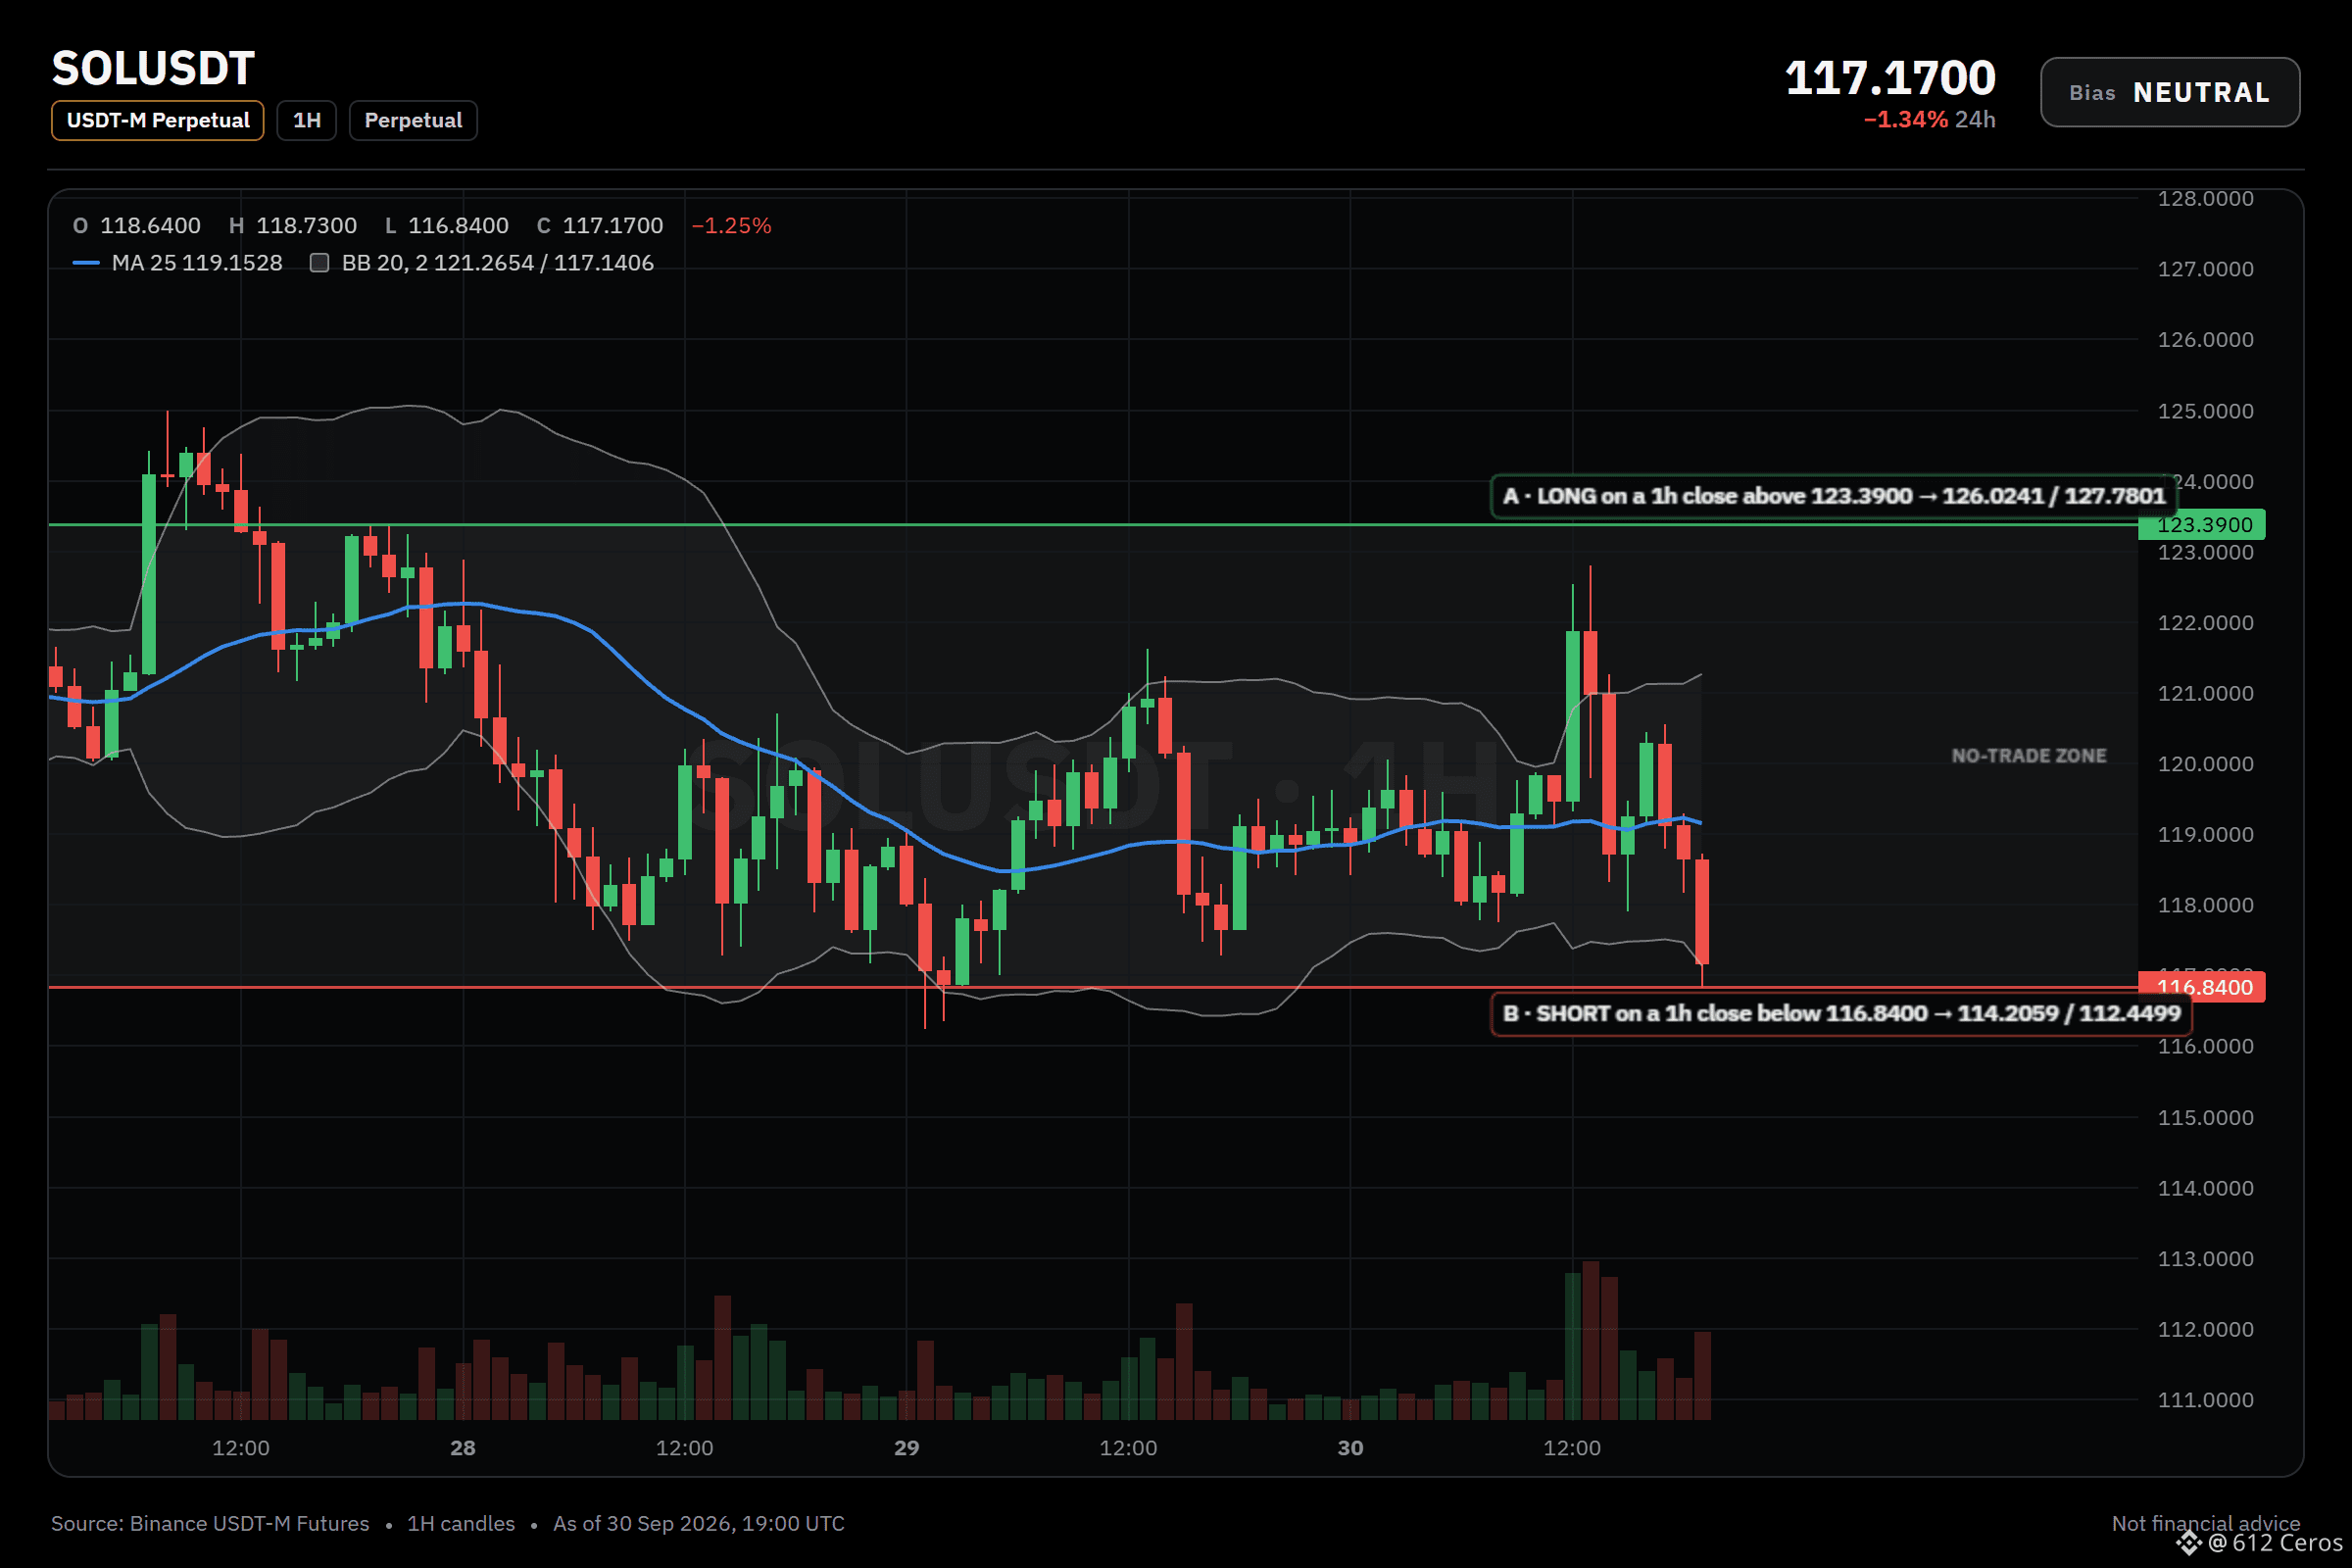
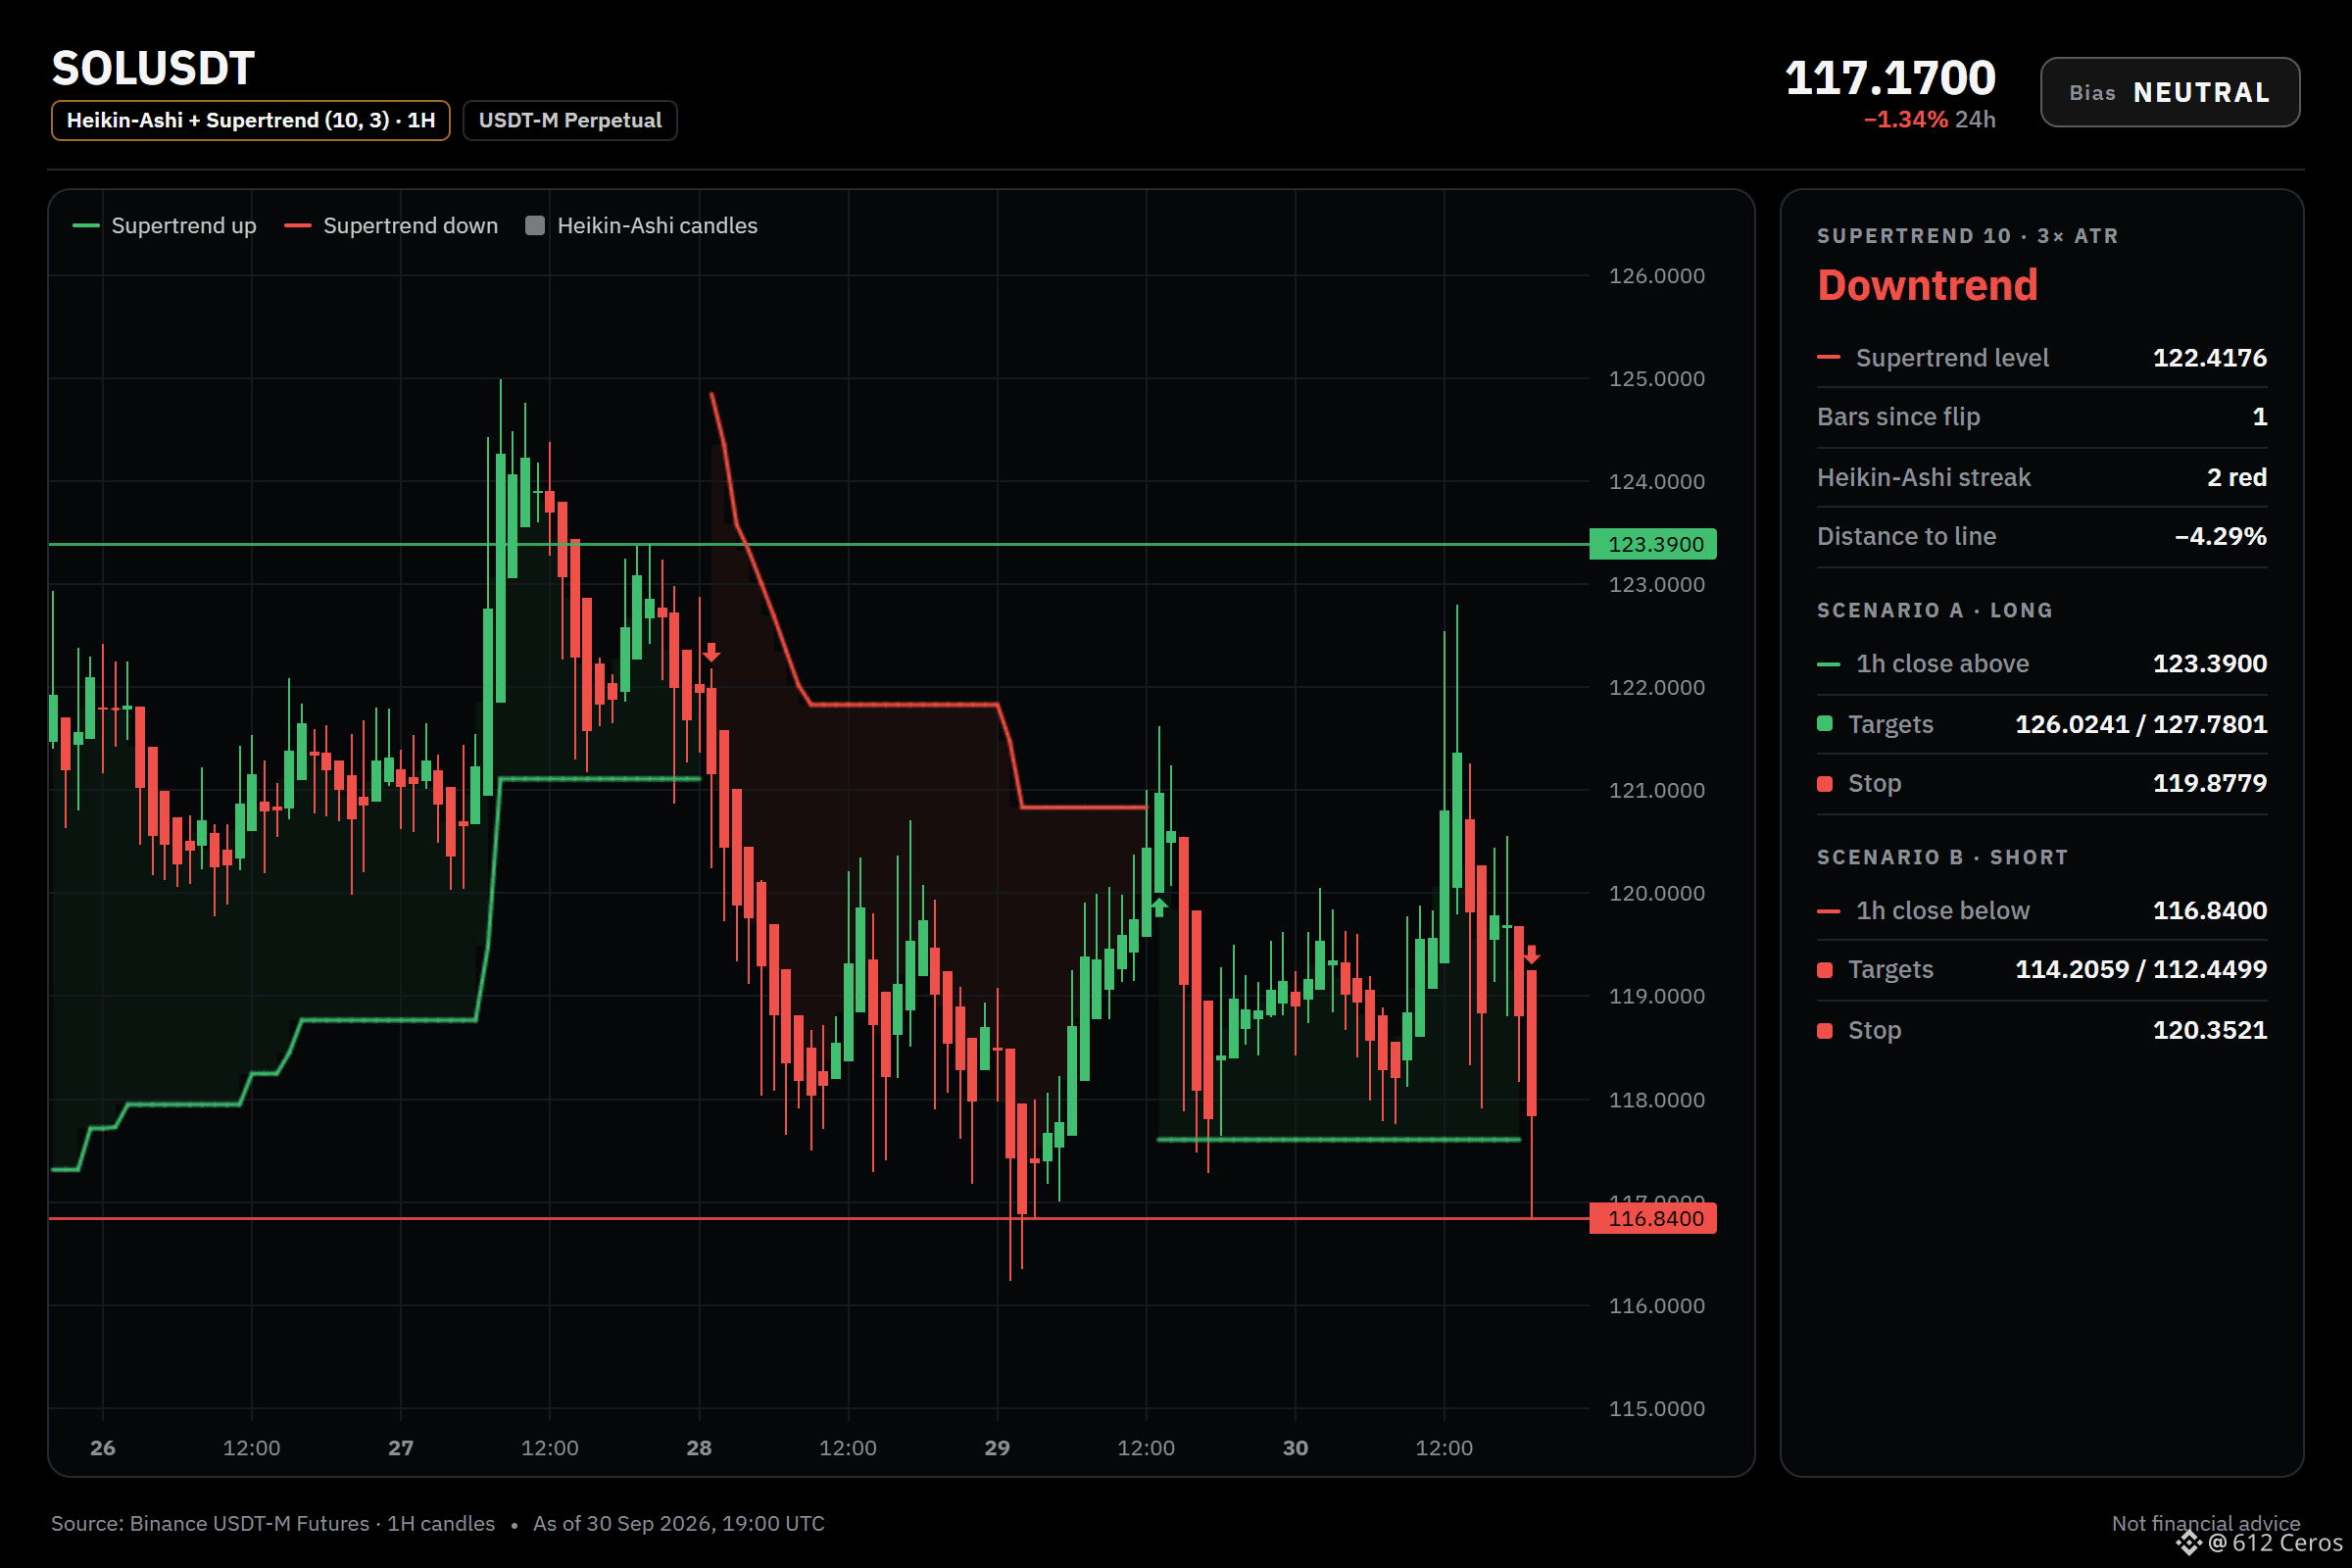
5
864
·
--
ETH is not trading a clear direction right now.
⚪ $ETH /USDT: NO TRADE YET, waiting for one side to break
Bias: NEUTRAL · 1 bullish vs 1 bearish
The plan is conditional:
🟢 Scenario A: LONG on a 1h close above 2705.09 (top of the resistance zone)
Trigger 2705.09 → targets 2742.77 / 2767.89 / 2805.57, stop 2654.85
🔴 Scenario B: SHORT on a 1h close below 2656.23 (24h low)
Trigger 2656.23 → targets 2618.55 / 2593.43 / 2555.75, stop 2706.47
⏸ Between 2656.23 and 2705.09 (1.8% wide): no edge, no trade.
Technical read: NEUTRAL. 1 of 12 signals bullish, 1 bearish, 10 undecided.
Bullish side:
🟢 Daily trend: price > EMA50 > EMA200, bullish stack → the big-picture trend is up
Bearish side:
🔴 Trend strength (ADX/DI, 15m): ADX 26.5 with sellers in control (DI+ 15.1 vs DI− 25.1) → sellers are driving the move
My read:
There is no edge yet because the daily trend is bullish while 15m sellers are driving the move with ADX 26.5 and DI- 25.1 against DI+ 15.1. A bullish setup needs a 1h close above 2705.09 to confirm; a bearish setup needs a 1h close below 2656.23 to confirm. No position is recommended until one of these triggers is taken out.
Your call:
Which trigger level do you think will hold first, 2705.09 or 2656.23?
Click here to view the chart 👇️
{future}(ETHUSDT)
📲 Want more of my latest signals? Join me here:
[https://app.binance.com/uni-qr/D26WbL9t](https://app.binance.com/uni-qr/D26WbL9t)
⚠️ Personal market analysis only. NFA — manage risk and DYOR.
Educational content, not investment advice or a recommendation to buy, sell, deposit, or withdraw any asset. No paid promotion or referral/affiliate links.
ETH is not trading a clear direction right now.
⚪ $ETH /USDT: NO TRADE YET, waiting for one side to break
Bias: NEUTRAL · 1 bullish vs 1 bearish
The plan is conditional:
🟢 Scenario A: LONG on a 1h close above 2705.09 (top of the resistance zone)
Trigger 2705.09 → targets 2742.77 / 2767.89 / 2805.57, stop 2654.85
🔴 Scenario B: SHORT on a 1h close below 2656.23 (24h low)
Trigger 2656.23 → targets 2618.55 / 2593.43 / 2555.75, stop 2706.47
⏸ Between 2656.23 and 2705.09 (1.8% wide): no edge, no trade.
Technical read: NEUTRAL. 1 of 12 signals bullish, 1 bearish, 10 undecided.
Bullish side:
🟢 Daily trend: price > EMA50 > EMA200, bullish stack → the big-picture trend is up
Bearish side:
🔴 Trend strength (ADX/DI, 15m): ADX 26.5 with sellers in control (DI+ 15.1 vs DI− 25.1) → sellers are driving the move
My read:
There is no edge yet because the daily trend is bullish while 15m sellers are driving the move with ADX 26.5 and DI- 25.1 against DI+ 15.1. A bullish setup needs a 1h close above 2705.09 to confirm; a bearish setup needs a 1h close below 2656.23 to confirm. No position is recommended until one of these triggers is taken out.
Your call:
Which trigger level do you think will hold first, 2705.09 or 2656.23?
Click here to view the chart 👇️
📲 Want more of my latest signals? Join me here:
https://app.binance.com/uni-qr/D26WbL9t
⚠️ Personal market analysis only. NFA — manage risk and DYOR.
Educational content, not investment advice or a recommendation to buy, sell, deposit, or withdraw any asset. No paid promotion or referral/affiliate links.
⚪ $ETH /USDT: NO TRADE YET, waiting for one side to break
Bias: NEUTRAL · 1 bullish vs 1 bearish
The plan is conditional:
🟢 Scenario A: LONG on a 1h close above 2705.09 (top of the resistance zone)
Trigger 2705.09 → targets 2742.77 / 2767.89 / 2805.57, stop 2654.85
🔴 Scenario B: SHORT on a 1h close below 2656.23 (24h low)
Trigger 2656.23 → targets 2618.55 / 2593.43 / 2555.75, stop 2706.47
⏸ Between 2656.23 and 2705.09 (1.8% wide): no edge, no trade.
Technical read: NEUTRAL. 1 of 12 signals bullish, 1 bearish, 10 undecided.
Bullish side:
🟢 Daily trend: price > EMA50 > EMA200, bullish stack → the big-picture trend is up
Bearish side:
🔴 Trend strength (ADX/DI, 15m): ADX 26.5 with sellers in control (DI+ 15.1 vs DI− 25.1) → sellers are driving the move
My read:
There is no edge yet because the daily trend is bullish while 15m sellers are driving the move with ADX 26.5 and DI- 25.1 against DI+ 15.1. A bullish setup needs a 1h close above 2705.09 to confirm; a bearish setup needs a 1h close below 2656.23 to confirm. No position is recommended until one of these triggers is taken out.
Your call:
Which trigger level do you think will hold first, 2705.09 or 2656.23?
Click here to view the chart 👇️
📲 Want more of my latest signals? Join me here:
https://app.binance.com/uni-qr/D26WbL9t
⚠️ Personal market analysis only. NFA — manage risk and DYOR.
Educational content, not investment advice or a recommendation to buy, sell, deposit, or withdraw any asset. No paid promotion or referral/affiliate links.
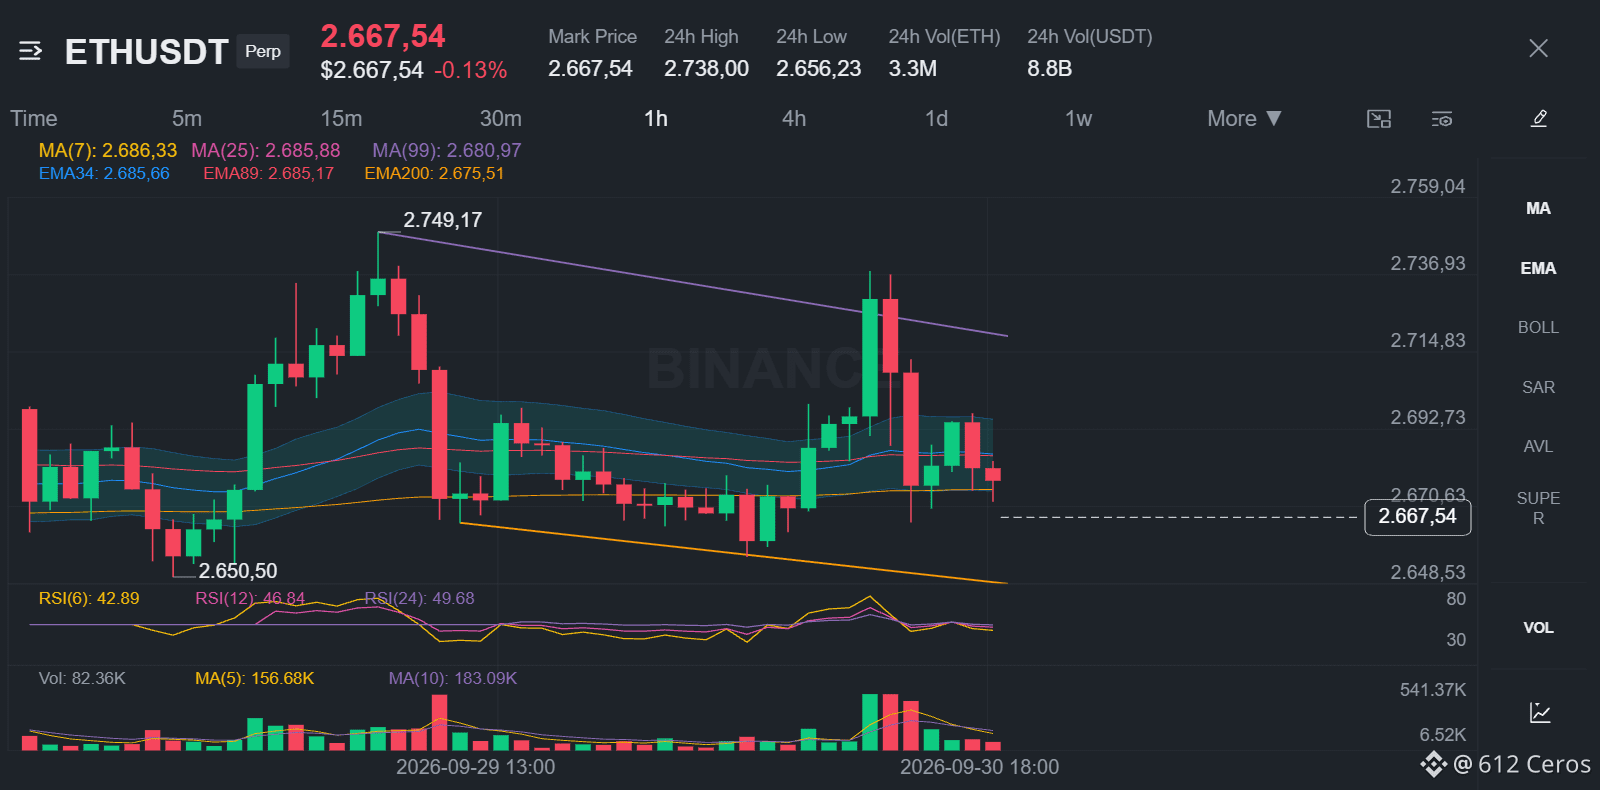
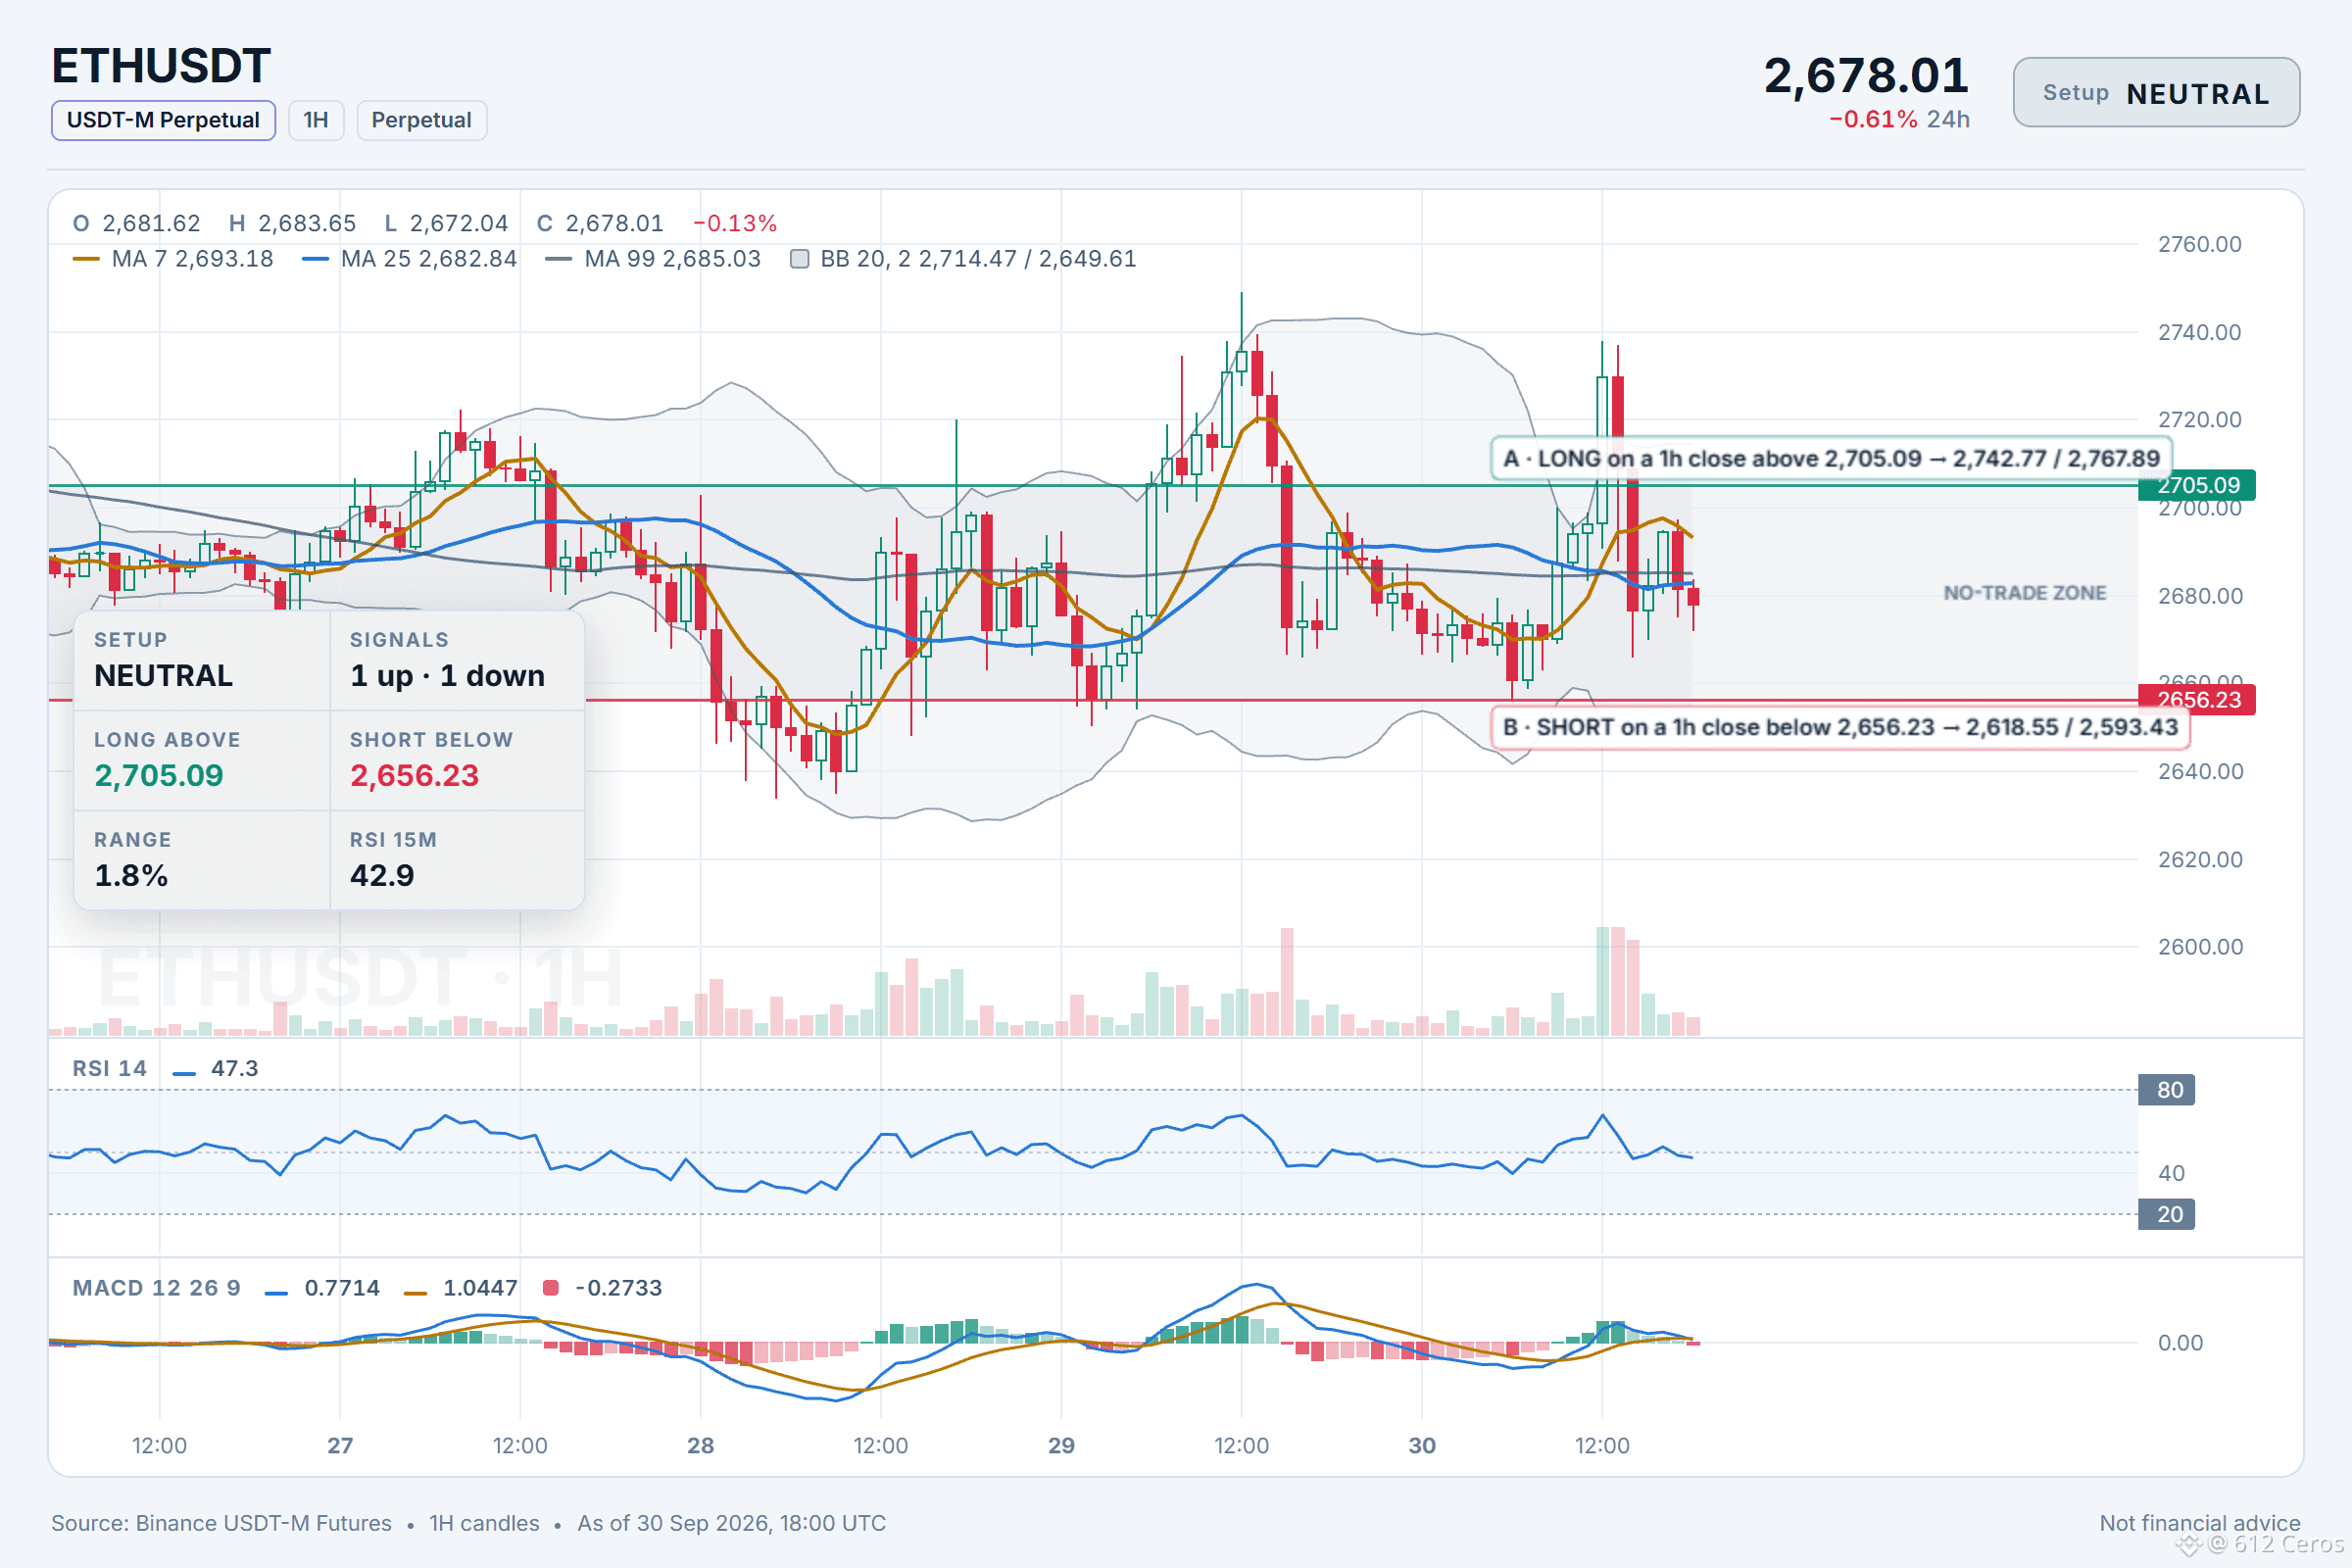
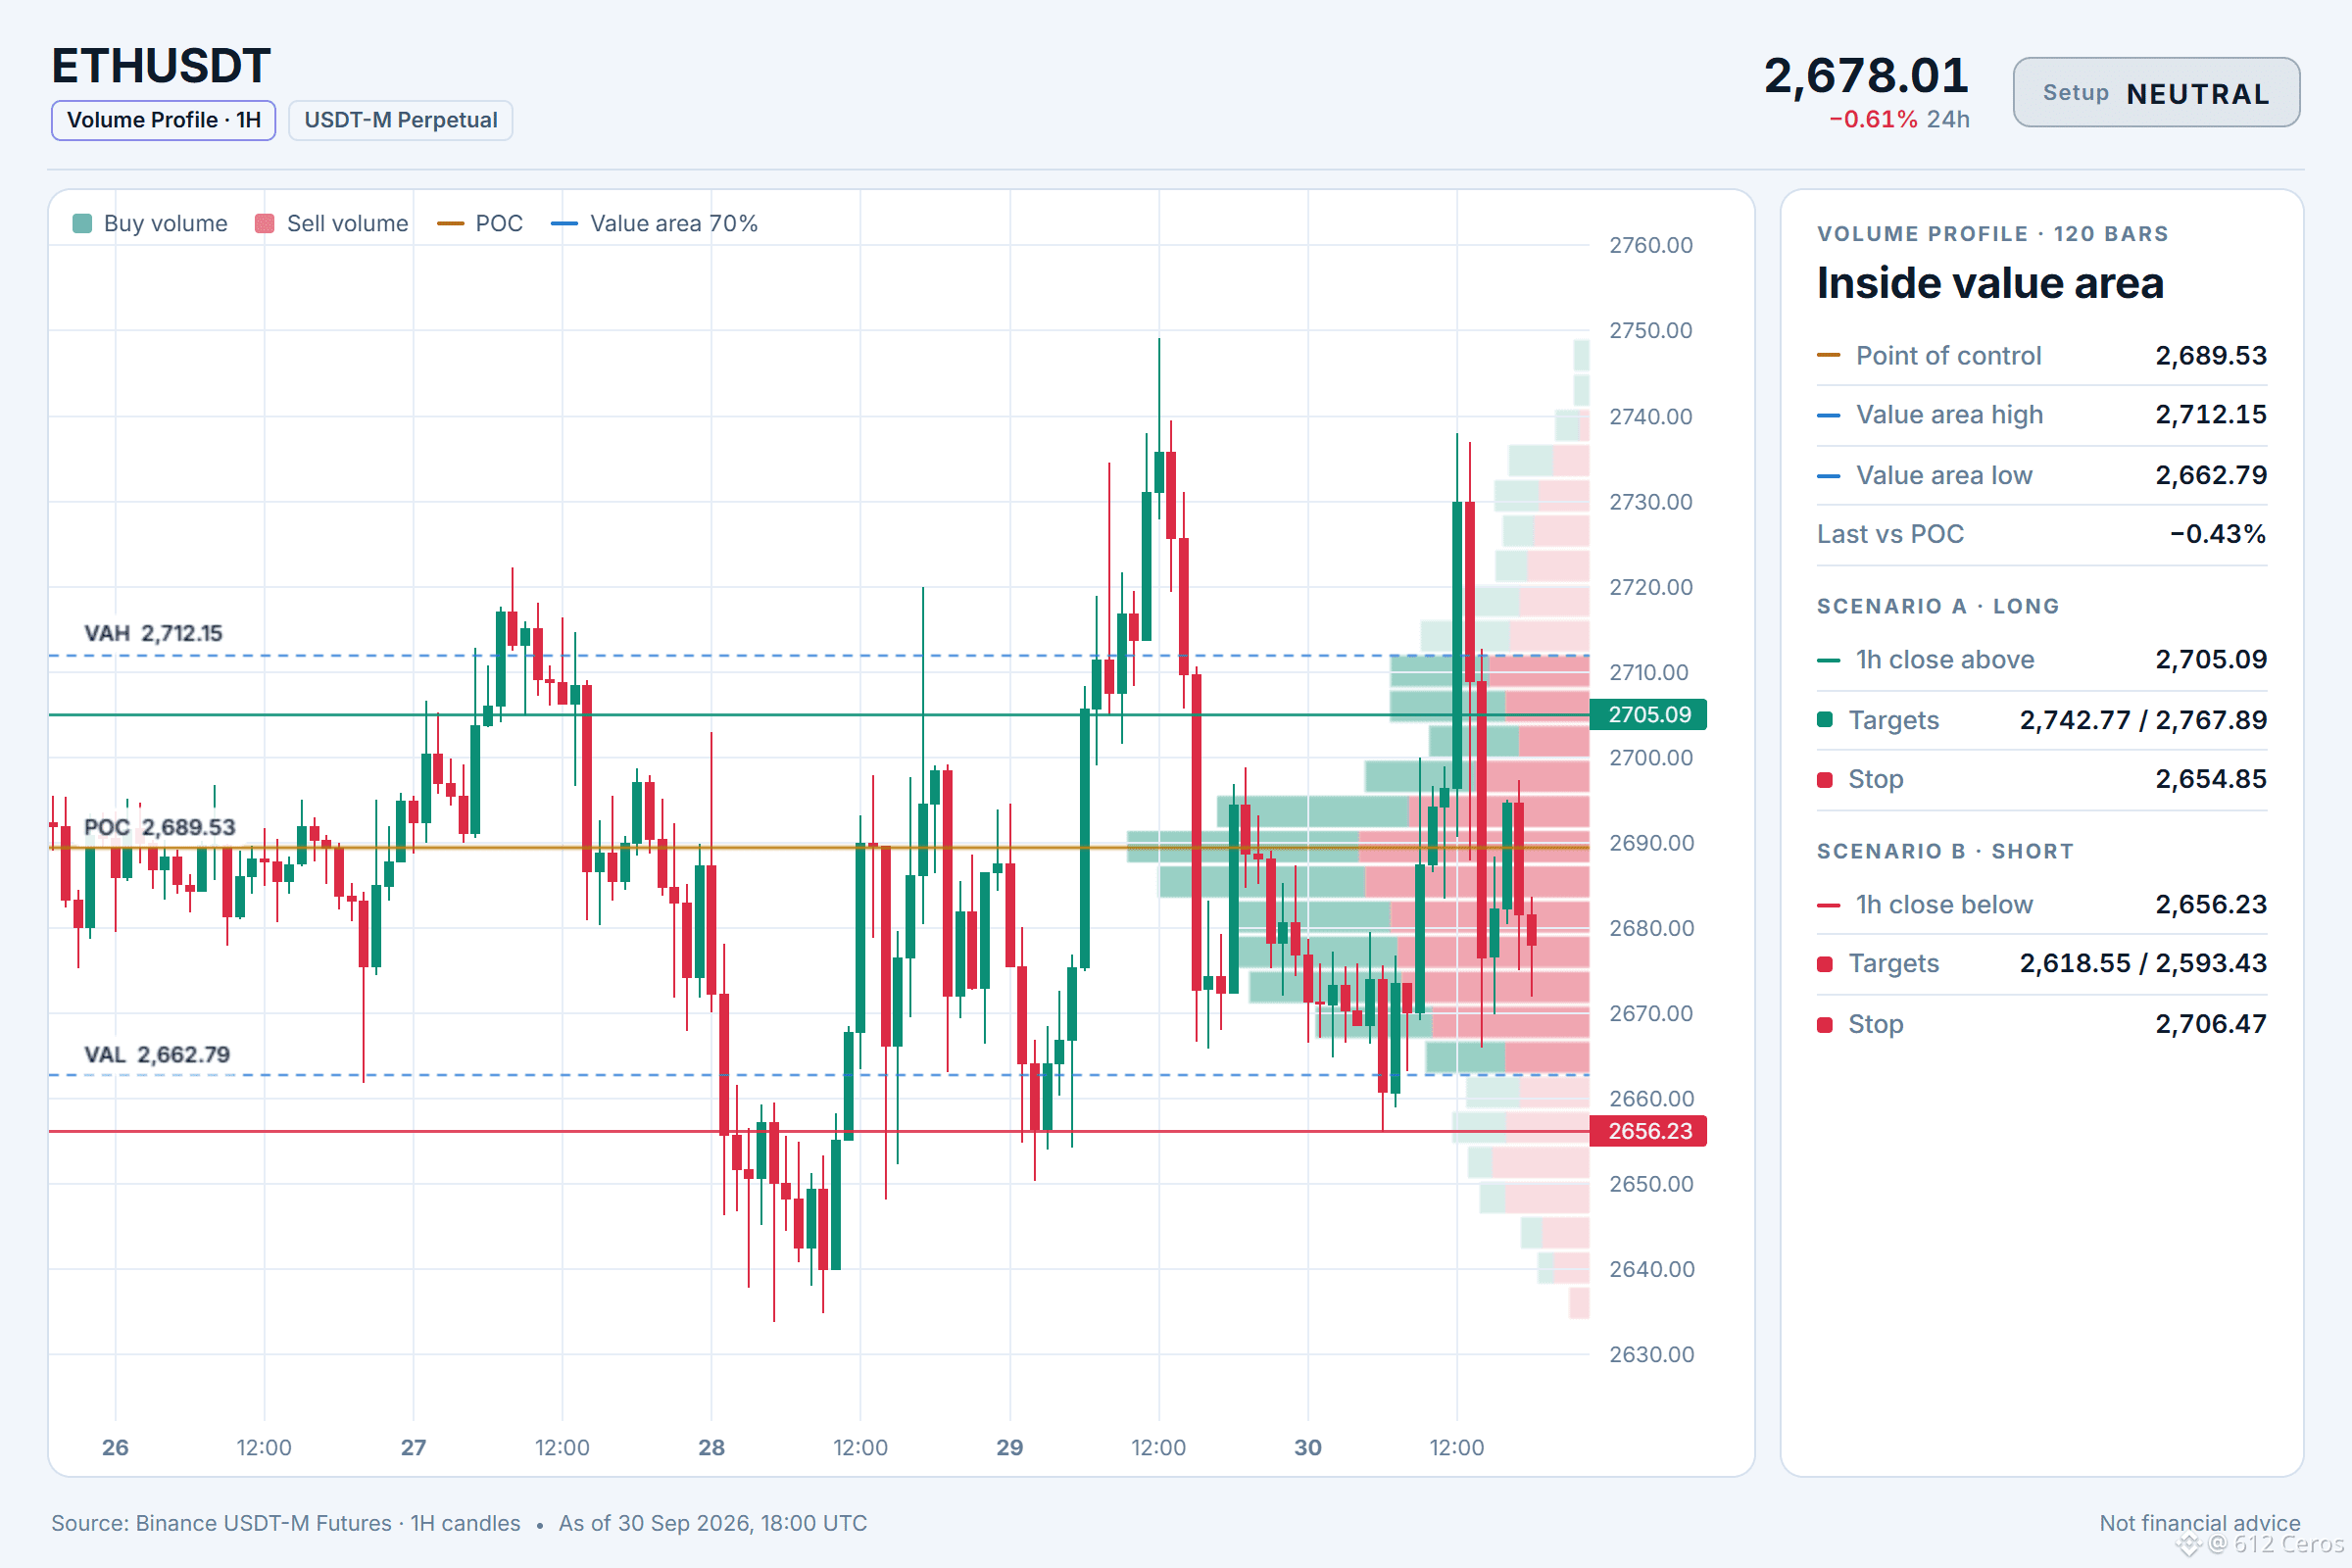
2
2
930
·
--
Baissier
Is VELVET ready to drop after the daily bearish stack?
🔴 SHORT $VELVET /USDT: expecting price to go DOWN
Bias: SHORT · Leaning · 4/12 signals agree, 0 against, 8 undecided
📍 Entry: 0.0560534 – 0.0563266 · limit order inside the zone, don't chase
🎯 TP1: 0.0536213 (-4.6%) · take about half, then move SL to entry
🎯 TP2: 0.0519088 (-7.6%) · take most of the rest
🎯 TP3: 0.0493401 (-12.2%) · final target
🛑 SL: 0.0596149 (+6.1%) · close everything, never move it further away
⚖️ Reward vs risk: 0.75R / 1.25R / 2R at TP1 / TP2 / TP3
TP1 alone pays less than the stop costs, which is why the stop moves to entry after it.
⏳ Timing: 15m momentum already agrees. Skip it if TP1 prints before you get filled.
⚠️ Leaning only: 8 of 12 signals are still undecided. Keep size light.
Why SHORT? Technical verdict: LEANING SHORT, 4/12 signals agree, 0 against, 8 undecided.
✅ Daily trend: price < EMA50 < EMA200, bearish stack → the big-picture trend is down
✅ 4h trend: price < EMA50 < EMA200, bearish stack → the swing trend is down
✅ 1h trend: price < EMA50 < EMA200, bearish stack → the short-term trend is down
VELVET in 3 points 🧵
1️⃣ Daily trend shows price below both EMA50 and EMA200, bearish stack, so the big-picture trend is down.
2️⃣ 4h trend shows price below both EMA50 and EMA200, bearish stack, so the swing trend is down.
3️⃣ 1h trend shows price below both EMA50 and EMA200, bearish stack, so the short-term trend is down.
Your call:
Where do you take profit on a short like this, and does the 4h trend change your level?
See it on the chart 👇
{future}(VELVETUSDT)
📲 Want more of my latest signals? Join me here:
[https://app.binance.com/uni-qr/D26WbL9t](https://app.binance.com/uni-qr/D26WbL9t)
⚠️ Personal market analysis only. NFA — manage risk and DYOR.
Educational content, not investment advice or a recommendation to buy, sell, deposit, or withdraw any asset. No paid promotion or referral/affiliate links.
Is VELVET ready to drop after the daily bearish stack?
🔴 SHORT $VELVET /USDT: expecting price to go DOWN
Bias: SHORT · Leaning · 4/12 signals agree, 0 against, 8 undecided
📍 Entry: 0.0560534 – 0.0563266 · limit order inside the zone, don't chase
🎯 TP1: 0.0536213 (-4.6%) · take about half, then move SL to entry
🎯 TP2: 0.0519088 (-7.6%) · take most of the rest
🎯 TP3: 0.0493401 (-12.2%) · final target
🛑 SL: 0.0596149 (+6.1%) · close everything, never move it further away
⚖️ Reward vs risk: 0.75R / 1.25R / 2R at TP1 / TP2 / TP3
TP1 alone pays less than the stop costs, which is why the stop moves to entry after it.
⏳ Timing: 15m momentum already agrees. Skip it if TP1 prints before you get filled.
⚠️ Leaning only: 8 of 12 signals are still undecided. Keep size light.
Why SHORT? Technical verdict: LEANING SHORT, 4/12 signals agree, 0 against, 8 undecided.
✅ Daily trend: price < EMA50 < EMA200, bearish stack → the big-picture trend is down
✅ 4h trend: price < EMA50 < EMA200, bearish stack → the swing trend is down
✅ 1h trend: price < EMA50 < EMA200, bearish stack → the short-term trend is down
VELVET in 3 points 🧵
1️⃣ Daily trend shows price below both EMA50 and EMA200, bearish stack, so the big-picture trend is down.
2️⃣ 4h trend shows price below both EMA50 and EMA200, bearish stack, so the swing trend is down.
3️⃣ 1h trend shows price below both EMA50 and EMA200, bearish stack, so the short-term trend is down.
Your call:
Where do you take profit on a short like this, and does the 4h trend change your level?
See it on the chart 👇
📲 Want more of my latest signals? Join me here:
https://app.binance.com/uni-qr/D26WbL9t
⚠️ Personal market analysis only. NFA — manage risk and DYOR.
Educational content, not investment advice or a recommendation to buy, sell, deposit, or withdraw any asset. No paid promotion or referral/affiliate links.
🔴 SHORT $VELVET /USDT: expecting price to go DOWN
Bias: SHORT · Leaning · 4/12 signals agree, 0 against, 8 undecided
📍 Entry: 0.0560534 – 0.0563266 · limit order inside the zone, don't chase
🎯 TP1: 0.0536213 (-4.6%) · take about half, then move SL to entry
🎯 TP2: 0.0519088 (-7.6%) · take most of the rest
🎯 TP3: 0.0493401 (-12.2%) · final target
🛑 SL: 0.0596149 (+6.1%) · close everything, never move it further away
⚖️ Reward vs risk: 0.75R / 1.25R / 2R at TP1 / TP2 / TP3
TP1 alone pays less than the stop costs, which is why the stop moves to entry after it.
⏳ Timing: 15m momentum already agrees. Skip it if TP1 prints before you get filled.
⚠️ Leaning only: 8 of 12 signals are still undecided. Keep size light.
Why SHORT? Technical verdict: LEANING SHORT, 4/12 signals agree, 0 against, 8 undecided.
✅ Daily trend: price < EMA50 < EMA200, bearish stack → the big-picture trend is down
✅ 4h trend: price < EMA50 < EMA200, bearish stack → the swing trend is down
✅ 1h trend: price < EMA50 < EMA200, bearish stack → the short-term trend is down
VELVET in 3 points 🧵
1️⃣ Daily trend shows price below both EMA50 and EMA200, bearish stack, so the big-picture trend is down.
2️⃣ 4h trend shows price below both EMA50 and EMA200, bearish stack, so the swing trend is down.
3️⃣ 1h trend shows price below both EMA50 and EMA200, bearish stack, so the short-term trend is down.
Your call:
Where do you take profit on a short like this, and does the 4h trend change your level?
See it on the chart 👇
📲 Want more of my latest signals? Join me here:
https://app.binance.com/uni-qr/D26WbL9t
⚠️ Personal market analysis only. NFA — manage risk and DYOR.
Educational content, not investment advice or a recommendation to buy, sell, deposit, or withdraw any asset. No paid promotion or referral/affiliate links.
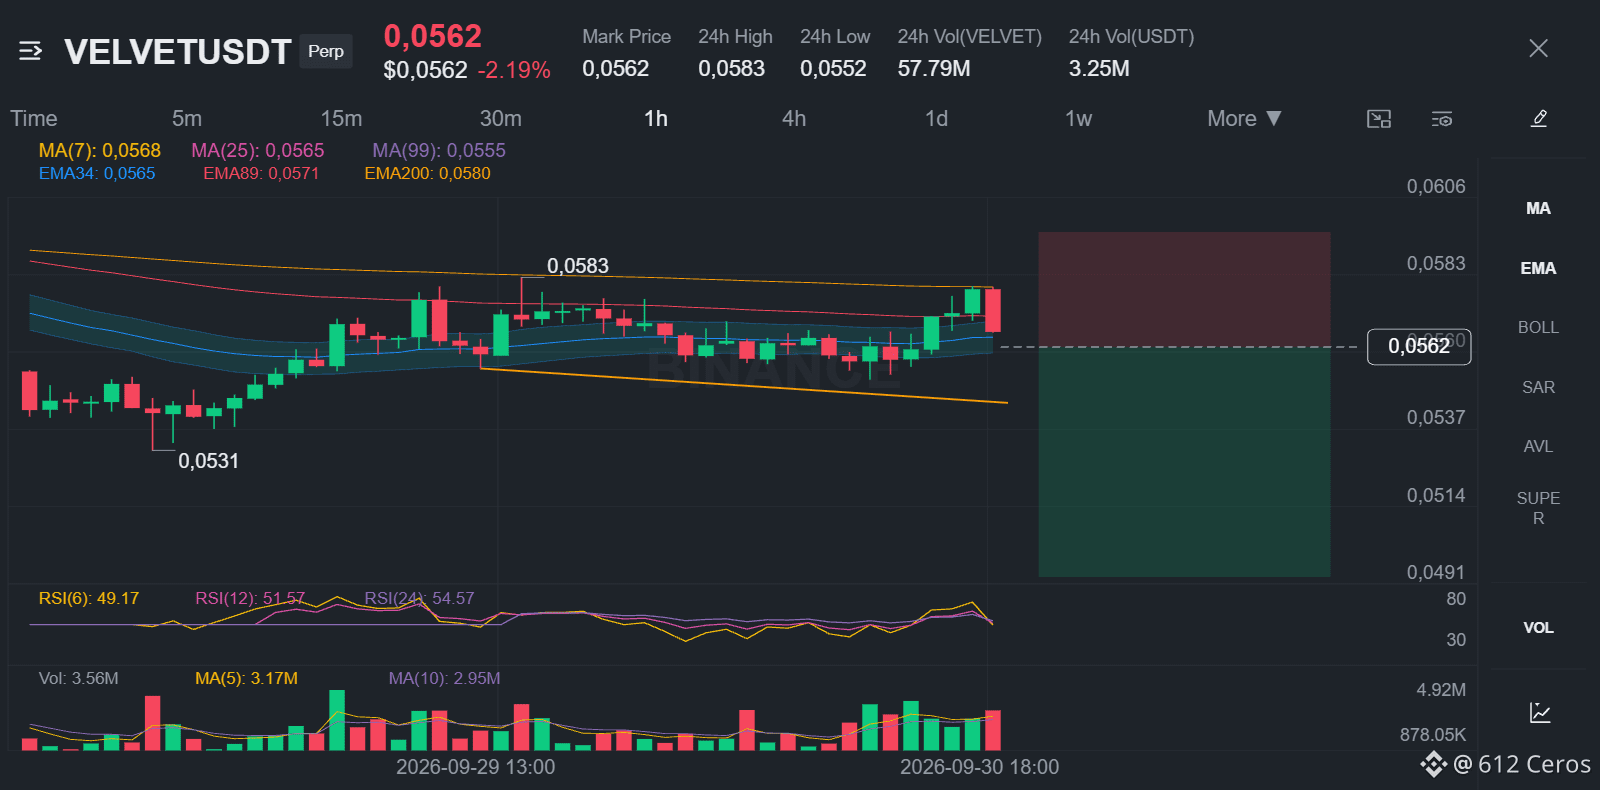
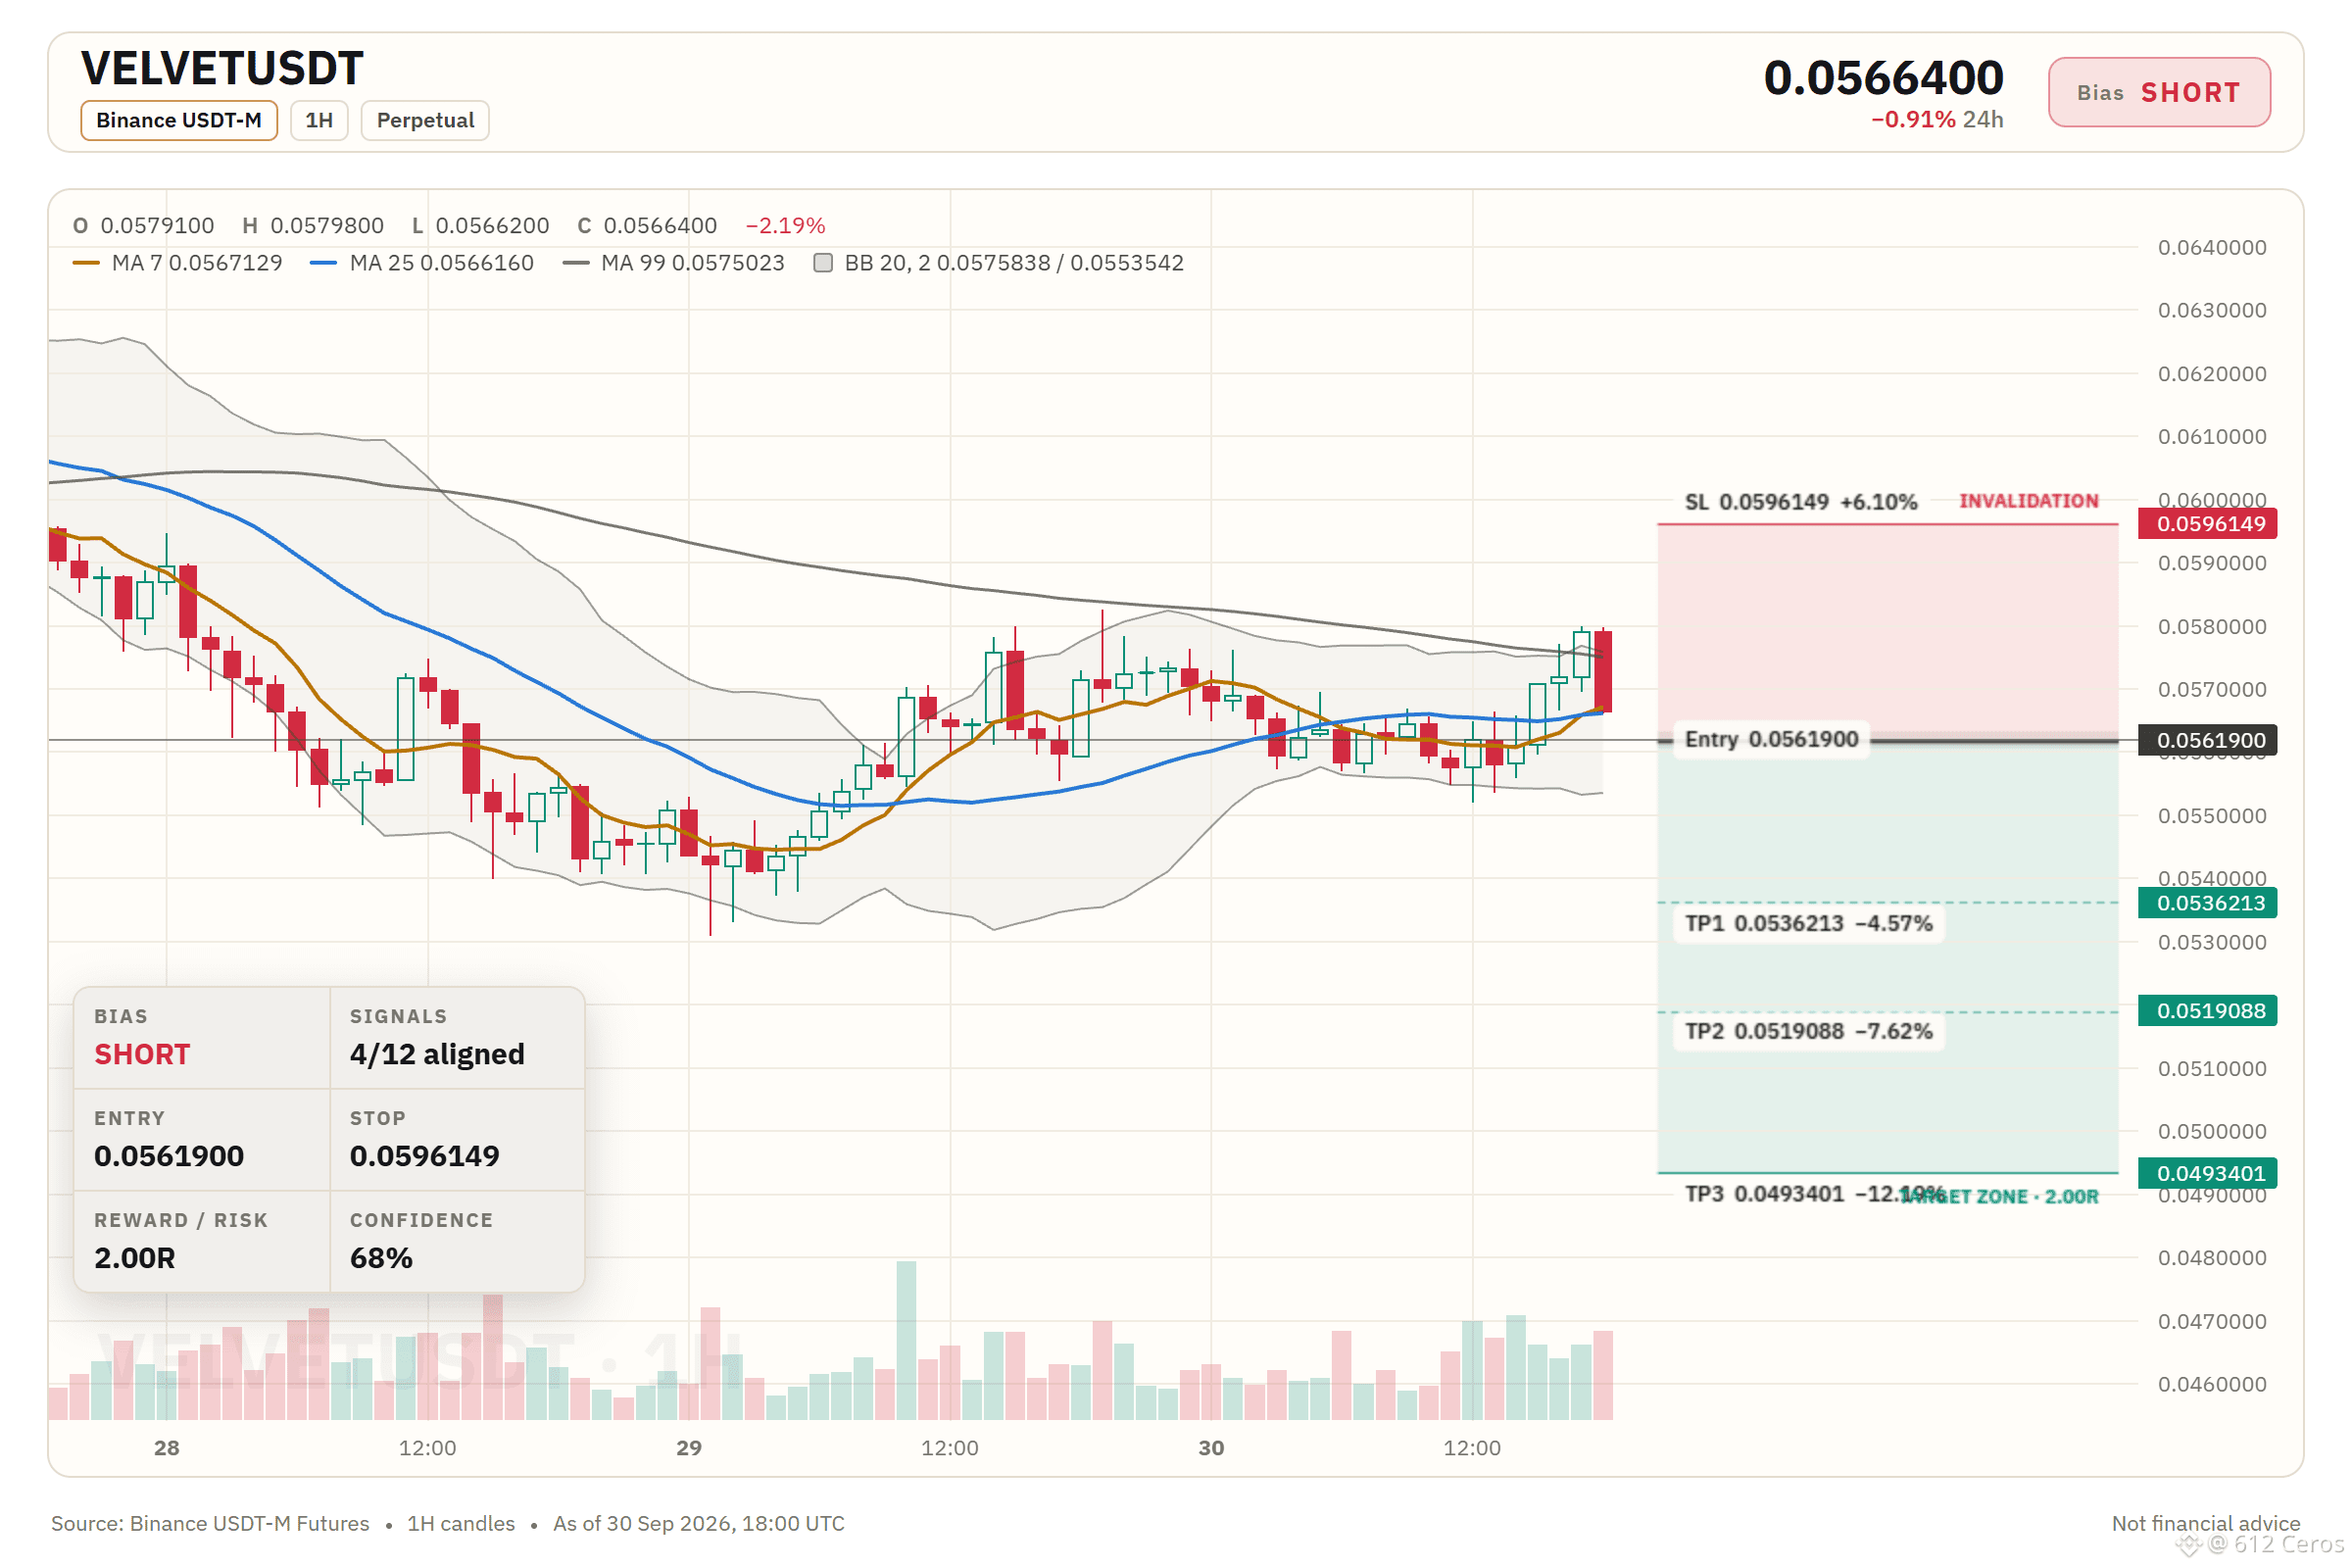
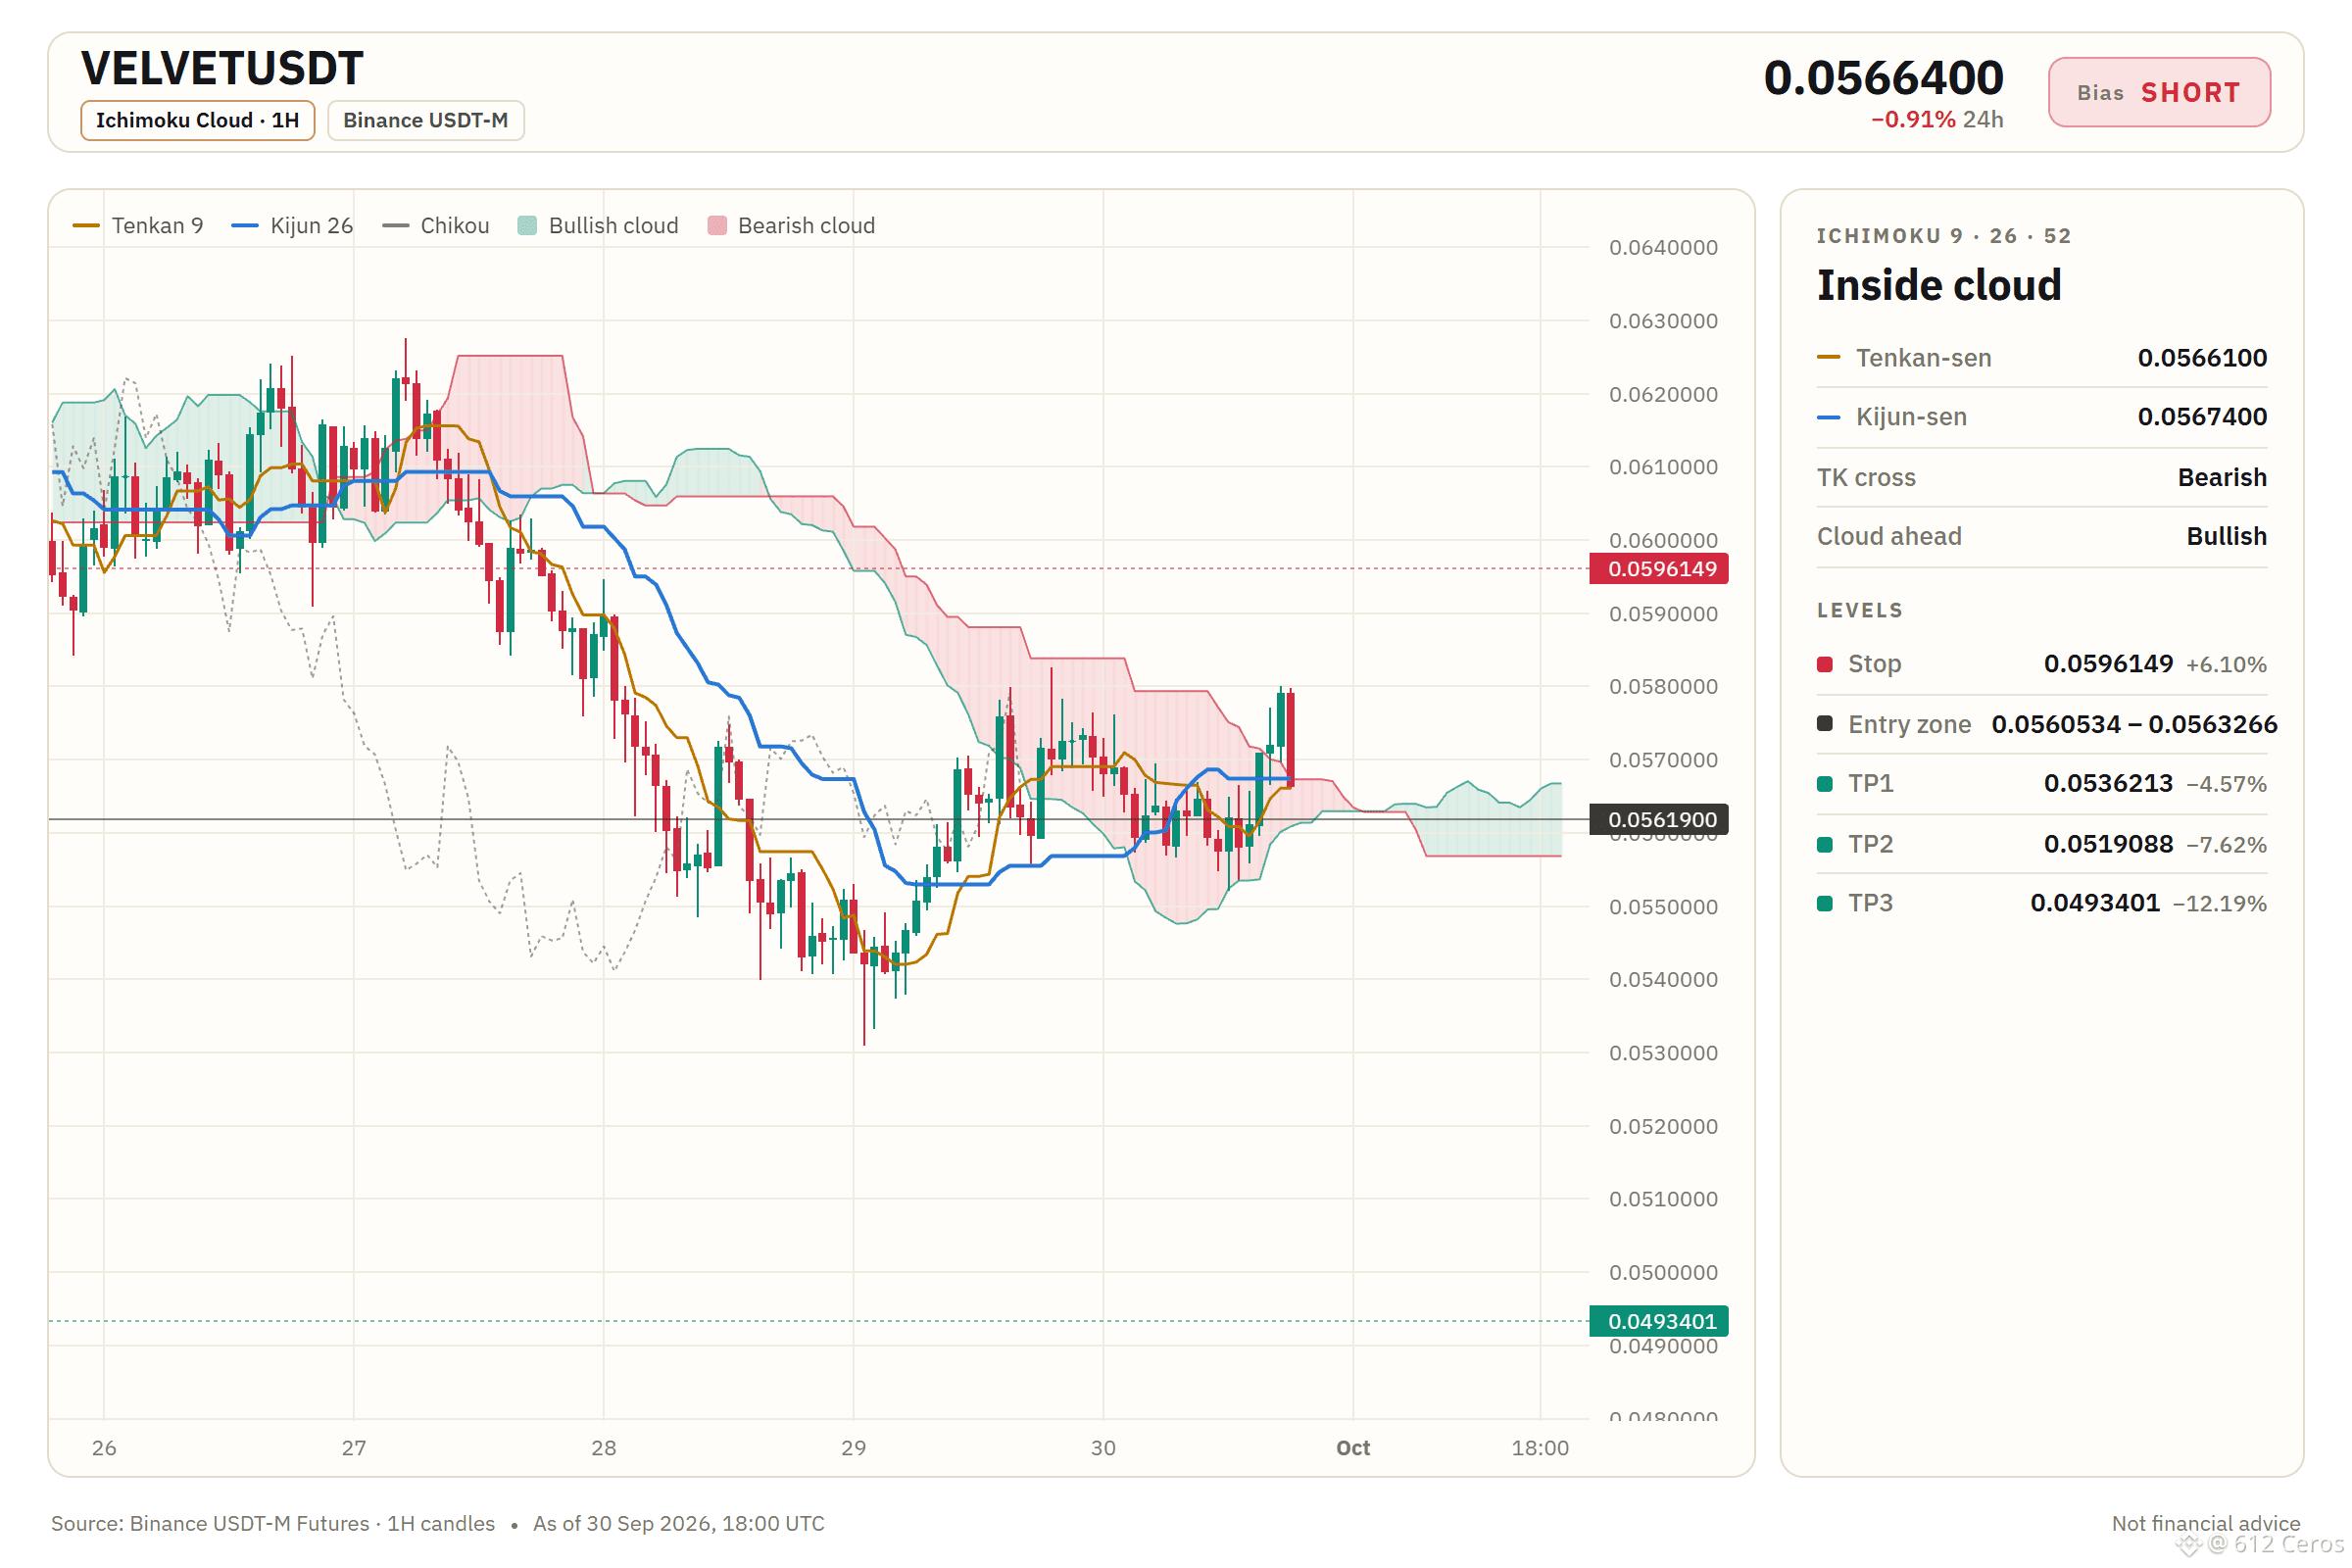
4
3
954
Connectez-vous pour découvrir plus de contenu
Rejoignez la communauté mondiale des adeptes de cryptomonnaies sur Binance Square
⚡️ Suviez les dernières informations importantes sur les cryptomonnaies.
💬 Jugé digne de confiance par la plus grande plateforme d’échange de cryptomonnaies au monde.
👍 Découvrez les connaissances que partagent les créateurs vérifiés.
Adresse e-mail/Nº de téléphone
Sujets d’actualité
MetaMaskExitsLidoValidatorsAfterSecurityIncident
3,172 vues
162 mentions
🚨 METAMASK JUST STARTED EXITING ETH VALIDATORS AFTER A SECURITY INCIDENT.
MetaMask says an ongoing security incident hit part of its infrastructure, forcing it to proactively exit affected validators from its non-custodial staking operations. The company says it has found no immediate threat to MetaMask wallets so far.
The key detail?
These validators are tied to Lido staking, and the exit process may temporarily remove ETH from staking while the investigation continues. Lido-related reports say the full exit, withdrawal and re-entry cycle could take up to roughly 45 days.
That means the market should separate two things:
Wallet users are not currently being told they’re at immediate risk.
But validator infrastructure clearly was serious enough to trigger an emergency exit.
And when one of Ethereum’s biggest wallet brands starts pulling validators as a precaution, traders pay attention.
Security incidents don’t need stolen funds to become market-moving.
Sometimes the reaction itself is the signal. 👀
$ETH $LDO
#metamaskexitslidovalidatorsaftersecurityincident
KimHotbae
·0 mentions J’aime
·1.3k vues
MicronBeatsEarningsLiftsGuidance
6,453 vues
179 mentions
CFTCSubmitsTwoEventContractRulesToWhiteHouse
6,968 vues
185 mentions