Bitcoin extended November’s decline early today, flushing under $88,000 and tagging new lows around $85,949.
The drop is NOT random — it’s a collision of macro liquidity pressure, DeFi contagion, and technical breakdowns.
But today marks something bigger:
The Federal Reserve officially ends Quantitative Tightening (QT).
This is a turning point in the liquidity cycle.
Below is your full macro + chart breakdown.
---
📉 1. What Triggered BTC’s Drop?
• Yearn Finance Exploit → Contagion Risk
YFI’s collapse sent shockwaves through DeFi, sparking forced deleveraging across the market.
• Ethereum Down 27% in November
ETH weakness dragged the entire liquidity profile lower.
When ETH collapses → altcoins suffer → hedge flows move to BTC → volatility spikes.
• Panic Volume Spike ($26B+)
Elevated volume shows liquidation pressure, not accumulation.
• Whale Liquidity Sits BELOW $88K
Large buyers positioned at $86K–$84K, not above $90K.
Market followed the liquidity.
---
💡 2. Macro Catalyst: QT Ends Today (Dec 1)
Ending QT means liquidity drainage stops.
Historically, this creates medium-term upside:
2019 QT Pause → BTC 350% rally
2020–2021 Liquidity Wave → Crypto Supercycle
2022 QT Restart → Crypto Bear Market
The shift doesn’t pump instantly — but it realigns the cycle.
This is why #BTCRebound90kNext? is trending on Square (20K+ watching).
---
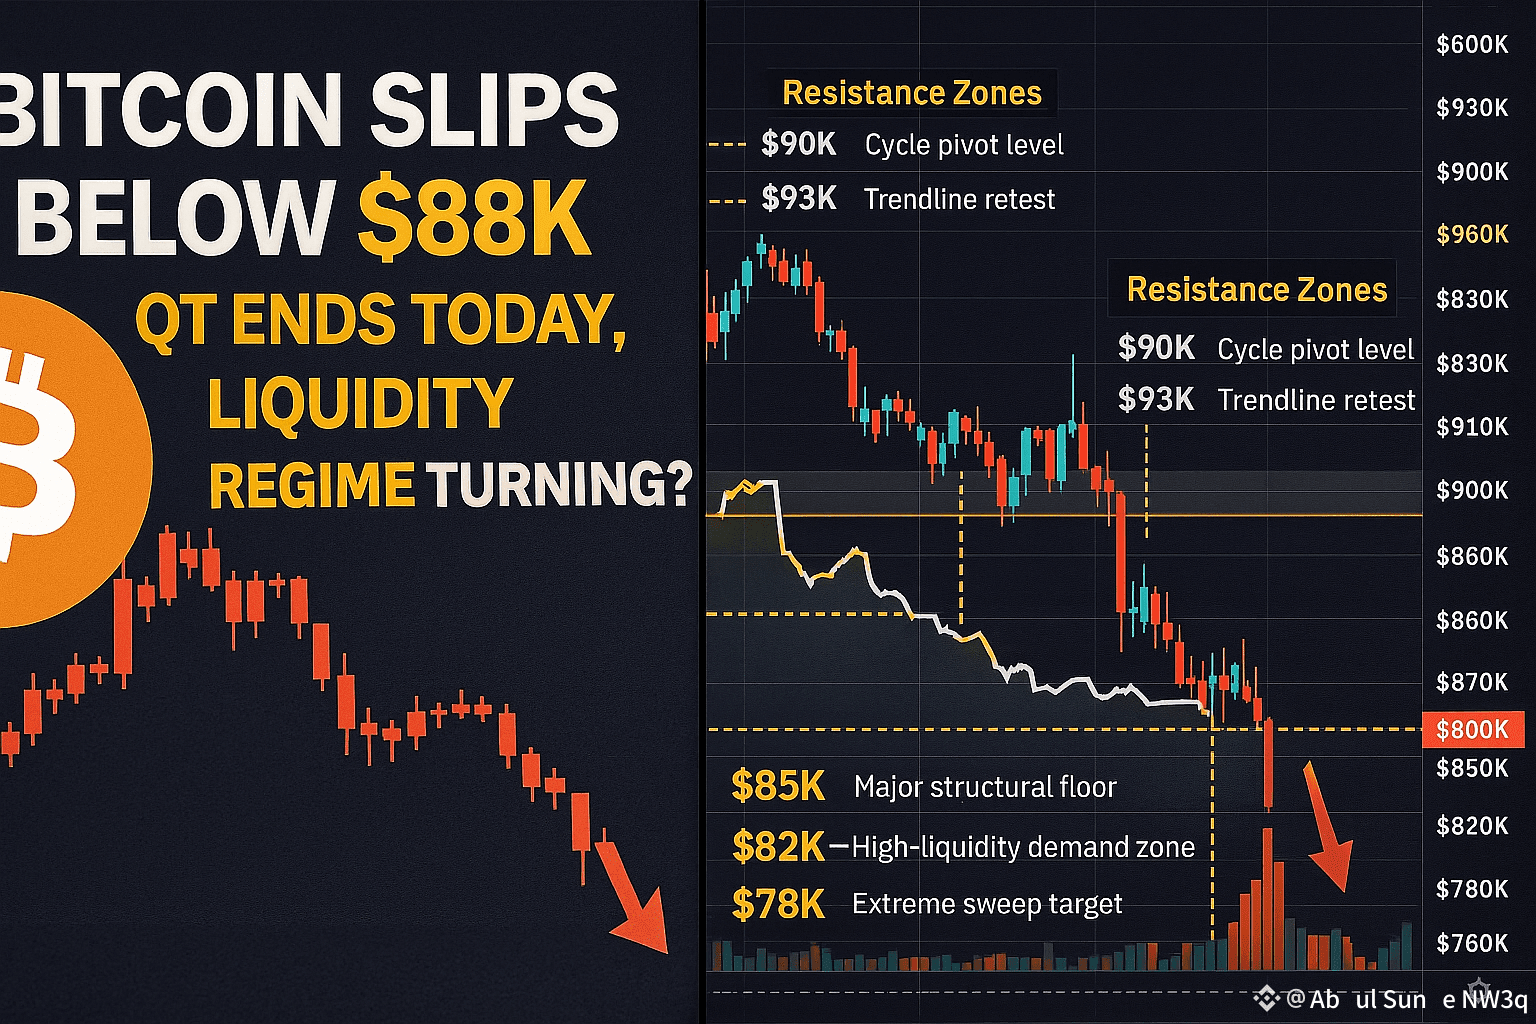
📊 3. Chart-Based Technical Breakdown
BTC Daily Structure
Price: $86K–$87K
24h Low: $85,949
Trend: Short-term bearish
Volume: Elevated → volatility expansion
Support Zones
Price Importance
$85K Major structural floor
$82K–$83K High-liquidity demand zone
$78K Extreme sweep target (only if macro shock hits)
Resistance Zones
Price Importance
$90K Cycle pivot level
$93K Trendline retest
$96K Pre-breakdown cluster
---
📈 4. Indicators (Quick Read)
RSI
Near 34
Previous reversals at 28–32 → not yet oversold
MACD
Bearish, but contraction showing early bottoming
behaviour
Volume Profile (VPVR)
Thin zone $86K–$84K explains fast drop
Thick node at $90K–$92K = bounce target if recovery begins
BTC Dominance
Falling post-crash = early alt speculation (usually a fake-out)
---
🔍 5. What Historically Happens After QT Ends
Crypto typically follows this pattern:
1. Volatility spike
2. Bottoming structure forms
3. BTC stabilizes
4. ETH recovers
5. Large-cap alts lead rotation
6. Broader alt rally over following weeks
We are between Phase 1 and 2 right now.
---
🎯 6. Actionable Strategy (Realistic + Safe)
• If Holding BTC → Micro-DCA Only
Stick to your controlled approach. No emotional adds.
• If Trading → Bitcoin Must Reclaim $90K
A daily close above $90K flips structure bullish.
• If Watching Alts
Wait for:
BTC stability
ETH strength
QT liquidity drift
SOL, ETH, BNB, AVAX are the early rotation candidates.
• Zero Leverage Until $90K Break
Current volatility kills leveraged traders.
---
⚠️ 7. Critical Weaknesses to Stay Aware Of
I expose every blind spot:
QT end takes 2–8 weeks to meaningfully lift markets
ETH’s 27% crash is cycle-negative
Altcoin rotation after a crash is usually a trap
YFI fallout may not be finished
$85K is fragile — one macro headline can break it
Whales still have bids at $84K–$82K → possible deeper sweep
Stay objective.
---
🧭 Bottom Line
BTC is in a high-volatility zone, but today marks a major macro shift.
If $85K holds and liquidity begins drifting in post-QT, a recovery toward $90K+ becomes probability-aligned.
The next 2–6 weeks will reveal whether this is a cycle bottom or one more liquidity sweep.
Stay disciplined. Save cash. Let the market show its hand.


