🚨 Bitcoin at a Critical Junction: Reversal Incoming or Deeper Correction? 🚨
Bitcoin $BTC is trading around $96,200, showing strong bearish pressure on the 4H timeframe, but indicators are hinting at a possible momentum shift. Here’s a high-impact breakdown for traders and investors
👇
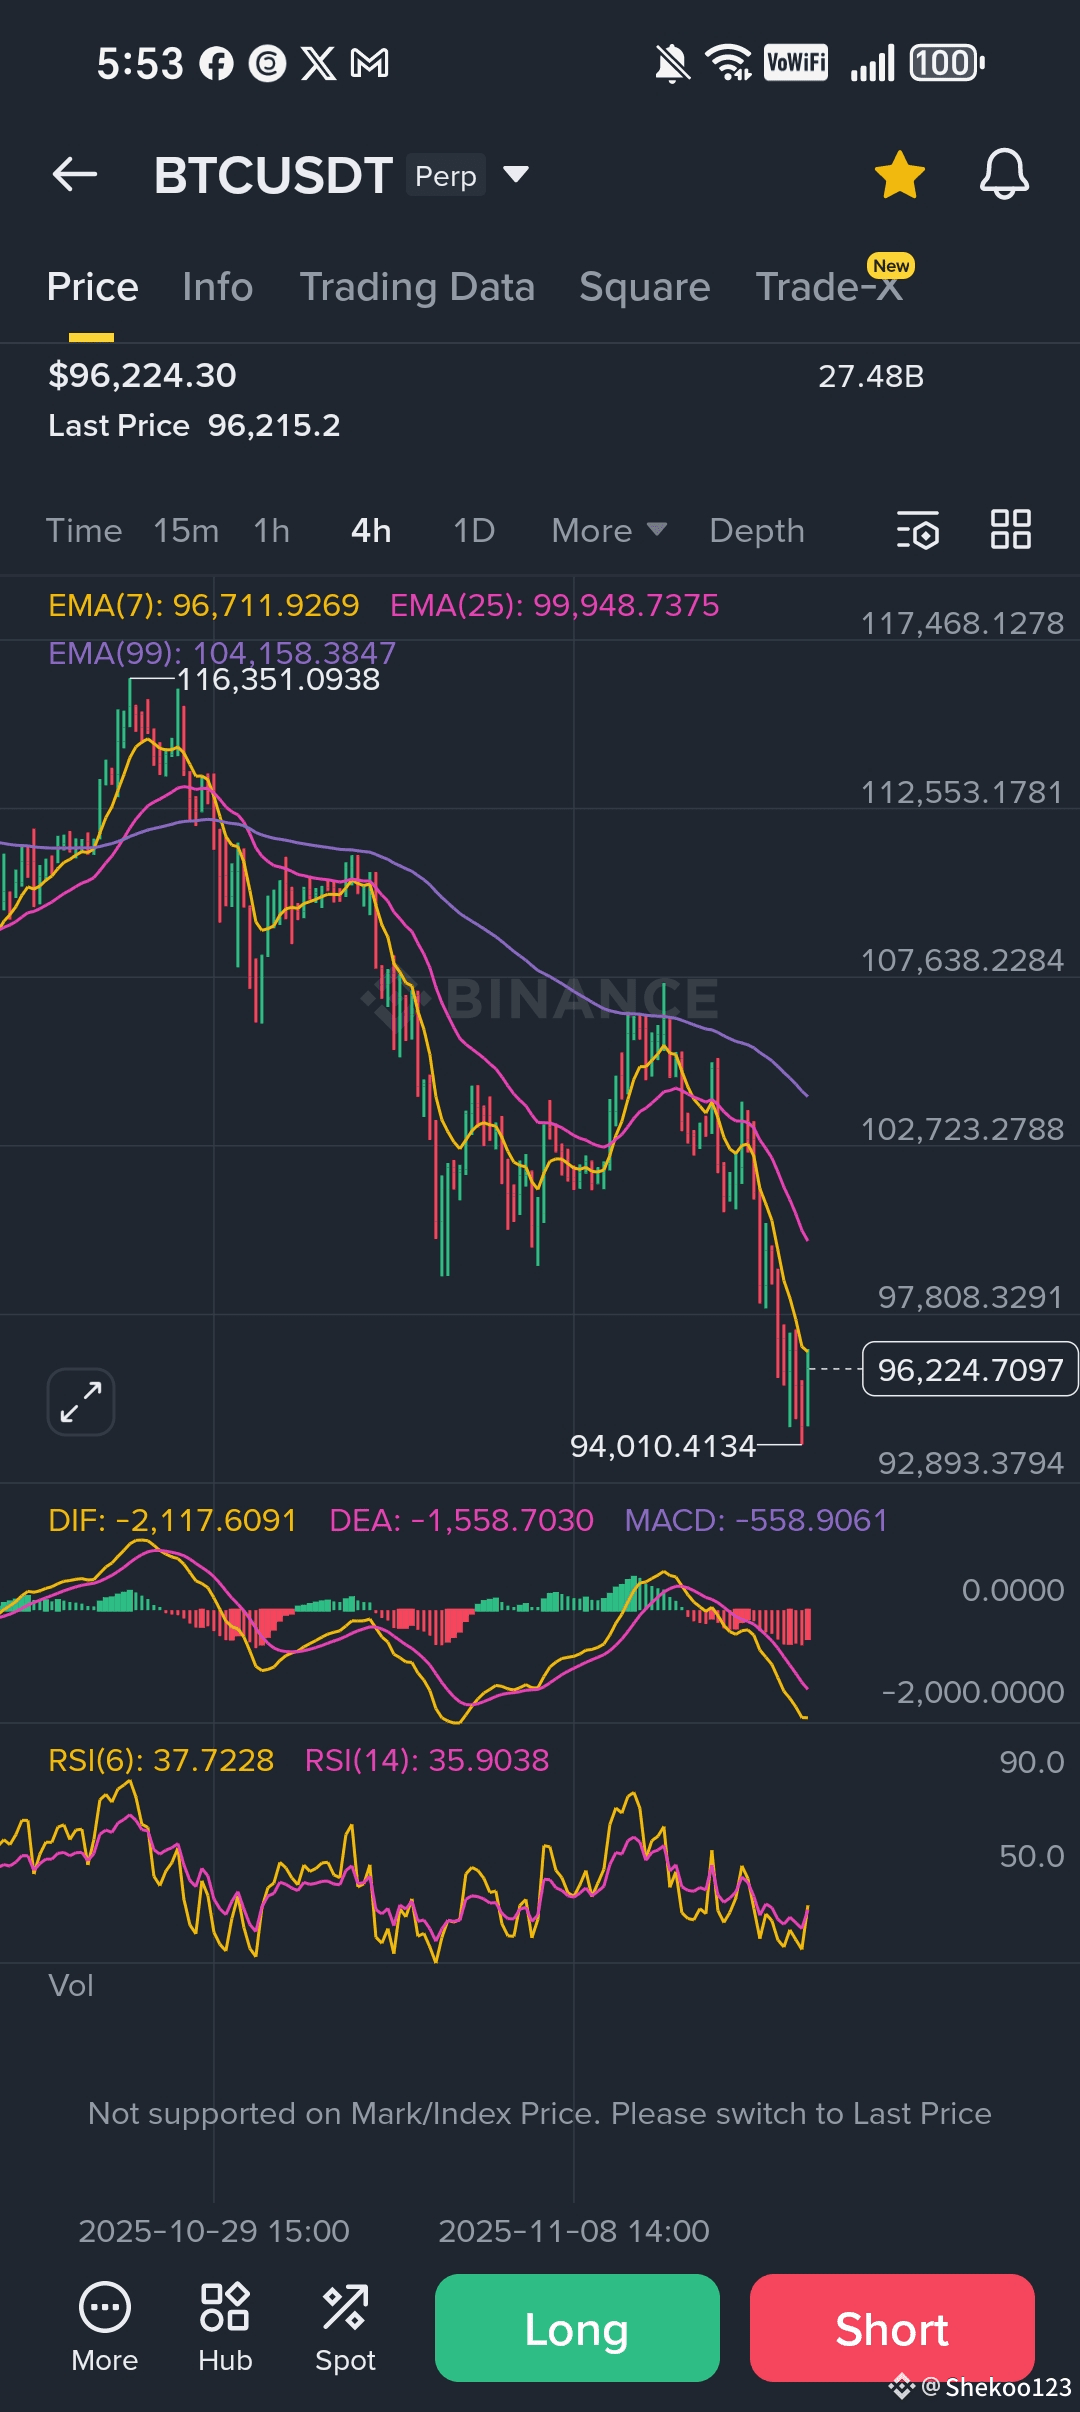
📉 Trend Overview (4H Timeframe)
📊 EMA Signals Still Bearish
Price sits below EMA(7), EMA(25), and EMA(99)
All EMAs are pointing downward, confirming the ongoing correction
EMA(25) is acting as strong resistance 🔥
➡️ The trend is still bearish, but momentum is slowing.
⚡ Momentum Indicators Show Weakening Selling Pressure
📉 MACD Cooling Down
MACD histogram is still negative, but bars are shrinking
DIF & DEA lines are flattening
Selling pressure is losing strength 😮💨
This usually happens before a short-term bounce.
📈 RSI Near Oversold Zone
RSI(14): 35
RSI(6): 37
RSI levels are near the reversal zone 🔄
➡️ Bears are getting tired
➡️ Bulls preparing to step in
🧭 Key Levels to Watch
🟩 Strong Support
$94,000
$92,800
If bulls defend this zone, $BTC could form a bullish rebound setup 🚀
🟥 Major Resistance
$97,800
$102,700
$107,600
A break above $102,700 = early confirmation of a trend reversal 🔥
🧠 Market Sentiment
Fear is spreading across the market 😨
But historically, these levels often create profitable accumulation zones for long-term traders 🟢
🔮 What’s Next for Bitcoin?
📌 Short-Term
$BTC may retest $94k–$92k before a potential bounce.
📌 Mid-Term
A breakout above $102k could push BTC toward $107k–$112k.
📌 Long-Term
The macro trend remains bullish. This correction looks similar to previous consolidation phases before major expansions 🌙
🔥 Final Thoughts
Bitcoin is approaching a high-probability reaction zone.
If buyers show strength near support, we may see the beginning of a strong upside reversal 📈🔥
#Bitcoin #BTCUSDT #dailytradesetupshekoo123 #TradingSignals #BTC走势分析