━━━━━━━━━━━━━━━━━━━━━━━━━━━━━━━━━━━━━━━━━━━━━━━━━
◆ Market Spotlight: NVDA isn’t just a stock — it’s the heartbeat of the AI revolution. And right now, price action is telling a powerful story that traders can’t afford to ignore.
━━━━━━━━━━━━━━━━━━━━━━━━━━━━━━━━━━━━━━━━━━━━━━━━━
The market is shifting — and NVDA is leading from the front.
After weeks of consolidation and a sharp corrective phase, bulls have stepped back in with authority.
➤ From fear ➝ to accumulation ➝ to expansion
➤ From weak structure ➝ to explosive breakout
Now the big question is:
Is this the start of a sustained rally… or a short-term overextension before correction?
Let’s break it down like a pro trader.
━━━━━━━━━━━━━━━━━━━━━━━━━━━━━━━━━━━━━━━━━━━━━━━━━
◆ Technical Analysis Breakdown (1D Chart)
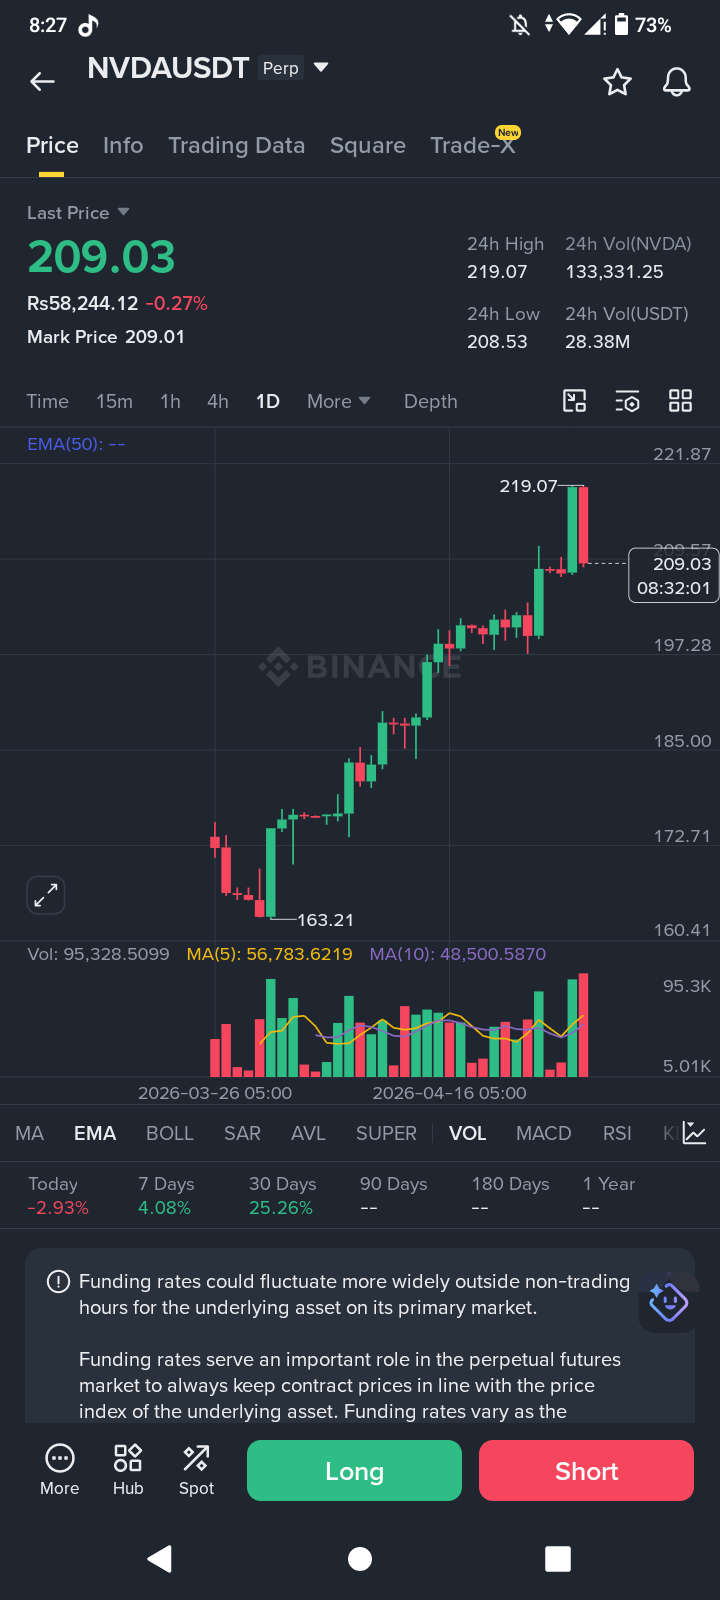
① Trend Structure — Clear Bullish Reversal
➤ Price formed a strong base around $164.27
➤ Higher lows + higher highs confirm trend reversal
➤ Sharp impulsive move indicates institutional buying pressure
◆ This is no weak bounce — this is momentum-driven expansion
② Moving Average (MA50) — Dynamic Support ➜
➤ MA(50): ~$186.16
➤ Price has reclaimed and moved far above it
✔︎ Interpretation:
MA flipped from resistance ➝ support
Indicates mid-term bullish control
◆ As long as price holds above MA50, bulls remain dominant
━━━━━━━━━━━━━━━━━━━━━━━━━━━━━━━━━━━━━━━━━━━━━━━━━
③ Breakout Zone — Momentum Ignition
➤ Key resistance near $193–195 has been broken cleanly
➤ Strong bullish candles with minimal wicks
✔︎ This confirms:
Breakout strength
High conviction buying
◆ Classic breakout + continuation setup
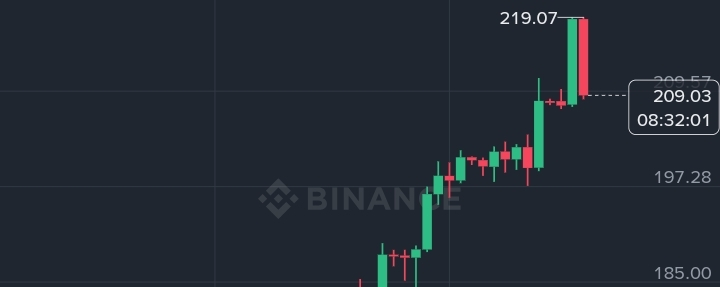
④ Current Price Action — Extension Phase
➤ Current price: ~$209.96
➤ Recent high: $218.25
✔︎ Price is now in a short-term overextended zone
➤ Possibilities:
➜ Minor pullback (healthy correction)
➜ Sideways consolidation before next leg up
━━━━━━━━━━━━━━━━━━━━━━━━━━━━━━━━━━━━━━━━━━━━━━━━━
⑤ Key Levels to Watch
➤ Immediate Resistance:
◆ $218 – $224 zone
➤ Support Zones:
◆ $200 psychological level
◆ $193 breakout retest
◆ $186 MA50 dynamic support
✔︎ Losing $193 weakens bullish momentum
✔︎ Holding above $200 keeps structure strong
◆ Trading Insight — What Smart Money Sees
➤ This move is likely driven by:
✔︎ AI sector hype
✔︎ Strong institutional flows
✔︎ Momentum traders entering post-breakout
◆ But remember:
Fast moves often come with sharp pullbacks
━━━━━━━━━━━━━━━━━━━━━━━━━━━━━━━━━━━━━━━━━━━━━━━━━
◆ What’s Next?
NVDA is currently in a high-momentum bullish phase, but also entering a zone where risk increases for late entries.
➤ Smart traders will:
✔︎ Wait for pullbacks
✔︎ Watch key support levels
✔︎ Avoid chasing parabolic candles
◆ The trend is bullish — but discipline separates winners from emotional traders.
Is NVDA preparing for another leg toward $230+, or are we about to see a cool-off correction?
➤ Drop your analysis below
➤ Share this with fellow traders
➤ Follow for more high-level market breakdowns
━━━━━━━━━━━━━━━━━━━━━━━━━━━━━━━━━━━━━━━━━━━━━━━━━
Trade smart. Stay disciplined. Let the charts speak.
━━━━━━━━━━━━━━━━━━━━━━━━━━━━━━━━━━━━━━━━━━━━━━━━━