Market Vibe Check: USDT Dominance Signals a Potential Shift! 🚀
Is the money Flowing Back into BTC and Altcoins?
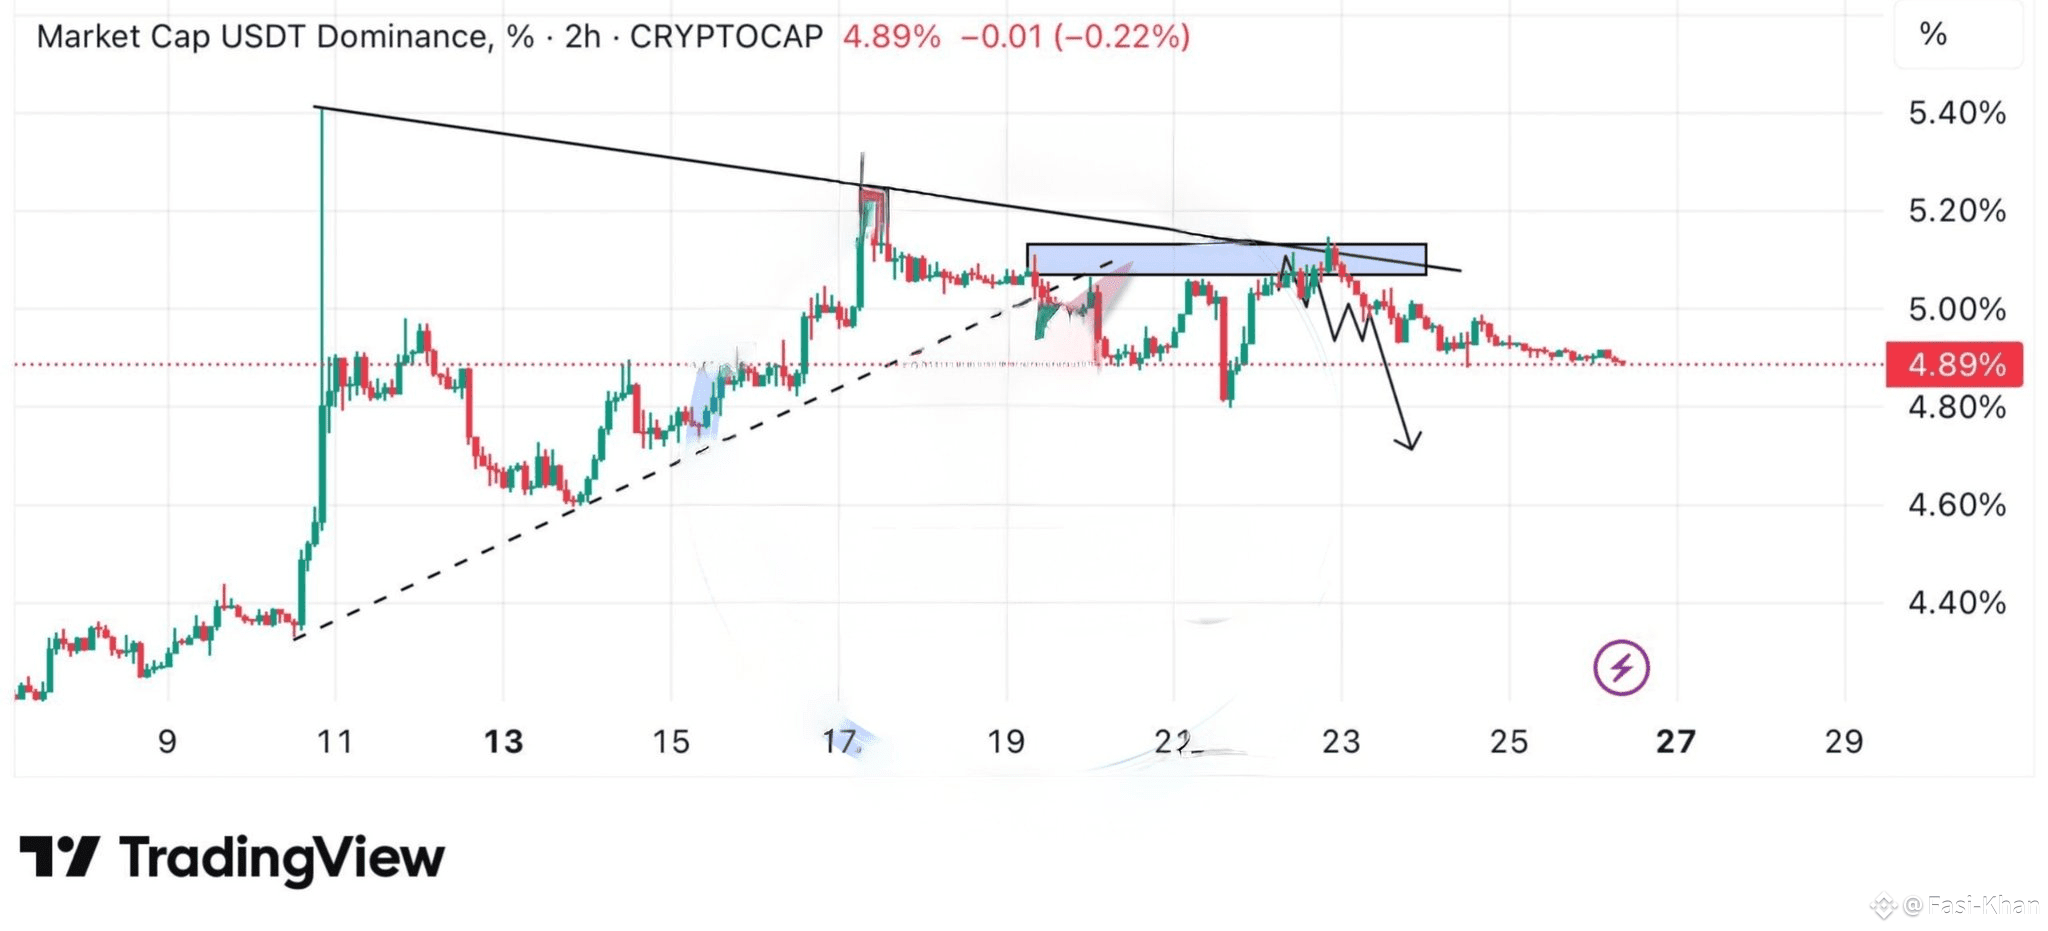
Hey Traders and Market Watchers! Let's dive into the USDT Market Cap Dominance (USDT.D) 2-hour chart. This chart is a crucial barometer for overall crypto market sentiment, as a falling dominance suggests money is rotating out of stablecoins and into riskier assets like $BTC and Altcoins.
Chart Breakdown
Bearish Structure: Since the high around 5.40%, USDT.D has been forming a clear Descending Triangle pattern. This is typically a bearish continuation pattern for the dominance chart, which, in turn, is a bullish signal for the wider crypto market.
A Descending Upper Trendline (lower highs).
A Horizontal Support Zone (the shaded rectangle) in the 5.00% to 5.10% area.
Breakdown and Retest:The dominance recently broke below the horizontal support zone.
It has since attempted a retest of that former support, which now appears to be acting as resistance (around 5.05%).
Currently, USDT.D is trading at 4.89%.
Key Pattern: The pattern is characterized by:
The Bullish Implication for Crypto
The descending triangle breakout, combined with the successful retest and subsequent drop, suggests that selling pressure on stablecoins is increasing, meaning traders are moving their capital into the market.
Confirmation: The measured move target from this pattern breakdown (represented by the black arrow) points to significantly lower dominance levels.
Market Effect: If USDT.D continues to fall, it indicates an influx of liquidity into the overall crypto ecosystem, often preceding rallies in Bitcoin and Altcoins.
What to Watch For
Continued Downside: We want to see USDT.D hold below the 5.00% former support and continue the downward trajectory. This supports a bullish outlook for BTC and Altcoins.
Invalidation: A quick snap back and close above the 5.10% resistance zone would invalidate the bearish dominance structure and signal risk-off sentiment returning to the market.
Conclusion: The technical structure on the USDT.D chart is pointing towards a risk-on environment. Keep a close eye on BTC's reaction as this dominance chart moves lower!
What do you think? Are we about to see a big Altcoin run? Let me know in the comments! 👇
