

While the market had a decent chance for a solid recovery, which we highlighted in our previouscrypto market prediction, we are seeing signs that hint at the problematic state of the current rally. However, in the case where Bitcoin breaks through around $115,000, the acceleration would be imminent even on Sept. 12.
Shiba Inu's bullish approach
Shiba Inu is stabilizing around $0.000013, and it is starting to exhibit technical dominance. SHIB is now taking back key moving averages after months of sideways consolidation and unsuccessful breakout attempts, setting itself up for possible growth in the near future.
SHIB has successfully broken through its 50-day Exponential Moving Average (EMA) on the daily chart, a technical milestone that frequently denotes a change in momentum from bearish to bullish. Throughout SHIB’s downward trend, the 50 EMA has continuously served as resistance, making this move noteworthy. Traders are starting to see this as a structural shift in market sentiment, now that the token is trading above it.
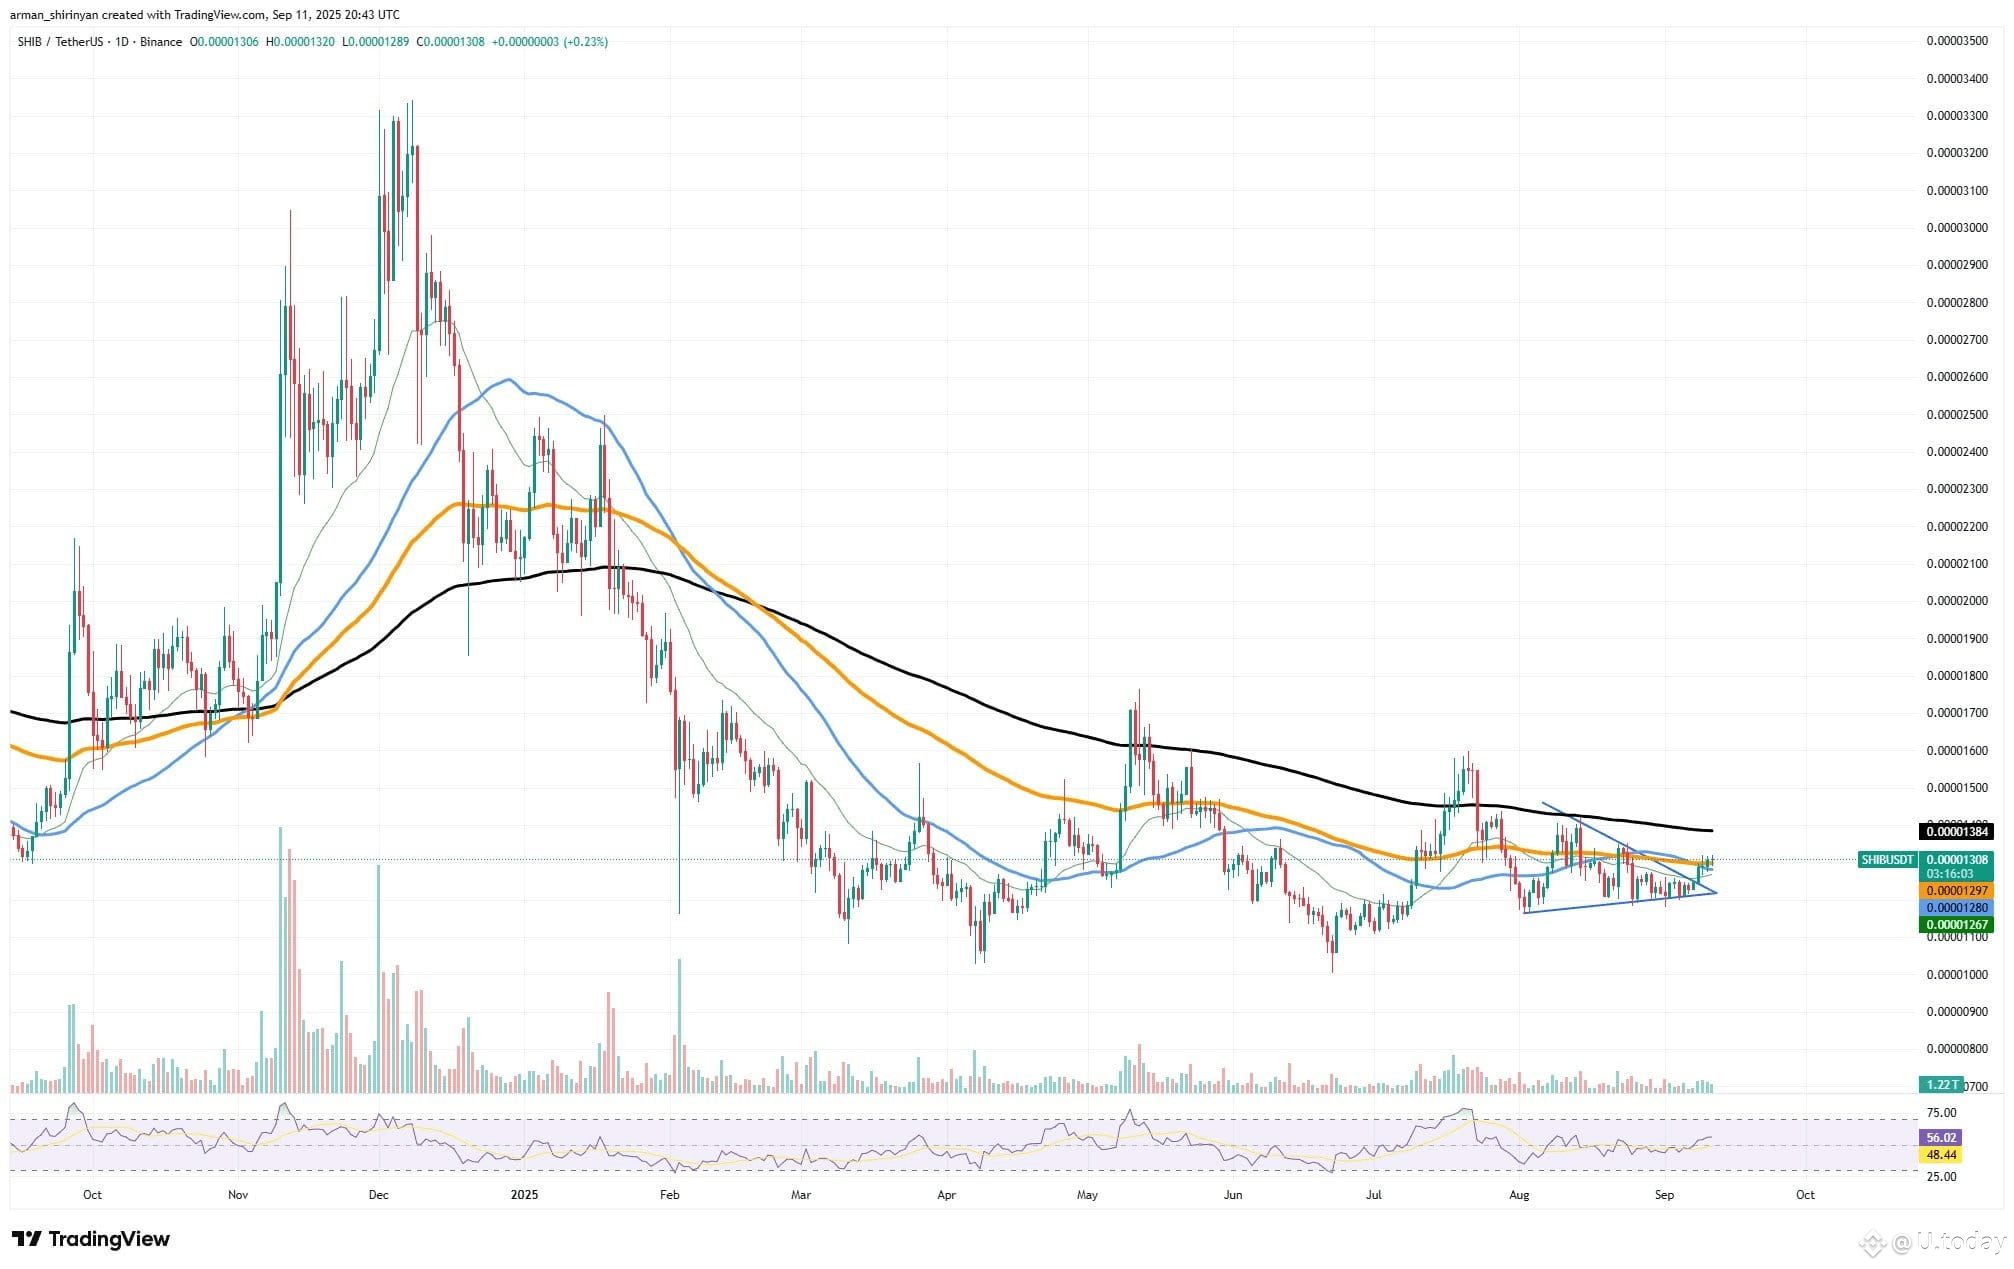
With rising volume and a strengthening Relative Strength Index (RSI), which is currently hovering just below overbought levels, the current price action indicates that SHIB is beginning to form a gradual uptrend. This shows that, although there are no immediate signs of exhaustion, buying interest is growing.
The next resistance levels to keep an eye on, if momentum keeps up, are the 200-day EMA at about $0.000014, and the $0.000015 zone, which has historically been a region with a lot of liquidity.
Looking at it more broadly, SHIB’s dominance is psychological as well as technical. Retaining price stability above the $0.000013 threshold boosts holders’ confidence, which lowers panic-selling and promotes accumulation. Given its ability to withstand market volatility, the token is becoming more and more significant in the meme-coin ecosystem, where it is still vying for market share with Dogecoin.
But caution is still required. Even though the 50 EMA breakthrough is a positive sign, SHIB still has to contend with longer-term resistance lines that might halt its upward trend if market sentiment declines. Investors ought to keep an eye on SHIB’s ability to maintain its position above the 50 EMA and progressively test higher moving averages.
XRP approaches key level
A critical test that could determine XRP’s short-term course is approaching at $3.00. As momentum builds toward a potential breakout attempt within the next day, the asset has been consolidating below a descending trendline. Just below the crucial psychological and technical barrier at $3.00, XRP is currently trading at about $2.99 on the daily chart.
Bullish sentiment has been strengthened by the recent rally, which has been bolstered by robust buying volume and a recovery above the 50-day and 100-day EMAs. The 200-day EMA and the descending resistance trendline, however, are convergent around the $3 area, making it a difficult obstacle to overcome.
card
In the short term, if XRP is able to break through $3 with convincing volume, it may lead to a surge of buying momentum that pushes the asset toward $3.30 to $3.50. This would confirm the bullish outlook for the upcoming weeks by clearly reversing the trend from its most recent corrective phase.
But if $3 is not broken, there may be rejection and a decline toward $2.80 or even $2.70, where the 100-day EMA offers support. This situation would prolong the consolidation phase by indicating that bulls are not yet powerful enough to overcome resistance.
The next day is important for investors. Rejection could result in another period of range-bound trading, while a confirmed breakout above $3 would suggest the possible beginning of a larger rally. Increased volume and momentum shifts around the $3 mark are indicators that traders should keep an eye out for, because they will shed light on XRP’s immediate trajectory.
Bitcoin's steady rise
Bitcoin is stabilizing close to the $114,000 mark, laying the groundwork for what may be a rally toward the much-awaited $150,000 mark.
Bitcoin has successfully surpassed its 50-day Exponential Moving Average (EMA), which is frequently regarded as a turning point for momentum, following weeks of consolidation and testing lower supports. During corrective phases of recent market cycles, the 50 EMA has proven to be a dependable resistance barrier. Bitcoin’s recovery of this level suggests that there may be a change from short-term pessimism to fresh bullish sentiment. Because the 50 EMA breakout has historically preceded robust price recoveries, traders frequently see this as the first confirmation of a structural rebound.
card
Buying activity is steadily rising, and volume patterns are supporting the breakout. Although it is still below overbought levels, the Relative Strength Index (RSI) is rising at the same time, suggesting that there is still potential for more upside without any immediate signs of exhaustion. If momentum continues, the next crucial resistance levels are located between $118,000 and $120,000, which is where liquidity has traditionally gathered.
Generally, the market is looking positive, but numerous reversal signals are there, so becoming euphoric too early is certainly not the call here. Staying put at around local resistance and awaiting breakthroughs on altcoins would be the only sign of a continuation at around this level.


