

Bitcoin price broke above $100K and now trades steadily over moving averages that guide this bull trend.
The 20-week SMA and 21-week EMA have held support since early 2023 with strong trend-following signals.
This moving average setup last formed in 2020 before BTC surged past $60K in just a few months.
Bitcoin continues trading above $100,000 while maintaining firm support on its 20-week simple moving average (SMA) and 21-week exponential moving average (EMA). These metrics now signal ongoing strength in the current bull market, with both moving averages trending upward. The support bands have held firmly since early 2023, allowing Bitcoin to post steady higher highs.
 Source: X
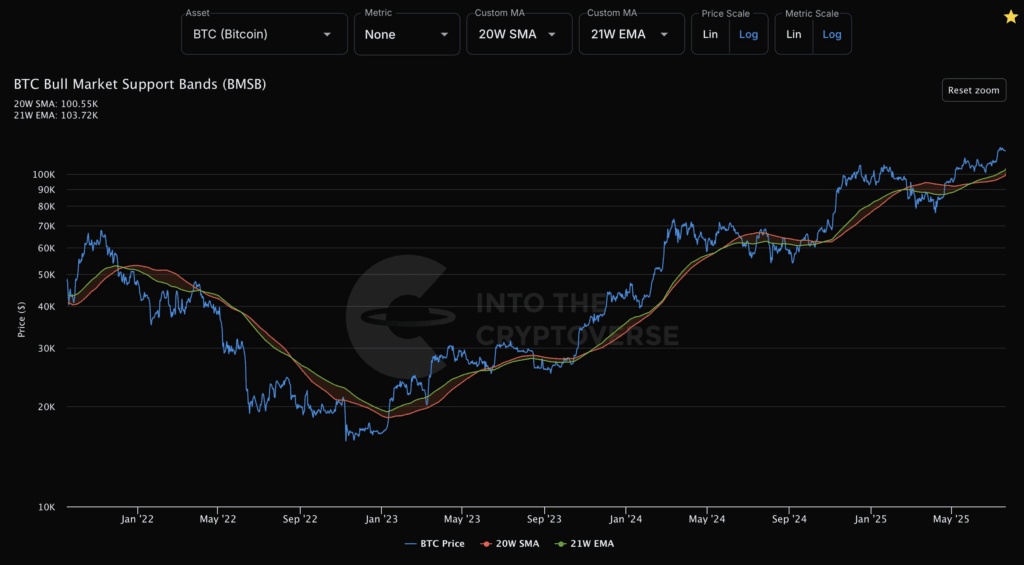
According to the BTC Bull Market Support Bands (BMSB) chart, the 20W SMA currently sits at $100.55K and the 21W EMA at $103.72K. These levels have historically acted as dynamic support zones during previous uptrends. The last clean cross above both bands occurred in early 2023 and has remained intact throughout 2024 and into mid-2025.
The chart shows Bitcoin’s breakout from below $20K in early 2023, followed by a consistent upward trajectory. Since then, price has maintained proximity to both the 20W SMA and 21W EMA, validating them as reliable trend indicators in the current cycle.
Support Bands Define the Bull Cycle
The BTC Bull Market Support Bands chart includes two core moving averages—20W SMA and 21W EMA—designed to smooth mid-term volatility. These averages allow analysts to identify sustainable bull or bear phases. During bullish conditions, Bitcoin tends to stay above or rebound from these levels.
Between January and June 2022, Bitcoin failed to reclaim the support bands, signaling a bearish environment. The price fell below $50K and eventually dropped to nearly $15K. The downward slope in both the 20W SMA and 21W EMA confirmed the negative momentum.
However, a clean breakout above both moving averages occurred in early 2023. Since then, Bitcoin has reclaimed the bands and consistently stayed above them. The chart now confirms a lasting bull phase with support near the $100K region.
Higher Lows and Smooth Trend Confirm Strength
From mid-2023 onward, Bitcoin has formed a sequence of higher lows while hugging both support bands. The 20W SMA and 21W EMA have aligned closely, providing a stable price floor. These patterns reflect a consistent bullish structure, typical of strong upward cycles.
The most recent retest of the 21W EMA near $80K in early 2024 saw a successful bounce. That confirmation established the band’s role as a mid-cycle safety net for long positions. Since that point, the price has gradually climbed with minimal deviation from its average path.
In May 2025, Bitcoin broke above $100K, placing both the 20W SMA and 21W EMA into six-figure territory. Price continues to float above these key levels, with the current market cap reinforcing investor conviction in long-term trend continuation.
Historical Context and Market Behavior
The same chart pattern was last observed in late 2020, when Bitcoin climbed from $12K to over $60K in less than six months. At that time, the support bands acted as precise entry zones during short pullbacks. Similar behavior is now visible across the current cycle.
Previous bull markets also saw price remain above both averages for extended periods. This sustained proximity created optimal zones for risk-managed accumulation strategies. The consistent curve seen in the current support bands mirrors that historical strength.
While corrections are part of natural market cycles, moving average support during a bull phase often limits drawdown risk. As both bands rise above $100K, traders and analysts will continue to monitor their role in defining the next major price levels.
