

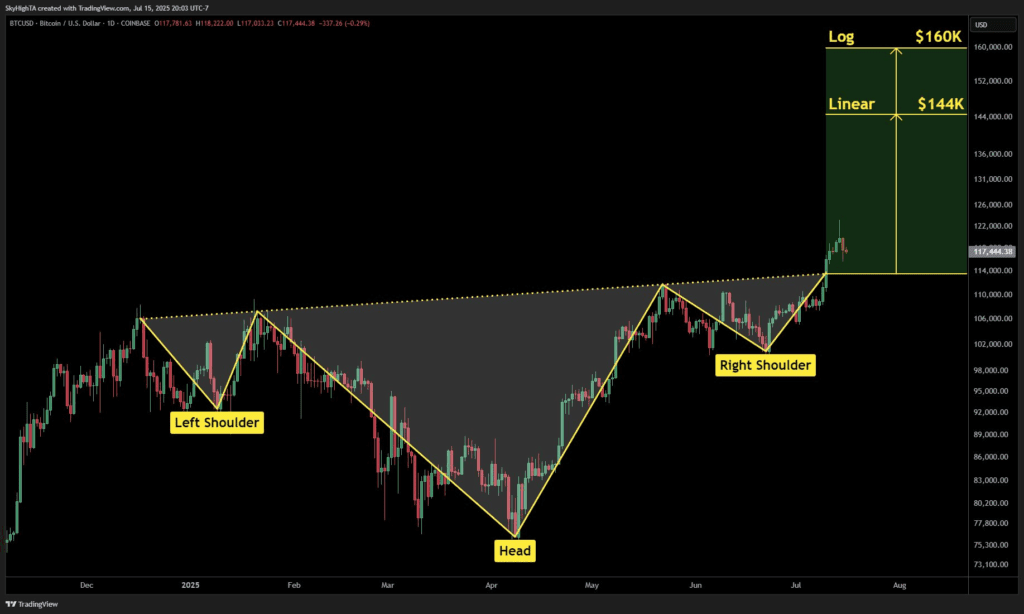
Bitcoin moved past $114K which completed a strong chart pattern showing a signal of more upside ahead.
The breakout shows Bitcoin may now aim for $144K under linear scale and $160K under log projection.
A clear neckline break confirms the pattern as buyers push BTC toward the next technical resistance zone.
Bitcoin has completed a classic inverse head and shoulders pattern on the daily chart, signaling a possible price breakout. The neckline was breached at around $114,000, sending BTC as high as $118,222 before a minor pullback to $117,444. Analysts project a target of $144,000 on the linear scale and $160,000 on the logarithmic scale based on the structure.
 Source: X Technical Pattern Signals Bullish Continuation
The chart displays a clear inverse head and shoulders formation spanning from late 2024 into July 2025. The pattern began with the left shoulder peaking in December 2024, followed by a dip to create the head in April 2025. A second rally formed the right shoulder in July 2025, completing the reversal structure.
A dotted neckline connects the peaks of both shoulders and the head, marking key resistance at $114,000. Bitcoin successfully broke through this neckline, triggering the measured move calculation. The breakout zone aligns with bullish projections of $144K under linear price scaling and $160K under logarithmic analysis.
The vertical distance from the head to the neckline provides the basis for these targets. The projected move also corresponds with historical breakout dynamics observed in similar reversal setups. Traders often use this pattern to identify trend reversals and measure upward potential.
Price Action and Volume Confirm the Setup
BTC/USD recorded a high of $118,222 shortly after breaking out from the neckline, confirming bullish market participation. Current price stands at $117,444, with modest resistance showing post-breakout consolidation. The price structure remains intact as long as BTC holds above the $114,000 support line.
The move occurred after months of consolidation between $90,000 and $114,000. That period of price contraction laid the groundwork for this reversal setup. Such formations are typically stronger when they develop over longer timeframes and involve deep retracements.
Volume analysis is crucial in validating such patterns. Though specific volume figures were not displayed in the chart, the price surge beyond resistance suggests increased demand. Sustained bullish momentum above $114,000 would confirm the breakout’s credibility.
Analysts tracking the pattern project sustained accumulation before the next leg higher. The large target zone between $144,000 and $160,000 reflects the pattern’s height and duration. Traders are now watching for retests of the neckline to confirm support before further upside.
Will the Pattern Reach Its Full Target?
The inverse head and shoulders pattern remains one of the most widely recognized bullish setups in technical analysis. Given Bitcoin’s strong history of reacting to classical chart formations, the current breakout holds weight in market interpretation.
The $144K linear target marks a critical psychological and technical level. If buying pressure continues, the $160K log-based projection may become the next resistance zone. However, the ability of BTC to maintain levels above the neckline will be key to sustaining bullish sentiment.
With the neckline breakout confirmed, all eyes remain on short-term consolidation. A bounce off $114,000 would likely accelerate upward momentum. Market participants are now closely monitoring volatility and volume to assess breakout continuation.
Bitcoin’s current trajectory brings attention back to long-term bullish projections. As institutional demand resurfaces, technical setups like this one may serve as leading indicators of broader market sentiment. Can Bitcoin hit the projected range before facing another major resistance?
