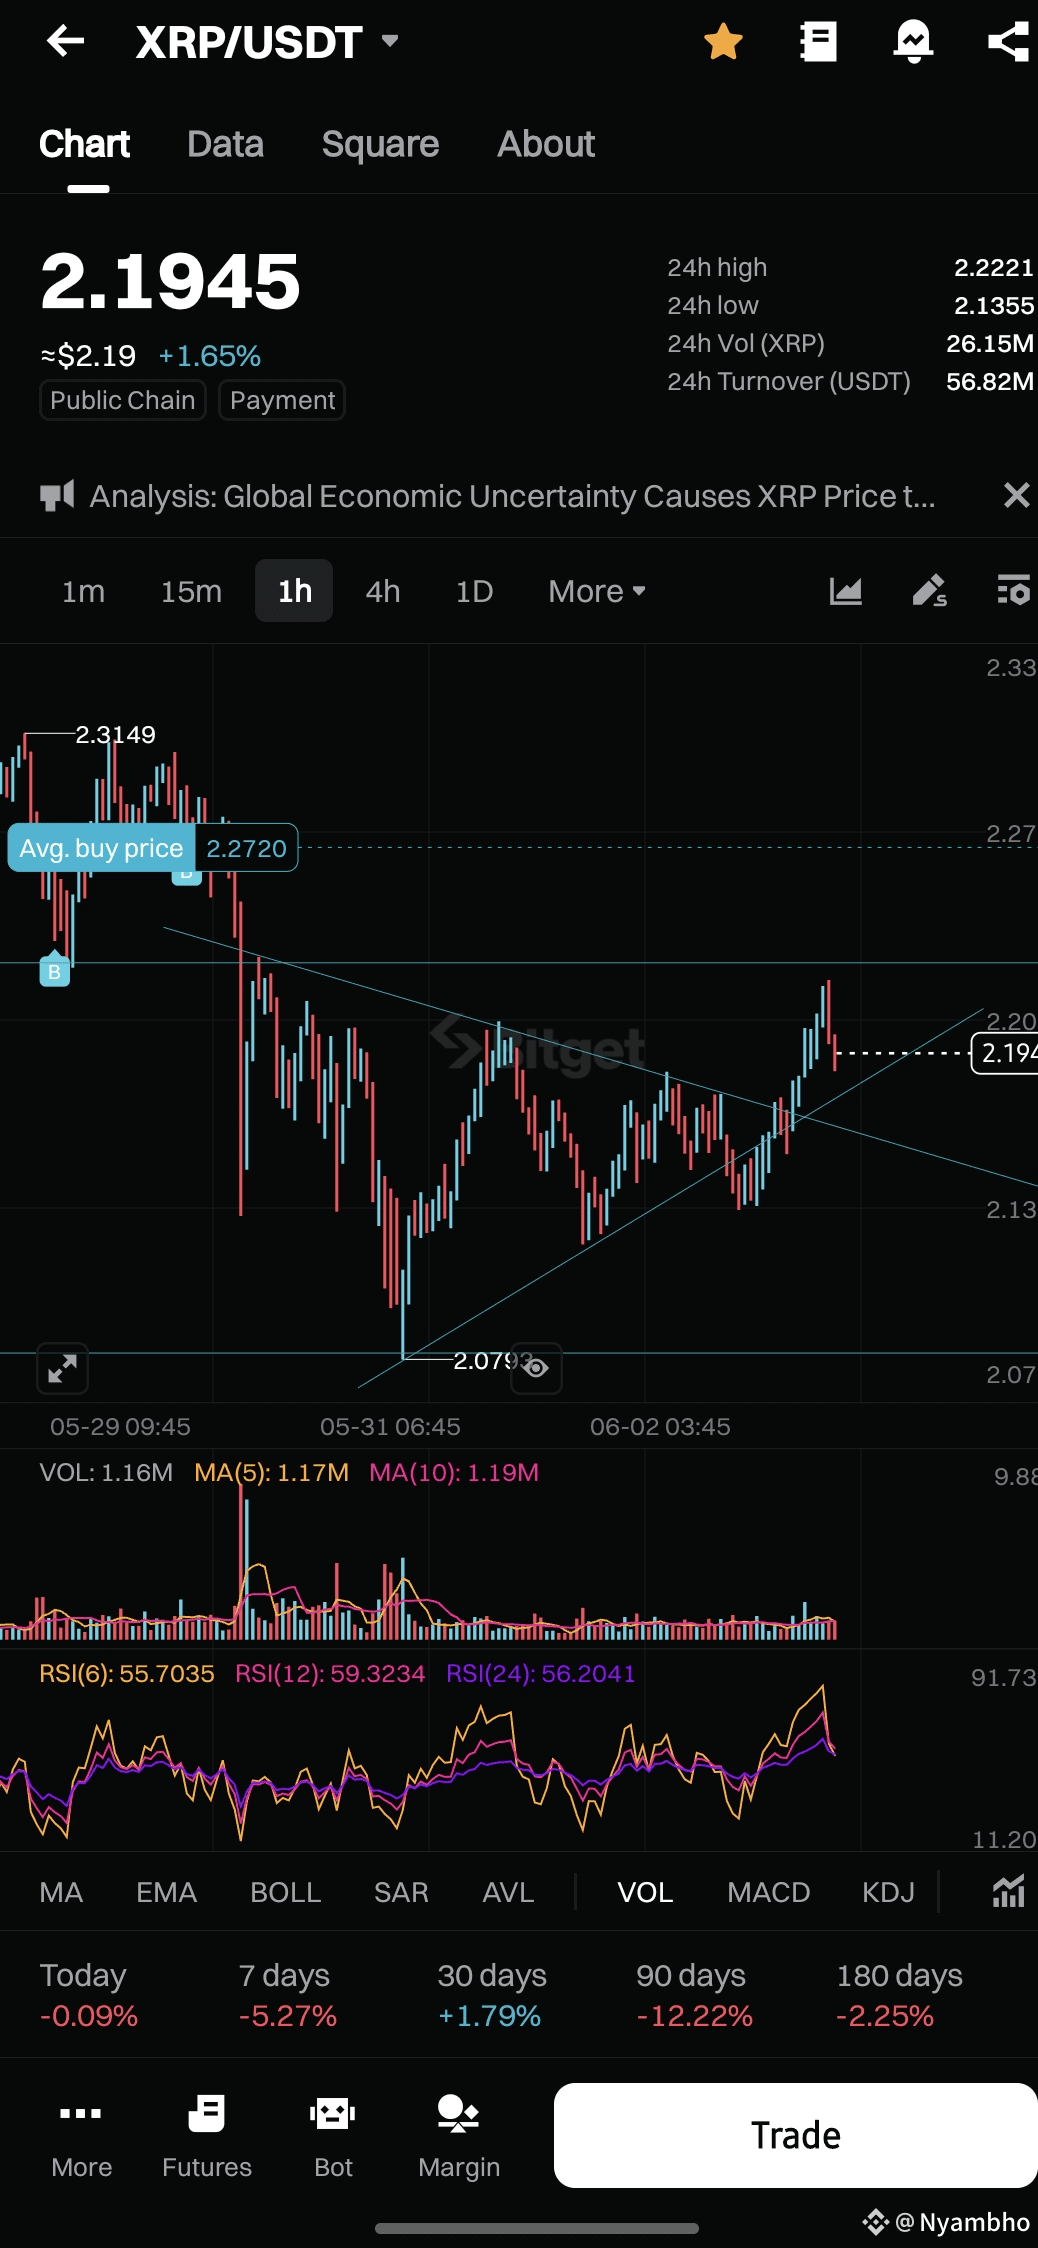
📉 $XRP /USDT Technical Analysis – 1H Chart
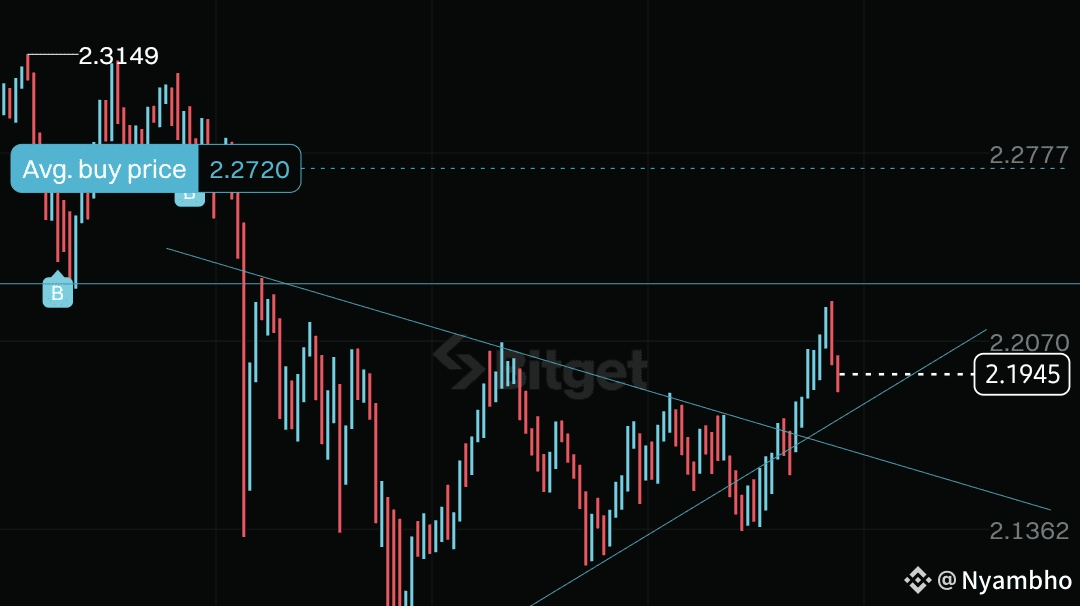
$XRP recently broke out of a falling wedge/symmetrical triangle pattern after touching a low around 2.079. The breakout pushed price to around 2.207, followed by a minor pullback — currently holding near 2.19.
🟦 Key Levels to Watch:
Support Zone: 2.13–2.14
Resistance: 2.27–2.31
Breakout Support: 2.07 (should not break below this if bullish trend continues)
📊 Indicators:
RSI(12) is near 59, showing moderate strength — not overbought yet.
Volume is increasing on bullish candles, showing buyers are stepping in.
📈 What’s Next:
If price holds above 2.13–2.14 and forms a higher low, we could see a retest of 2.27–2.31.
A breakdown below 2.13 could drag XRP back to 2.07 zone — important for bulls to protect.