

cryptotradehead
9k Publicaciones
cryptotradehead
Denunciar
Bloquear usuario
backtesting, analyse, how to use AI for trading - can you be a good trader?
Abrir operación
Trader frecuente
4.9 años
7 Siguiendo
2.6K+ Seguidores
5.0K+ Me gusta
Publicaciones
Cartera
Todo
Cotizaciones
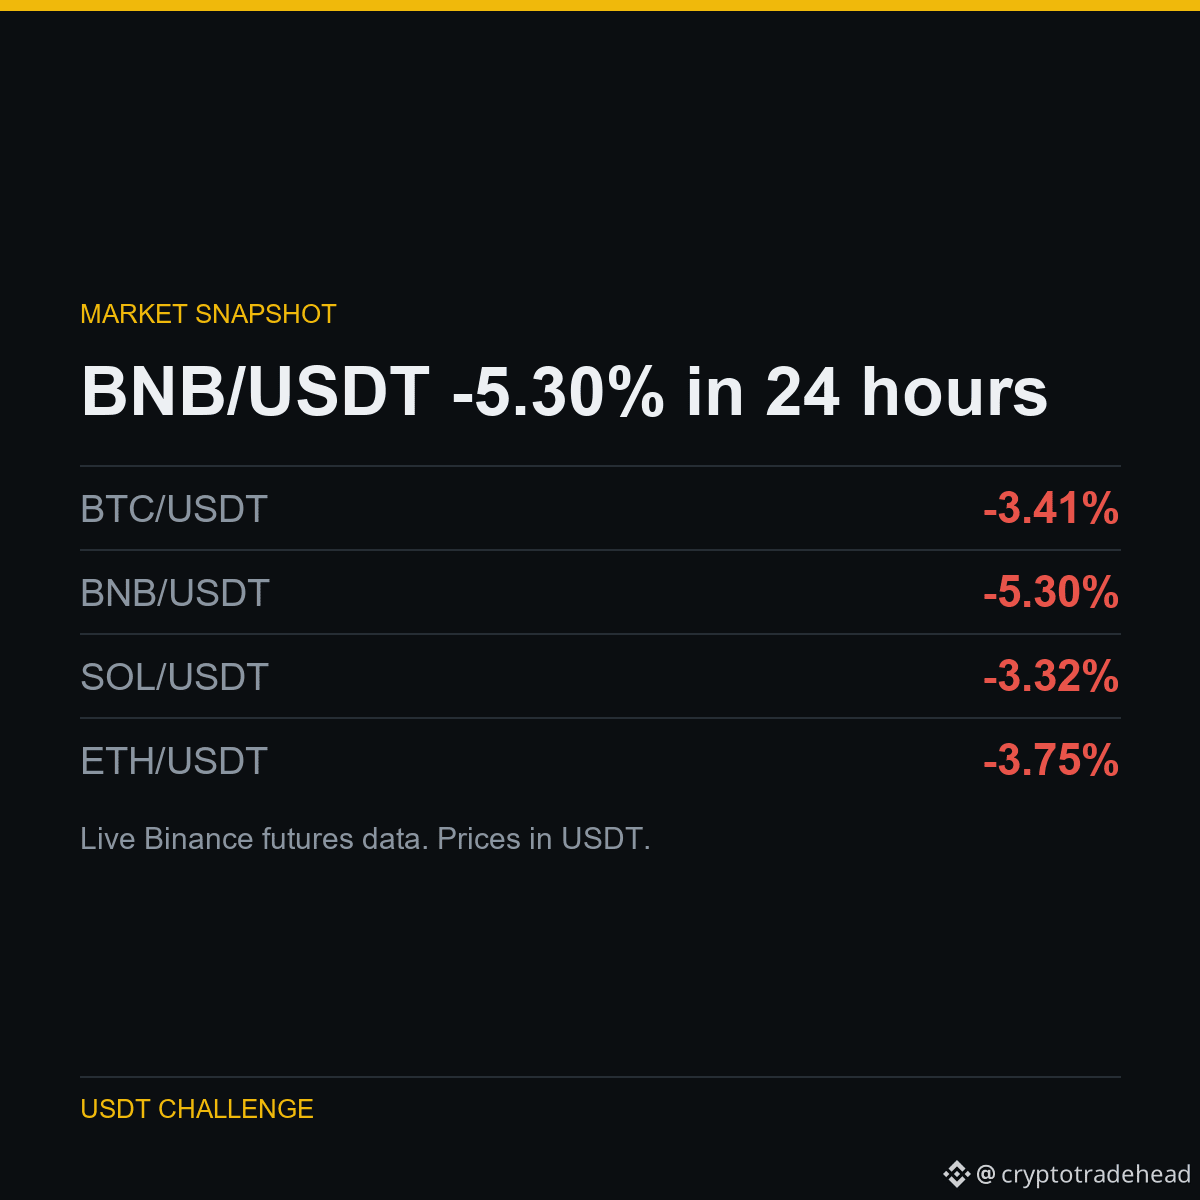
RESUMEN DE 24 HORAS
BTC/USDT: 77,369.60 USDT (-3.41%)
BNB/USDT: 701.57 USDT (-5.30%)
SOL/USDT: 96.71 USDT (-3.32%)
ETH/USDT: 2,230.20 USDT (-3.75%)
La tasa de financiación de BNB/USDT es de +0.0000% cada 8 h.
Contexto, no una señal: no publico puntos de entrada ni objetivos. Todas mis operaciones quedan registradas y se publican a posteriori, tanto las ganancias como las pérdidas.
Mencionado arriba: $BNB $ETH $BTC
#Binance #Crypto #Futures #BTC #Altcoins
RESUMEN DE 24 HORAS
BTC/USDT: 77,369.60 USDT (-3.41%)
BNB/USDT: 701.57 USDT (-5.30%)
SOL/USDT: 96.71 USDT (-3.32%)
ETH/USDT: 2,230.20 USDT (-3.75%)
La tasa de financiación de BNB/USDT es de +0.0000% cada 8 h.
Contexto, no una señal: no publico puntos de entrada ni objetivos. Todas mis operaciones quedan registradas y se publican a posteriori, tanto las ganancias como las pérdidas.
Mencionado arriba: $BNB $ETH $BTC
#Binance #Crypto #Futures #BTC #Altcoins
BTC/USDT: 77,369.60 USDT (-3.41%)
BNB/USDT: 701.57 USDT (-5.30%)
SOL/USDT: 96.71 USDT (-3.32%)
ETH/USDT: 2,230.20 USDT (-3.75%)
La tasa de financiación de BNB/USDT es de +0.0000% cada 8 h.
Contexto, no una señal: no publico puntos de entrada ni objetivos. Todas mis operaciones quedan registradas y se publican a posteriori, tanto las ganancias como las pérdidas.
Mencionado arriba: $BNB $ETH $BTC
#Binance #Crypto #Futures #BTC #Altcoins
6
Ver traducción
HOW I TESTED IT
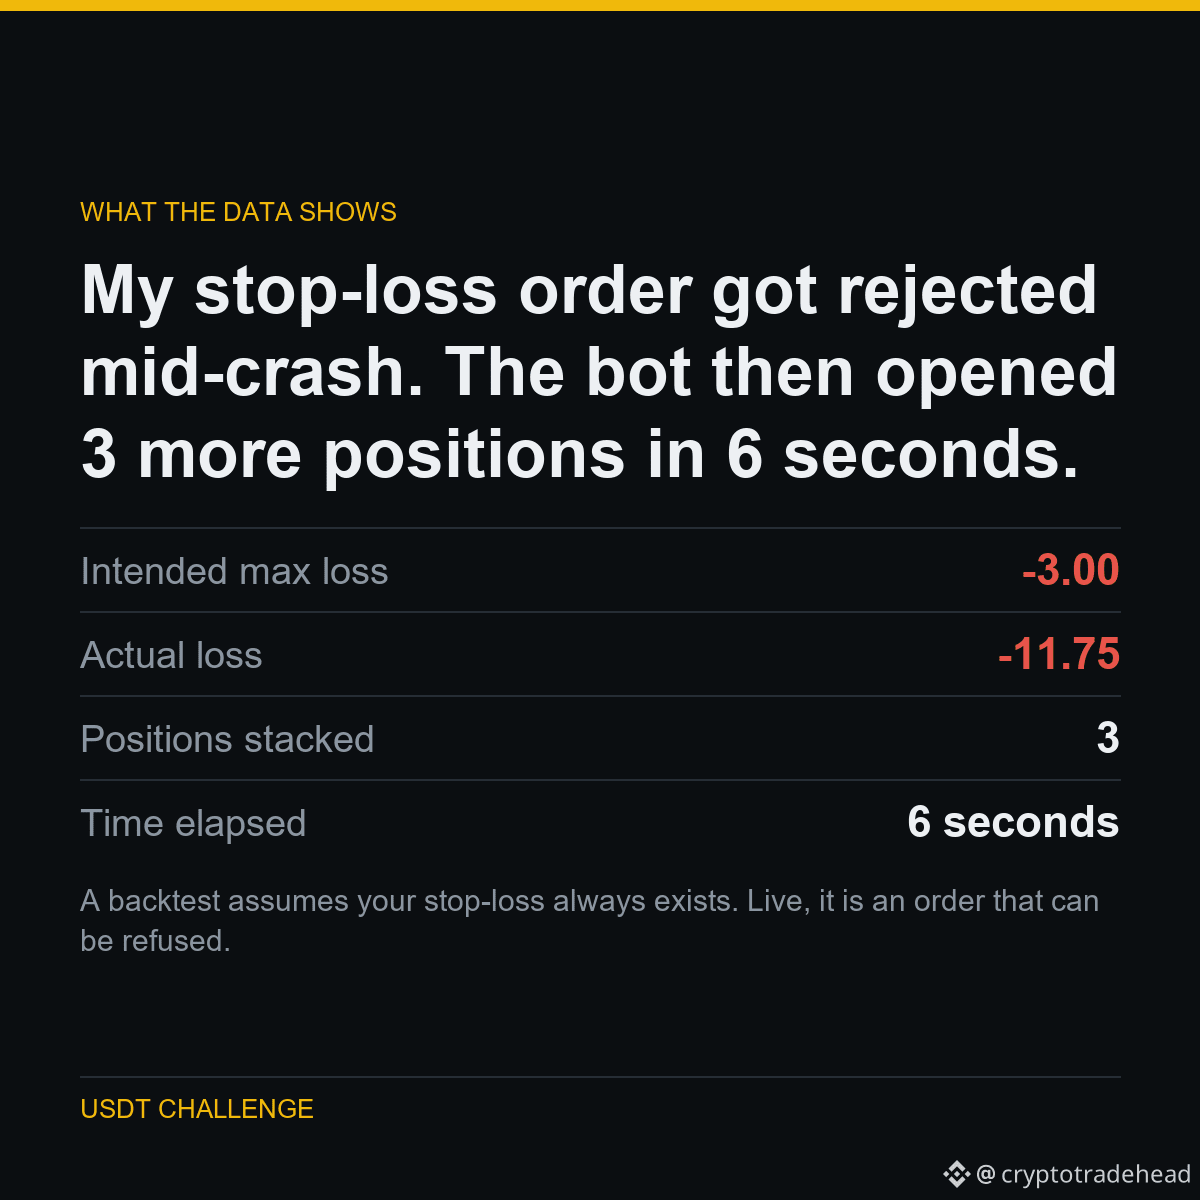
During a fast drop, Binance rejected my stop-loss with error -2021: the market had already moved past the trigger price before the order landed.
My code did not handle that rejection. The position stayed open with no stop, and because the bot's own state never recorded it, the next signal opened another position on top. Three times.
Intended risk was 3 USDT. Actual loss was 11.75 USDT.
THE NUMBERS
Intended max loss: -3.00
Actual loss: -11.75
Positions stacked: 3
Time elapsed: 6 seconds
A backtest assumes your stop-loss always exists. Live, it is an order that can be refused. The gap between those two assumptions is where real money goes.
Part of a public experiment: 5,063 USDT to 1,000,000 USDT, every result published - including the ones that make me look bad.
Run on $BNB
#Binance #Futures #Backtesting #TradingBot #CryptoData
HOW I TESTED IT
During a fast drop, Binance rejected my stop-loss with error -2021: the market had already moved past the trigger price before the order landed.
My code did not handle that rejection. The position stayed open with no stop, and because the bot's own state never recorded it, the next signal opened another position on top. Three times.
Intended risk was 3 USDT. Actual loss was 11.75 USDT.
THE NUMBERS
Intended max loss: -3.00
Actual loss: -11.75
Positions stacked: 3
Time elapsed: 6 seconds
A backtest assumes your stop-loss always exists. Live, it is an order that can be refused. The gap between those two assumptions is where real money goes.
Part of a public experiment: 5,063 USDT to 1,000,000 USDT, every result published - including the ones that make me look bad.
Run on $BNB
#Binance #Futures #Backtesting #TradingBot #CryptoData
During a fast drop, Binance rejected my stop-loss with error -2021: the market had already moved past the trigger price before the order landed.
My code did not handle that rejection. The position stayed open with no stop, and because the bot's own state never recorded it, the next signal opened another position on top. Three times.
Intended risk was 3 USDT. Actual loss was 11.75 USDT.
THE NUMBERS
Intended max loss: -3.00
Actual loss: -11.75
Positions stacked: 3
Time elapsed: 6 seconds
A backtest assumes your stop-loss always exists. Live, it is an order that can be refused. The gap between those two assumptions is where real money goes.
Part of a public experiment: 5,063 USDT to 1,000,000 USDT, every result published - including the ones that make me look bad.
Run on $BNB
#Binance #Futures #Backtesting #TradingBot #CryptoData
10
Artículo
Ver traducción
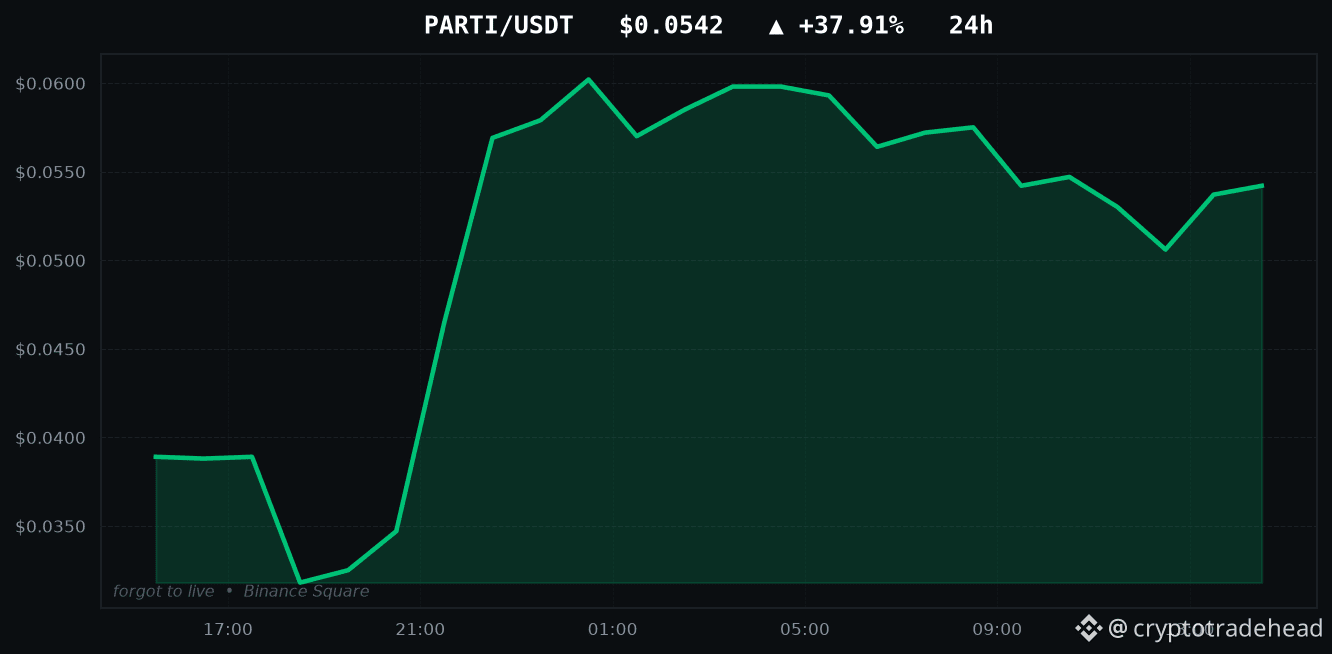
PARTI is up +37.91% - I tested both ways to trade itTODAY'S TOP GAINERS
PARTI: +37.91%
BEAMX: +33.98%
ALPINE: +25.60%
SOPH: +20.28%
LSK: +19.36%
Every account on this app will show you this list. Here is the part they skip.
I backtested both ways of trading a move like PARTI's +37.91%: buying the breakout, and fading it on the assumption it reverts. Both lost money. Not narrowly - they lost roughly the transaction cost, 0.240% per round trip, which is what a signal carrying no information looks like once you charge it fees.
A large 24-hour move tells you something already happened. It does not tell you what happens next, and the data says so in both directions.
Part of a public experiment: every strategy I test gets published, working or not.
Movers above: $PARTI $BEAMX $ALPINE
#Binance #Altcoins #Futures #PARTI #CryptoData
PARTI is up +37.91% - I tested both ways to trade it
TODAY'S TOP GAINERS
PARTI: +37.91%
BEAMX: +33.98%
ALPINE: +25.60%
SOPH: +20.28%
LSK: +19.36%
Every account on this app will show you this list. Here is the part they skip.
I backtested both ways of trading a move like PARTI's +37.91%: buying the breakout, and fading it on the assumption it reverts. Both lost money. Not narrowly - they lost roughly the transaction cost, 0.240% per round trip, which is what a signal carrying no information looks like once you charge it fees.
A large 24-hour move tells you something already happened. It does not tell you what happens next, and the data says so in both directions.
Part of a public experiment: every strategy I test gets published, working or not.
Movers above: $PARTI $BEAMX $ALPINE
#Binance #Altcoins #Futures #PARTI #CryptoData
PARTI: +37.91%
BEAMX: +33.98%
ALPINE: +25.60%
SOPH: +20.28%
LSK: +19.36%
Every account on this app will show you this list. Here is the part they skip.
I backtested both ways of trading a move like PARTI's +37.91%: buying the breakout, and fading it on the assumption it reverts. Both lost money. Not narrowly - they lost roughly the transaction cost, 0.240% per round trip, which is what a signal carrying no information looks like once you charge it fees.
A large 24-hour move tells you something already happened. It does not tell you what happens next, and the data says so in both directions.
Part of a public experiment: every strategy I test gets published, working or not.
Movers above: $PARTI $BEAMX $ALPINE
#Binance #Altcoins #Futures #PARTI #CryptoData
38
Artículo
Ver traducción
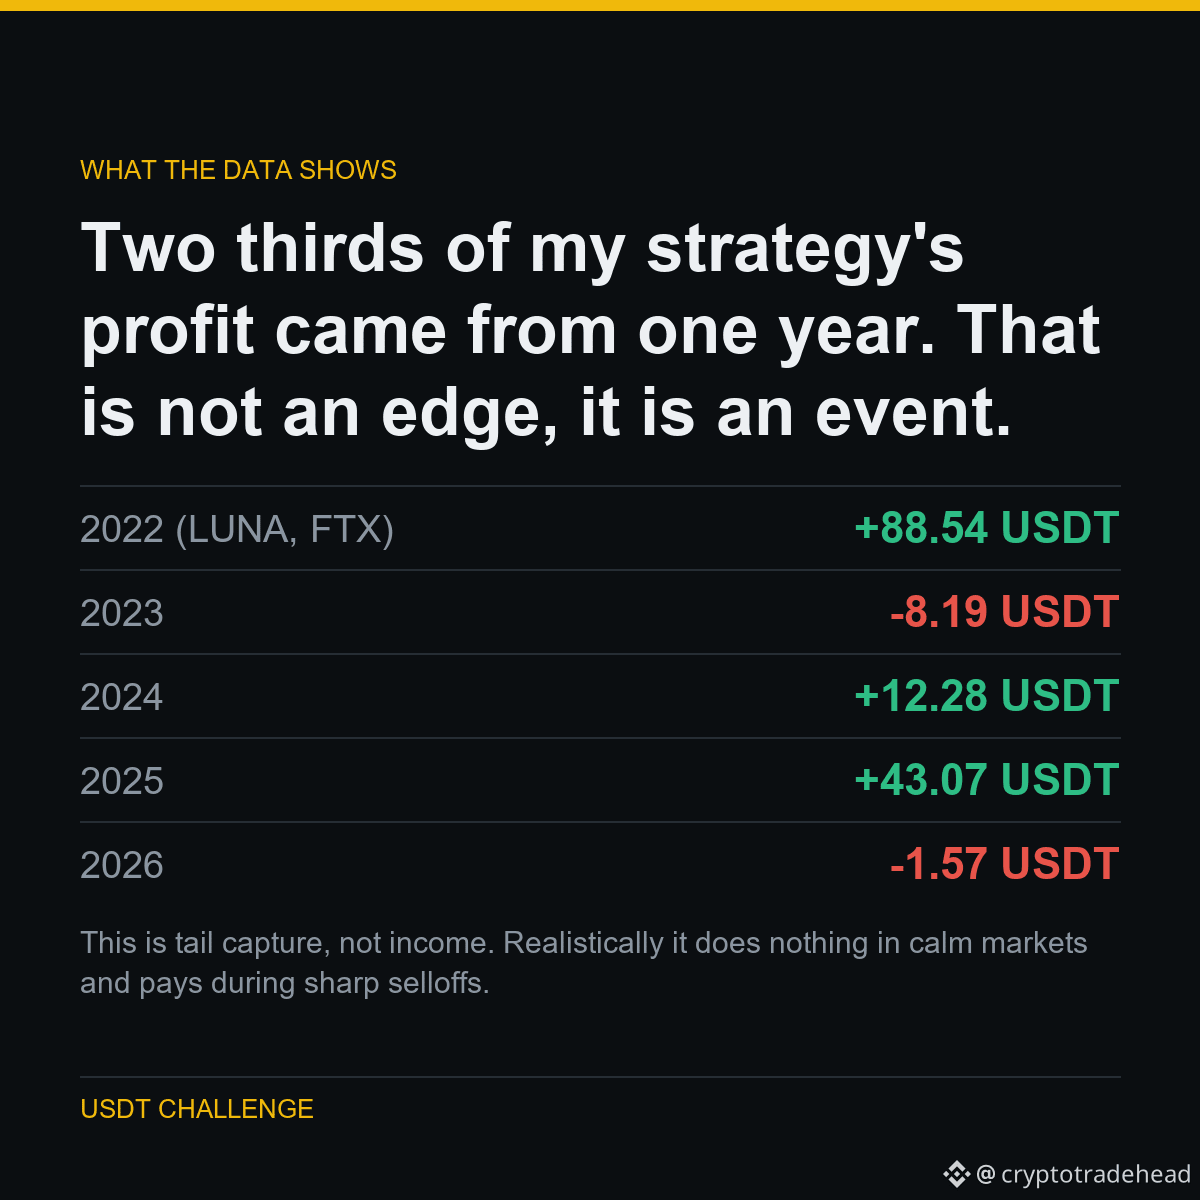
Two thirds of my strategy's profit came from one year. That is not an edge, it is an eventTwo thirds of my strategy's profit came from one year. That is not an edge, it is an event.
The headline number was +134.12 USDT from short breakouts. Then I split it by year.
2022 - the year of the LUNA collapse and the FTX failure - produced 88.54 of it. Strip that year out and four years of trading returned 45.59 USDT, most of it from 2025.
2026 so far is flat.
WHAT IT MEANS
This is tail capture, not income. Realistically it does nothing in calm markets and pays during sharp selloffs. Expecting it to earn every month is how people quit a strategy right before it works.
Part of a public experiment: 5,063 USDT to 1,000,000 USDT, every result published - including the ones that make me look bad.
Run on $BTC $LTC
#Binance #Futures #Backtesting #TradingBot #CryptoData
Two thirds of my strategy's profit came from one year. That is not an edge, it is an event
Two thirds of my strategy's profit came from one year. That is not an edge, it is an event.
The headline number was +134.12 USDT from short breakouts. Then I split it by year.
2022 - the year of the LUNA collapse and the FTX failure - produced 88.54 of it. Strip that year out and four years of trading returned 45.59 USDT, most of it from 2025.
2026 so far is flat.
WHAT IT MEANS
This is tail capture, not income. Realistically it does nothing in calm markets and pays during sharp selloffs. Expecting it to earn every month is how people quit a strategy right before it works.
Part of a public experiment: 5,063 USDT to 1,000,000 USDT, every result published - including the ones that make me look bad.
Run on $BTC $LTC
#Binance #Futures #Backtesting #TradingBot #CryptoData
The headline number was +134.12 USDT from short breakouts. Then I split it by year.
2022 - the year of the LUNA collapse and the FTX failure - produced 88.54 of it. Strip that year out and four years of trading returned 45.59 USDT, most of it from 2025.
2026 so far is flat.
WHAT IT MEANS
This is tail capture, not income. Realistically it does nothing in calm markets and pays during sharp selloffs. Expecting it to earn every month is how people quit a strategy right before it works.
Part of a public experiment: 5,063 USDT to 1,000,000 USDT, every result published - including the ones that make me look bad.
Run on $BTC $LTC
#Binance #Futures #Backtesting #TradingBot #CryptoData
19
Ver traducción
HOW I TESTED IT
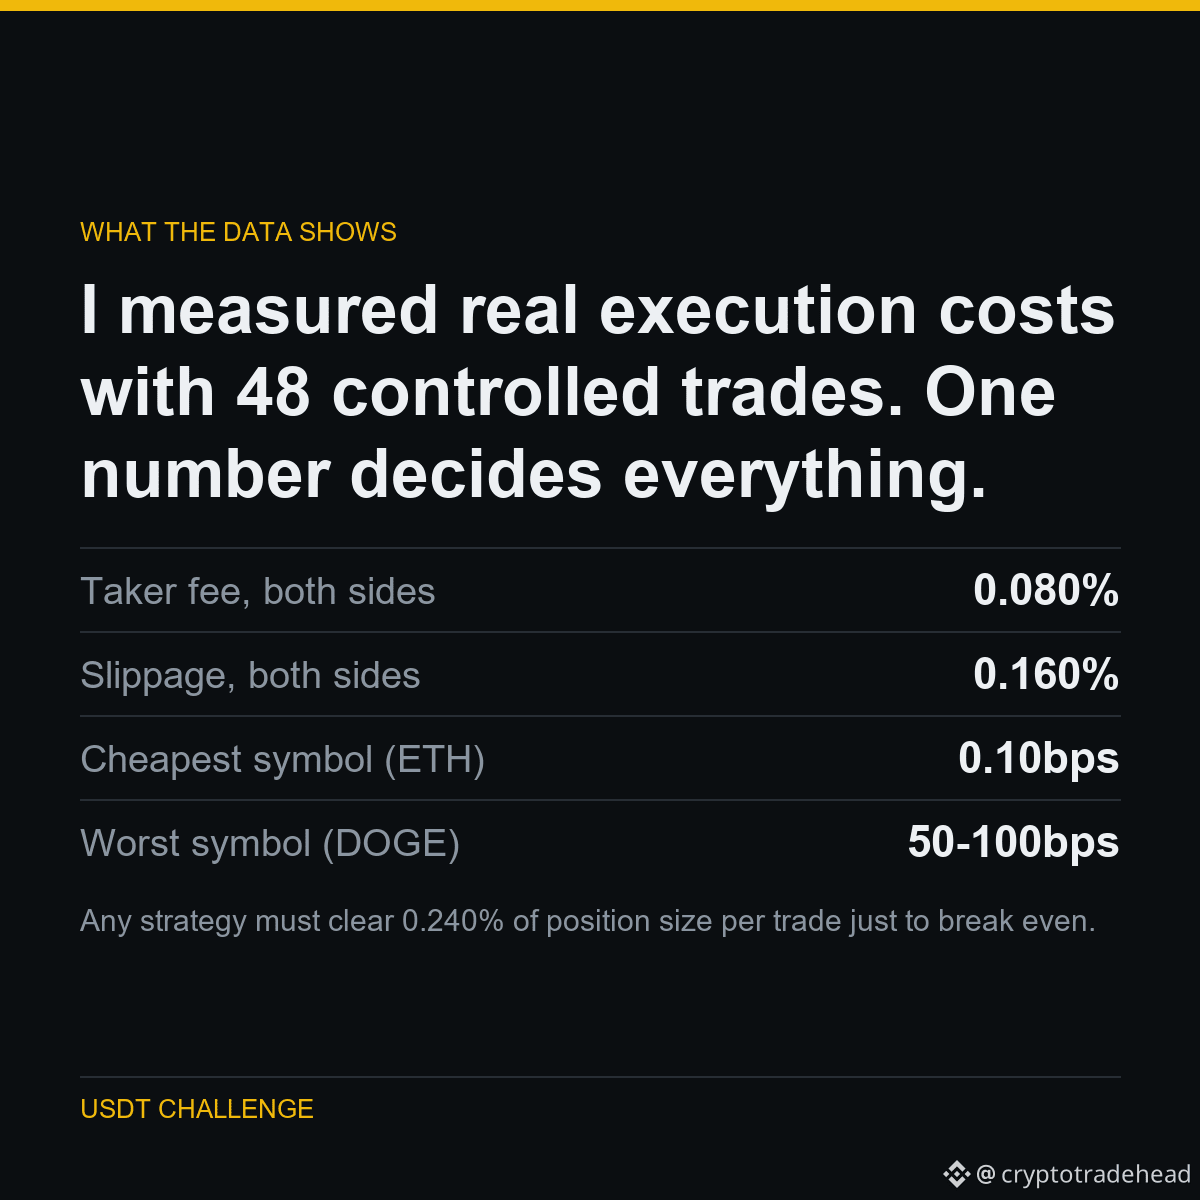
I stopped assuming what trading costs and measured it: 48 controlled round trips, entering and exiting immediately, recording the actual fill against the reference price.
Fee was constant at 0.04% per side. Slippage was not - ETH filled at essentially zero, while DOGE cost 50 to 100 basis points per round trip.
On a 150 USDT position, a round trip costs 0.36 USDT before the market moves at all.
THE NUMBERS
Taker fee, both sides: 0.080%
Slippage, both sides: 0.160%
Cheapest symbol (ETH): 0.10bps
Worst symbol (DOGE): 50-100bps
Any strategy must clear 0.240% of position size per trade just to break even. Most published setups never mention this number, which is why most published setups lose money.
Part of a public experiment: 5,063 USDT to 1,000,000 USDT, every result published - including the ones that make me look bad.
Run on $ETH $DOGE
#Binance #Futures #Backtesting #TradingBot #CryptoData
HOW I TESTED IT
I stopped assuming what trading costs and measured it: 48 controlled round trips, entering and exiting immediately, recording the actual fill against the reference price.
Fee was constant at 0.04% per side. Slippage was not - ETH filled at essentially zero, while DOGE cost 50 to 100 basis points per round trip.
On a 150 USDT position, a round trip costs 0.36 USDT before the market moves at all.
THE NUMBERS
Taker fee, both sides: 0.080%
Slippage, both sides: 0.160%
Cheapest symbol (ETH): 0.10bps
Worst symbol (DOGE): 50-100bps
Any strategy must clear 0.240% of position size per trade just to break even. Most published setups never mention this number, which is why most published setups lose money.
Part of a public experiment: 5,063 USDT to 1,000,000 USDT, every result published - including the ones that make me look bad.
Run on $ETH $DOGE
#Binance #Futures #Backtesting #TradingBot #CryptoData
I stopped assuming what trading costs and measured it: 48 controlled round trips, entering and exiting immediately, recording the actual fill against the reference price.
Fee was constant at 0.04% per side. Slippage was not - ETH filled at essentially zero, while DOGE cost 50 to 100 basis points per round trip.
On a 150 USDT position, a round trip costs 0.36 USDT before the market moves at all.
THE NUMBERS
Taker fee, both sides: 0.080%
Slippage, both sides: 0.160%
Cheapest symbol (ETH): 0.10bps
Worst symbol (DOGE): 50-100bps
Any strategy must clear 0.240% of position size per trade just to break even. Most published setups never mention this number, which is why most published setups lose money.
Part of a public experiment: 5,063 USDT to 1,000,000 USDT, every result published - including the ones that make me look bad.
Run on $ETH $DOGE
#Binance #Futures #Backtesting #TradingBot #CryptoData
54
Artículo
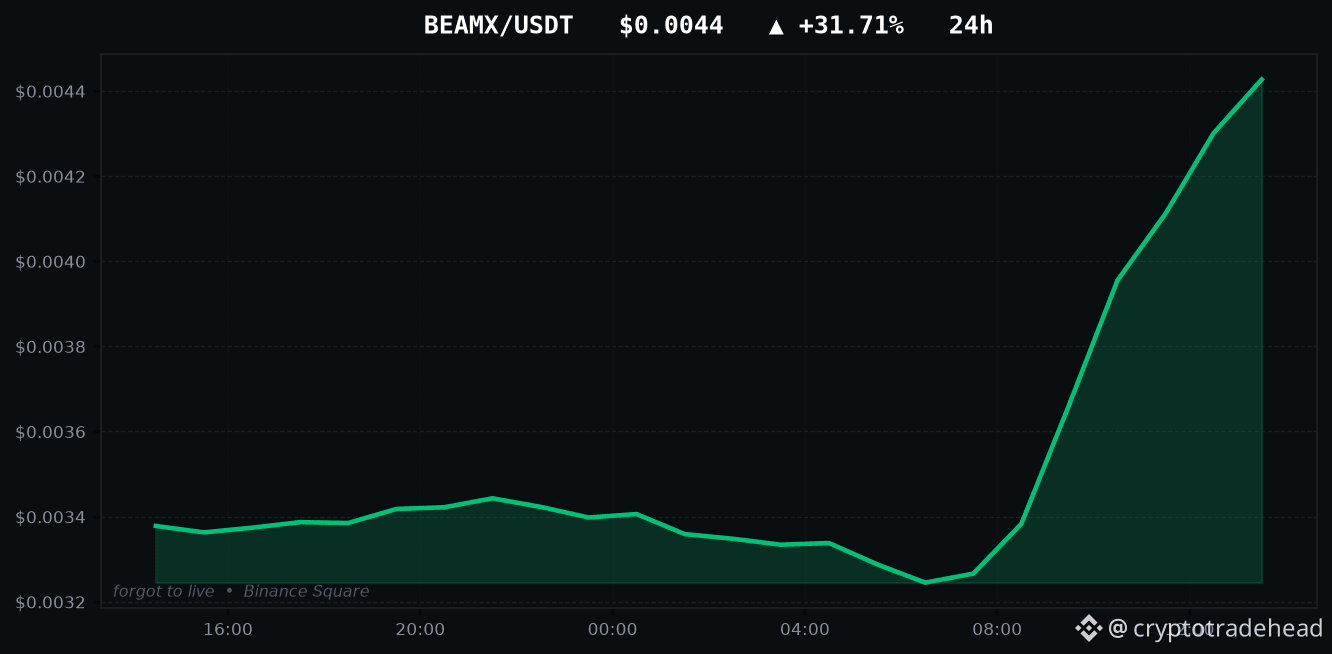
BEAMX sube un +31.71%: probé las dos formas de operarloMAYORES SUBIDAS DE HOY
BEAMX: +31.71%
PARTI: +21.23%
ALPINE: +20.48%
SOPH: +20.42%
HYPE: +15.73%
Todo usuario de esta app verá esta lista. Esta es la parte que omiten.
Probé con datos históricos las dos formas de operar un movimiento como el +31.71% de BEAMX: comprar la ruptura y operar contra el movimiento suponiendo que se revertiría. Ambas dieron pérdidas. Y no por poco: perdieron aproximadamente el coste de transacción, un 0.240% por operación de ida y vuelta. Así es como se ve una señal sin información cuando se le aplican comisiones.
Un gran movimiento en 24 horas te dice que algo ya pasó. No te dice qué pasará después, y los datos lo demuestran en ambos sentidos.
BEAMX sube un +31.71%: probé las dos formas de operarlo
MAYORES SUBIDAS DE HOY
BEAMX: +31.71%
PARTI: +21.23%
ALPINE: +20.48%
SOPH: +20.42%
HYPE: +15.73%
Todo usuario de esta app verá esta lista. Esta es la parte que omiten.
Probé con datos históricos las dos formas de operar un movimiento como el +31.71% de BEAMX: comprar la ruptura y operar contra el movimiento suponiendo que se revertiría. Ambas dieron pérdidas. Y no por poco: perdieron aproximadamente el coste de transacción, un 0.240% por operación de ida y vuelta. Así es como se ve una señal sin información cuando se le aplican comisiones.
Un gran movimiento en 24 horas te dice que algo ya pasó. No te dice qué pasará después, y los datos lo demuestran en ambos sentidos.
BEAMX: +31.71%
PARTI: +21.23%
ALPINE: +20.48%
SOPH: +20.42%
HYPE: +15.73%
Todo usuario de esta app verá esta lista. Esta es la parte que omiten.
Probé con datos históricos las dos formas de operar un movimiento como el +31.71% de BEAMX: comprar la ruptura y operar contra el movimiento suponiendo que se revertiría. Ambas dieron pérdidas. Y no por poco: perdieron aproximadamente el coste de transacción, un 0.240% por operación de ida y vuelta. Así es como se ve una señal sin información cuando se le aplican comisiones.
Un gran movimiento en 24 horas te dice que algo ya pasó. No te dice qué pasará después, y los datos lo demuestran en ambos sentidos.
47
Artículo
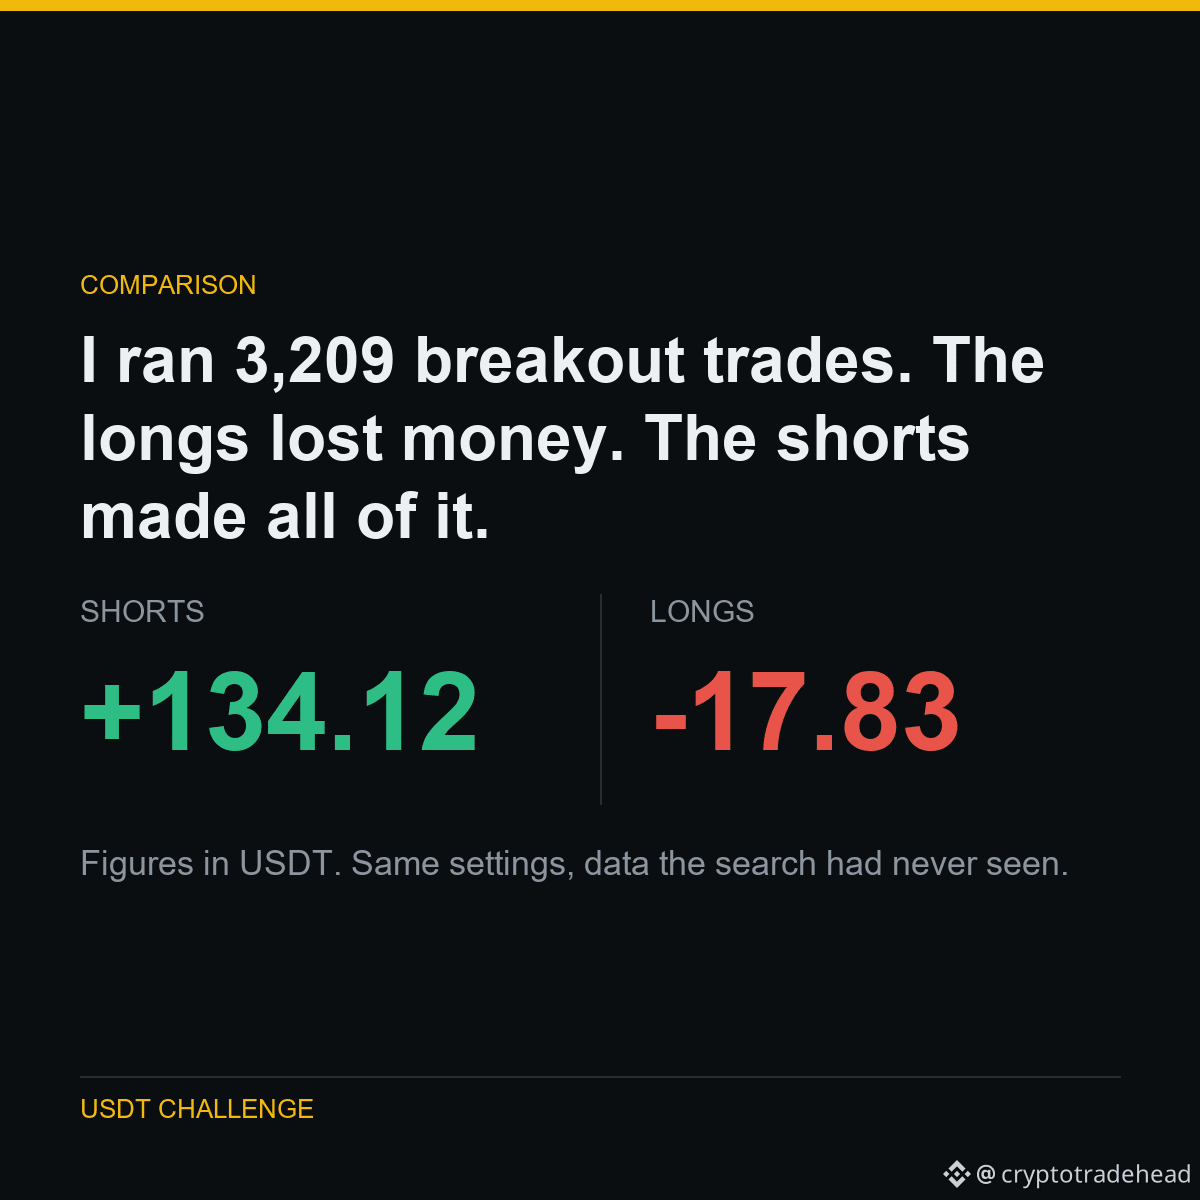
Probé 3,209 operaciones de ruptura. Las posiciones largas perdieron dinero. Las cortas generaron todas las ganancias.Probé 3,209 operaciones de ruptura. Las posiciones largas perdieron dinero. Las cortas generaron todas las ganancias.
Canal Donchian de 20 períodos, stop basado en ATR, 10 símbolos, cuatro años y medio.
Si esto fuera simplemente aprovechar un mercado alcista, las posiciones largas serían las ganadoras. No lo son: dan pérdidas.
Las posiciones cortas incluso ganaron dinero con monedas que SUBIERON durante el período. BTC ganó un 94 % con una estrategia de comprar y mantener, y aun así vender en corto sus rupturas a la baja generó +22.83 USDT. XRP ganó un 87 %; las posiciones cortas generaron +24.27 USDT.
QUÉ SIGNIFICA
Las criptomonedas caen más rápido de lo que suben: las cascadas de liquidaciones son asimétricas. Es una estructura de mercado documentada, por eso este resultado es más creíble que uno que solo funciona cuando todo sube.
Probé 3,209 operaciones de ruptura. Las posiciones largas perdieron dinero. Las cortas generaron todas las ganancias.
Probé 3,209 operaciones de ruptura. Las posiciones largas perdieron dinero. Las cortas generaron todas las ganancias.
Canal Donchian de 20 períodos, stop basado en ATR, 10 símbolos, cuatro años y medio.
Si esto fuera simplemente aprovechar un mercado alcista, las posiciones largas serían las ganadoras. No lo son: dan pérdidas.
Las posiciones cortas incluso ganaron dinero con monedas que SUBIERON durante el período. BTC ganó un 94 % con una estrategia de comprar y mantener, y aun así vender en corto sus rupturas a la baja generó +22.83 USDT. XRP ganó un 87 %; las posiciones cortas generaron +24.27 USDT.
QUÉ SIGNIFICA
Las criptomonedas caen más rápido de lo que suben: las cascadas de liquidaciones son asimétricas. Es una estructura de mercado documentada, por eso este resultado es más creíble que uno que solo funciona cuando todo sube.
Canal Donchian de 20 períodos, stop basado en ATR, 10 símbolos, cuatro años y medio.
Si esto fuera simplemente aprovechar un mercado alcista, las posiciones largas serían las ganadoras. No lo son: dan pérdidas.
Las posiciones cortas incluso ganaron dinero con monedas que SUBIERON durante el período. BTC ganó un 94 % con una estrategia de comprar y mantener, y aun así vender en corto sus rupturas a la baja generó +22.83 USDT. XRP ganó un 87 %; las posiciones cortas generaron +24.27 USDT.
QUÉ SIGNIFICA
Las criptomonedas caen más rápido de lo que suben: las cascadas de liquidaciones son asimétricas. Es una estructura de mercado documentada, por eso este resultado es más creíble que uno que solo funciona cuando todo sube.
17
Artículo
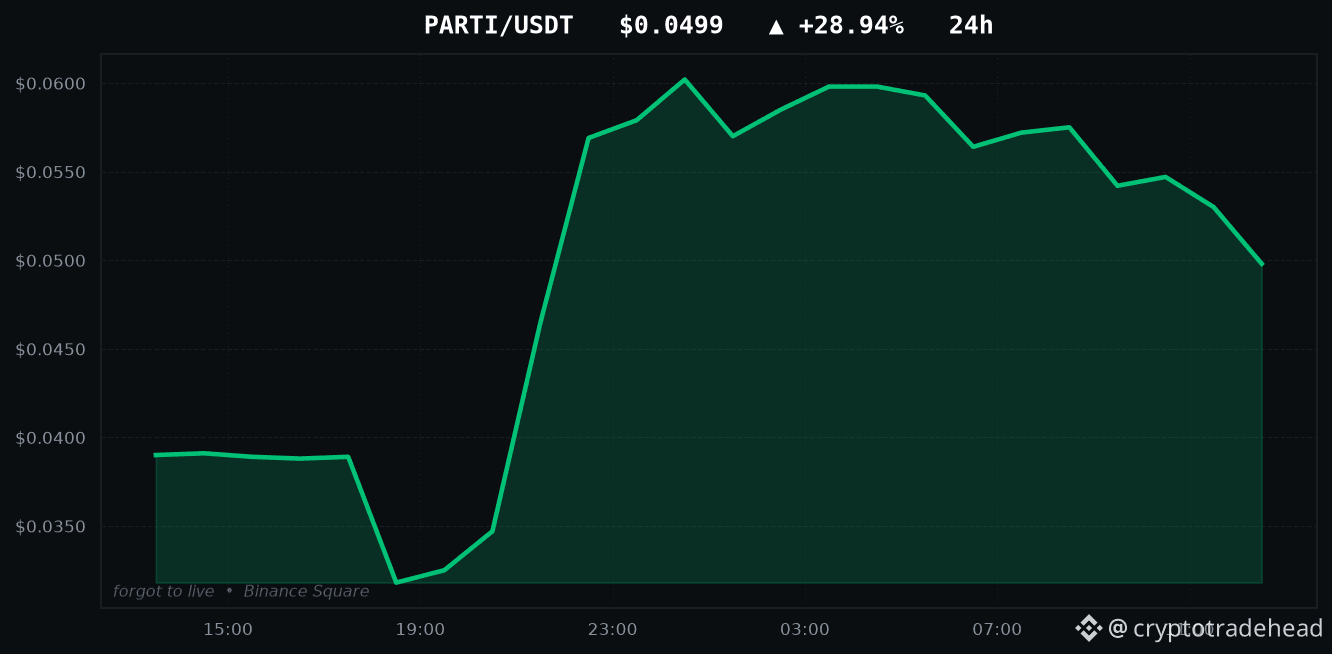
PARTI sube un +28.94%: probé las dos formas de operar este movimientoMAYORES SUBIDAS DE HOY
PARTI: +28.94%
BEAMX: +24.05%
SOPH: +20.28%
HYPE: +16.49%
ALPINE: +13.61%
Todas las cuentas de esta app te mostrarán esta lista. Aquí está la parte que omiten.
Hice pruebas retrospectivas de las dos formas de operar un movimiento como el +28.94% de PARTI: comprar la ruptura y apostar en su contra suponiendo que revierte. Ambas dieron pérdidas. Y no por poco: perdieron aproximadamente lo que cuesta la transacción, un 0.240% por operación de ida y vuelta, que es lo que ocurre con una señal sin información cuando se le aplican comisiones.
Un gran movimiento en 24 horas te dice que algo ya pasó. No te dice qué pasará después, y los datos lo demuestran en ambos sentidos.
PARTI sube un +28.94%: probé las dos formas de operar este movimiento
MAYORES SUBIDAS DE HOY
PARTI: +28.94%
BEAMX: +24.05%
SOPH: +20.28%
HYPE: +16.49%
ALPINE: +13.61%
Todas las cuentas de esta app te mostrarán esta lista. Aquí está la parte que omiten.
Hice pruebas retrospectivas de las dos formas de operar un movimiento como el +28.94% de PARTI: comprar la ruptura y apostar en su contra suponiendo que revierte. Ambas dieron pérdidas. Y no por poco: perdieron aproximadamente lo que cuesta la transacción, un 0.240% por operación de ida y vuelta, que es lo que ocurre con una señal sin información cuando se le aplican comisiones.
Un gran movimiento en 24 horas te dice que algo ya pasó. No te dice qué pasará después, y los datos lo demuestran en ambos sentidos.
PARTI: +28.94%
BEAMX: +24.05%
SOPH: +20.28%
HYPE: +16.49%
ALPINE: +13.61%
Todas las cuentas de esta app te mostrarán esta lista. Aquí está la parte que omiten.
Hice pruebas retrospectivas de las dos formas de operar un movimiento como el +28.94% de PARTI: comprar la ruptura y apostar en su contra suponiendo que revierte. Ambas dieron pérdidas. Y no por poco: perdieron aproximadamente lo que cuesta la transacción, un 0.240% por operación de ida y vuelta, que es lo que ocurre con una señal sin información cuando se le aplican comisiones.
Un gran movimiento en 24 horas te dice que algo ya pasó. No te dice qué pasará después, y los datos lo demuestran en ambos sentidos.
12
Ver traducción
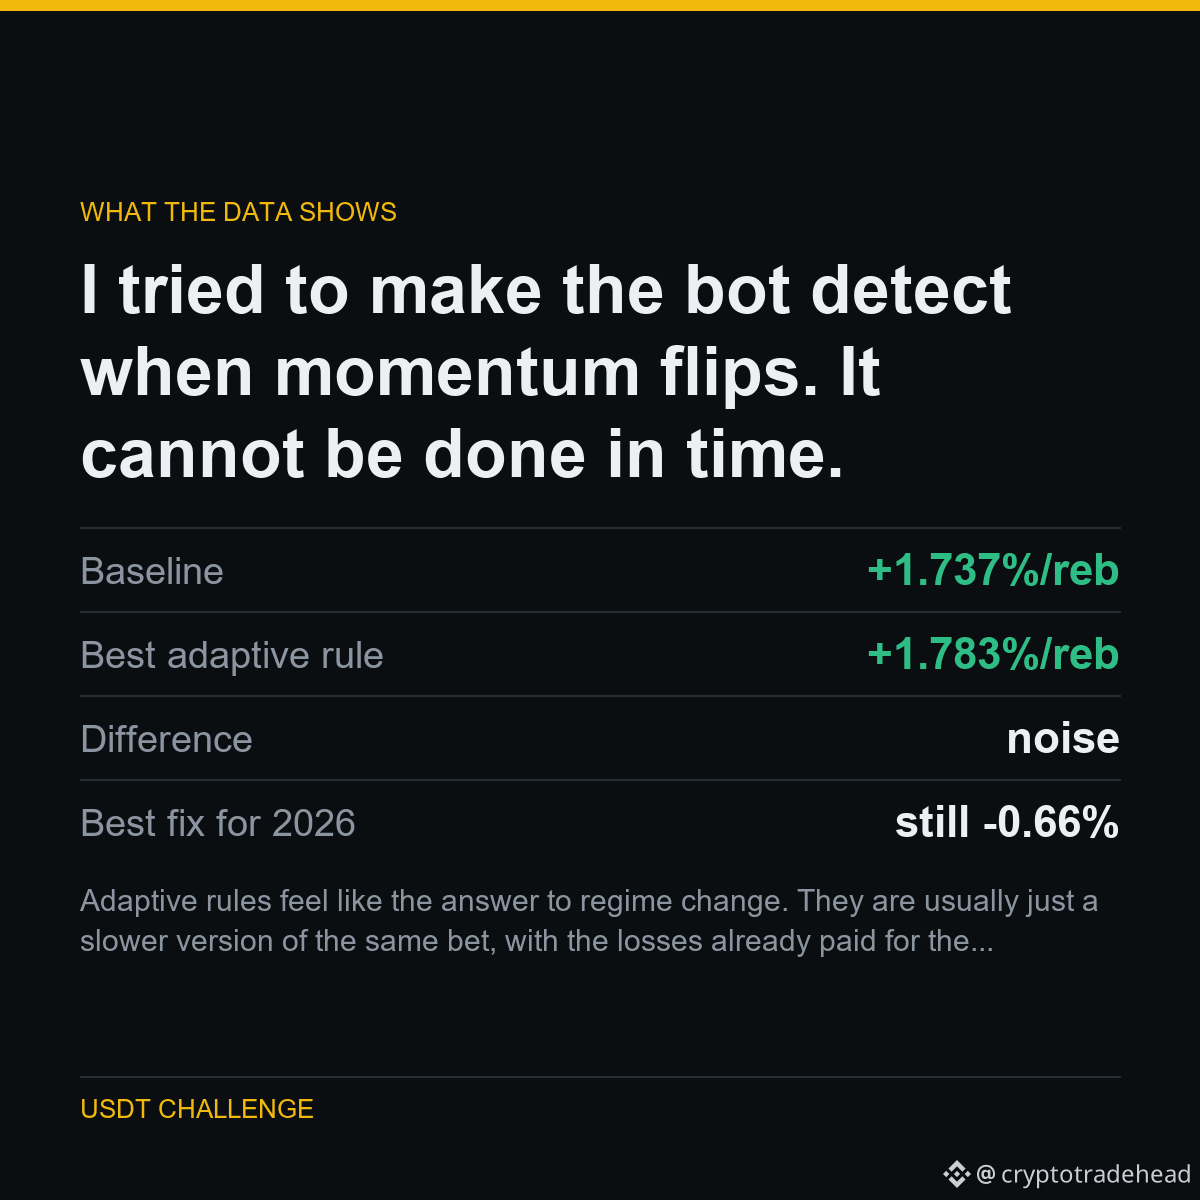
HOW I TESTED IT
Momentum inverted in 2026. The obvious fix: watch recent performance, and flip to the opposite rule when momentum stops paying.
I tested that over six different lookback windows. The best one returned +1.783% per rebalance against a +1.737% baseline - a difference indistinguishable from noise. Every other window was worse. None repaired 2026.
The reason is simple: by the time trailing performance tells you the regime flipped, you have already taken the losses that told you.
THE NUMBERS
Baseline: +1.737%/reb
Best adaptive rule: +1.783%/reb
Difference: noise
Best fix for 2026: still -0.66%
Adaptive rules feel like the answer to regime change. They are usually just a slower version of the same bet, with the losses already paid for the signal.
Part of a public experiment: 5,063 USDT to 1,000,000 USDT, every result published - including the ones that make me look bad.
Run on $SOL $BTC
#Binance #Futures #Backtesting #TradingBot #CryptoData
HOW I TESTED IT
Momentum inverted in 2026. The obvious fix: watch recent performance, and flip to the opposite rule when momentum stops paying.
I tested that over six different lookback windows. The best one returned +1.783% per rebalance against a +1.737% baseline - a difference indistinguishable from noise. Every other window was worse. None repaired 2026.
The reason is simple: by the time trailing performance tells you the regime flipped, you have already taken the losses that told you.
THE NUMBERS
Baseline: +1.737%/reb
Best adaptive rule: +1.783%/reb
Difference: noise
Best fix for 2026: still -0.66%
Adaptive rules feel like the answer to regime change. They are usually just a slower version of the same bet, with the losses already paid for the signal.
Part of a public experiment: 5,063 USDT to 1,000,000 USDT, every result published - including the ones that make me look bad.
Run on $SOL $BTC
#Binance #Futures #Backtesting #TradingBot #CryptoData
Momentum inverted in 2026. The obvious fix: watch recent performance, and flip to the opposite rule when momentum stops paying.
I tested that over six different lookback windows. The best one returned +1.783% per rebalance against a +1.737% baseline - a difference indistinguishable from noise. Every other window was worse. None repaired 2026.
The reason is simple: by the time trailing performance tells you the regime flipped, you have already taken the losses that told you.
THE NUMBERS
Baseline: +1.737%/reb
Best adaptive rule: +1.783%/reb
Difference: noise
Best fix for 2026: still -0.66%
Adaptive rules feel like the answer to regime change. They are usually just a slower version of the same bet, with the losses already paid for the signal.
Part of a public experiment: 5,063 USDT to 1,000,000 USDT, every result published - including the ones that make me look bad.
Run on $SOL $BTC
#Binance #Futures #Backtesting #TradingBot #CryptoData
9
Ver traducción
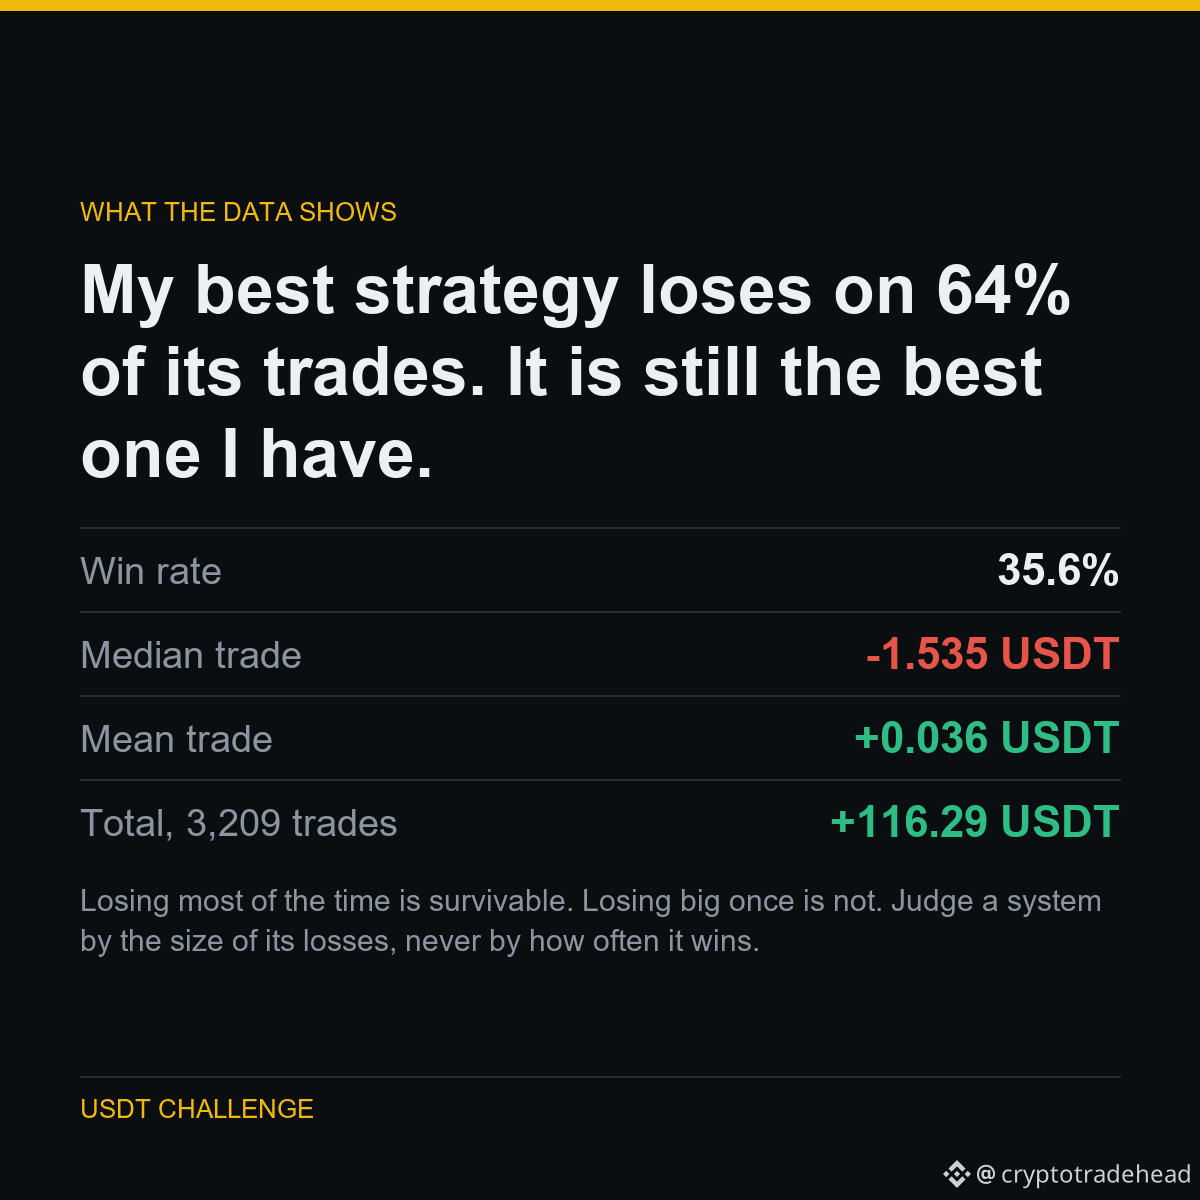
Losing most of the time is survivable. Losing big once is not. Judge a system by the size of its losses, never by how often it wins.
Here is what that came from.
My best strategy loses on 64% of its trades. It is still the best one I have.
The typical trade in this system loses 1.535 USDT. Nearly two out of three trades are losers.
It is profitable anyway, because the winners are much larger than the losers. The mean trade is positive while the median is clearly negative.
It is also the opposite shape to the martingale I tested, which won 96% of the time and still lost 519.83 USDT.
Part of a public experiment: 5,063 USDT to 1,000,000 USDT, every result published - including the ones that make me look bad.
Run on $BTC $XRP $LTC
#Binance #Futures #Backtesting #TradingBot #CryptoData
Losing most of the time is survivable. Losing big once is not. Judge a system by the size of its losses, never by how often it wins.
Here is what that came from.
My best strategy loses on 64% of its trades. It is still the best one I have.
The typical trade in this system loses 1.535 USDT. Nearly two out of three trades are losers.
It is profitable anyway, because the winners are much larger than the losers. The mean trade is positive while the median is clearly negative.
It is also the opposite shape to the martingale I tested, which won 96% of the time and still lost 519.83 USDT.
Part of a public experiment: 5,063 USDT to 1,000,000 USDT, every result published - including the ones that make me look bad.
Run on $BTC $XRP $LTC
#Binance #Futures #Backtesting #TradingBot #CryptoData
Here is what that came from.
My best strategy loses on 64% of its trades. It is still the best one I have.
The typical trade in this system loses 1.535 USDT. Nearly two out of three trades are losers.
It is profitable anyway, because the winners are much larger than the losers. The mean trade is positive while the median is clearly negative.
It is also the opposite shape to the martingale I tested, which won 96% of the time and still lost 519.83 USDT.
Part of a public experiment: 5,063 USDT to 1,000,000 USDT, every result published - including the ones that make me look bad.
Run on $BTC $XRP $LTC
#Binance #Futures #Backtesting #TradingBot #CryptoData
12
Artículo
Ver traducción
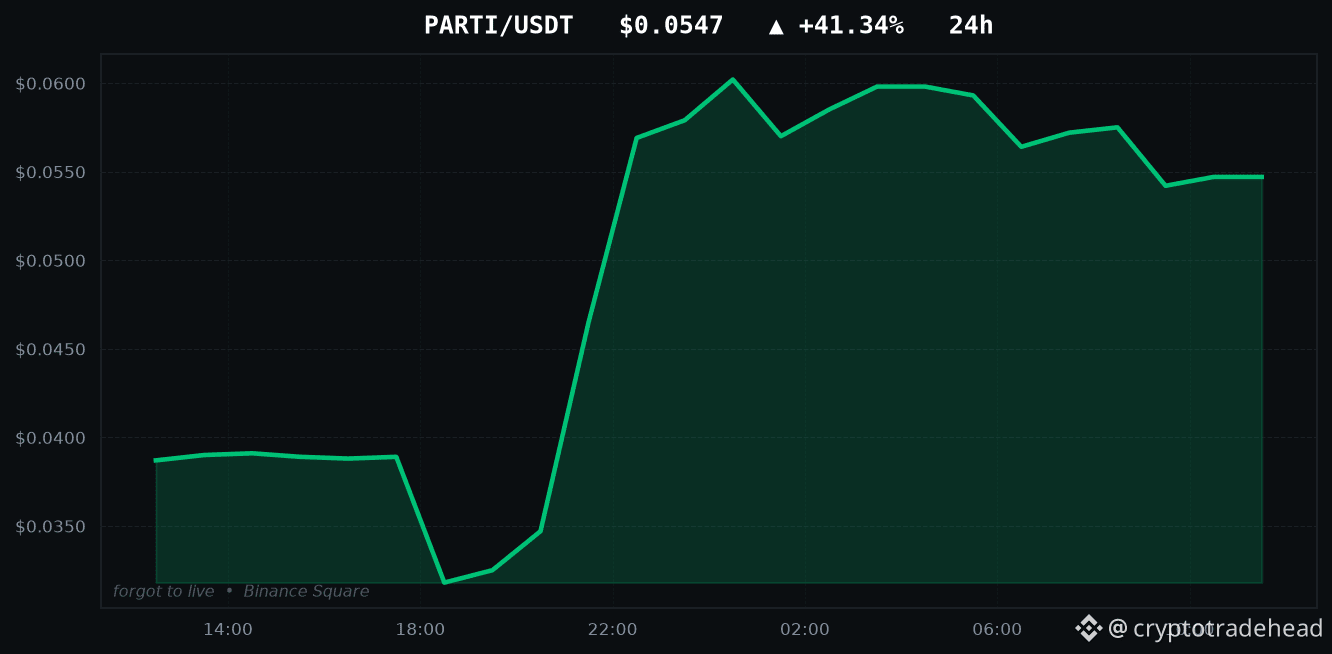
PARTI is up +41.34% - I tested both ways to trade itTODAY'S TOP GAINERS
PARTI: +41.34%
SOPH: +20.83%
BEAMX: +20.45%
HYPE: +18.14%
RUNE: +12.69%
Every account on this app will show you this list. Here is the part they skip.
I backtested both ways of trading a move like PARTI's +41.34%: buying the breakout, and fading it on the assumption it reverts. Both lost money. Not narrowly - they lost roughly the transaction cost, 0.240% per round trip, which is what a signal carrying no information looks like once you charge it fees.
A large 24-hour move tells you something already happened. It does not tell you what happens next, and the data says so in both directions.
Part of a public experiment: every strategy I test gets published, working or not.
Movers above: $PARTI $SOPH $BEAMX
#Binance #Altcoins #Futures #PARTI #CryptoData
PARTI is up +41.34% - I tested both ways to trade it
TODAY'S TOP GAINERS
PARTI: +41.34%
SOPH: +20.83%
BEAMX: +20.45%
HYPE: +18.14%
RUNE: +12.69%
Every account on this app will show you this list. Here is the part they skip.
I backtested both ways of trading a move like PARTI's +41.34%: buying the breakout, and fading it on the assumption it reverts. Both lost money. Not narrowly - they lost roughly the transaction cost, 0.240% per round trip, which is what a signal carrying no information looks like once you charge it fees.
A large 24-hour move tells you something already happened. It does not tell you what happens next, and the data says so in both directions.
Part of a public experiment: every strategy I test gets published, working or not.
Movers above: $PARTI $SOPH $BEAMX
#Binance #Altcoins #Futures #PARTI #CryptoData
PARTI: +41.34%
SOPH: +20.83%
BEAMX: +20.45%
HYPE: +18.14%
RUNE: +12.69%
Every account on this app will show you this list. Here is the part they skip.
I backtested both ways of trading a move like PARTI's +41.34%: buying the breakout, and fading it on the assumption it reverts. Both lost money. Not narrowly - they lost roughly the transaction cost, 0.240% per round trip, which is what a signal carrying no information looks like once you charge it fees.
A large 24-hour move tells you something already happened. It does not tell you what happens next, and the data says so in both directions.
Part of a public experiment: every strategy I test gets published, working or not.
Movers above: $PARTI $SOPH $BEAMX
#Binance #Altcoins #Futures #PARTI #CryptoData
6
Ver traducción
After 378 failures, one strategy finally passed the test that killed all the others.
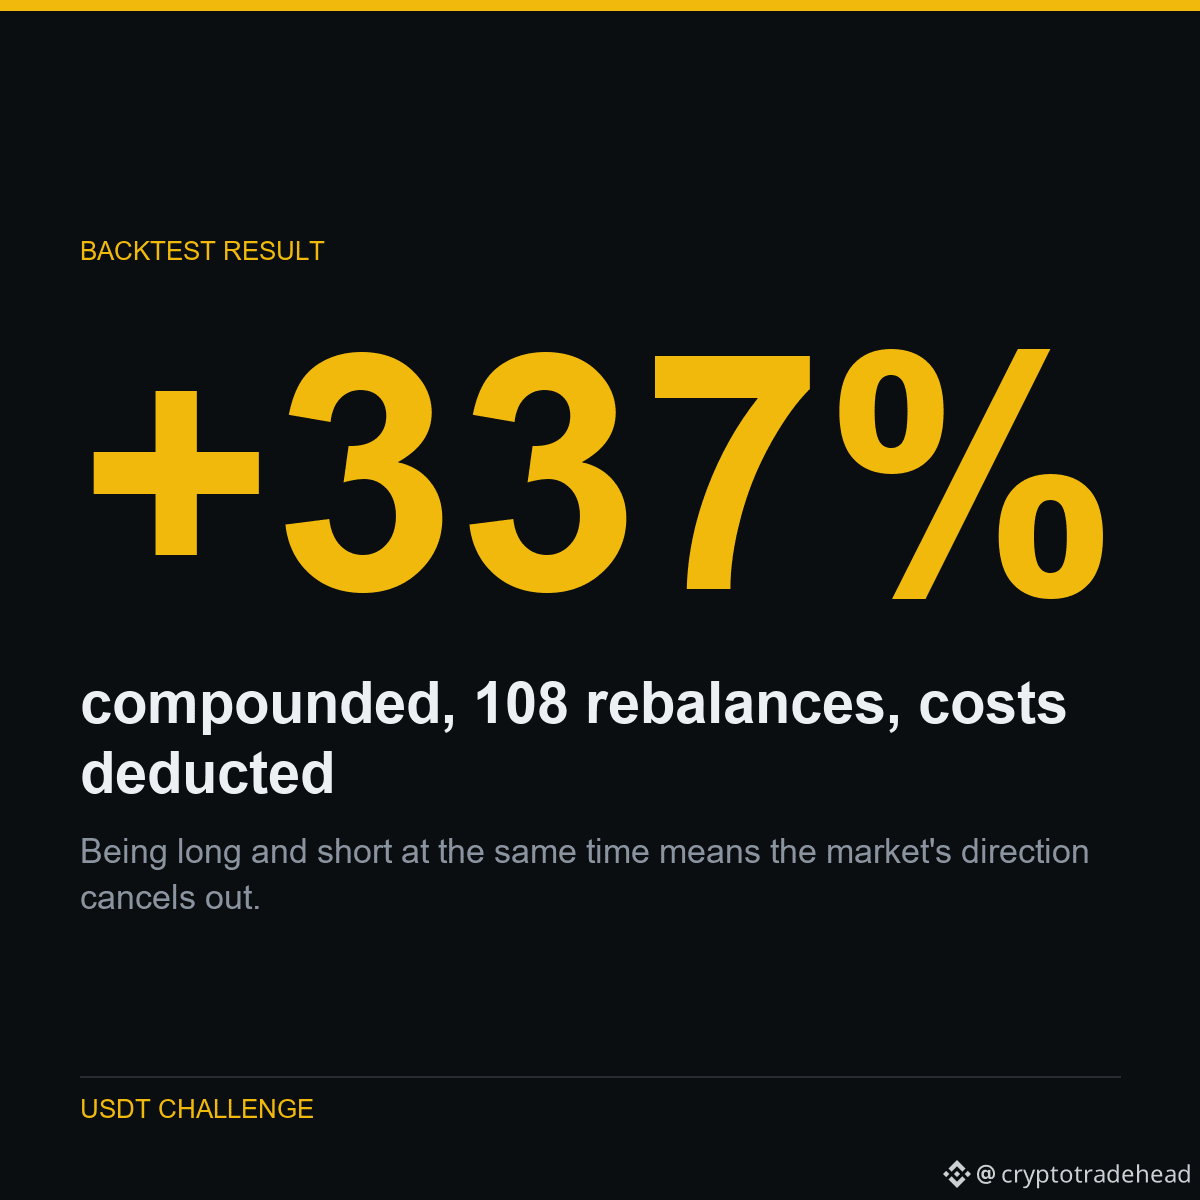
Rank 45 perpetuals by 5-day return. Long the top 5, short the bottom 5, hold 15 days, rebalance. Equal weight, dollar-neutral.
The out-of-sample control is the one that had destroyed everything before it: fix the settings on old data, then run them on data the search never touched. In-sample +1.711% per rebalance, out-of-sample +1.801%. The mean held.
It also survives costs far worse than real: still +0.48% per rebalance even at a 1.50% round trip, six times what Binance actually charges.
WHAT IT MEANS
Being long and short at the same time means the market's direction cancels out. What is left is whether the winners keep beating the losers - which is a real question, not a bet on the market going up.
Part of a public experiment: 5,063 USDT to...
After 378 failures, one strategy finally passed the test that killed all the others.
Rank 45 perpetuals by 5-day return. Long the top 5, short the bottom 5, hold 15 days, rebalance. Equal weight, dollar-neutral.
The out-of-sample control is the one that had destroyed everything before it: fix the settings on old data, then run them on data the search never touched. In-sample +1.711% per rebalance, out-of-sample +1.801%. The mean held.
It also survives costs far worse than real: still +0.48% per rebalance even at a 1.50% round trip, six times what Binance actually charges.
WHAT IT MEANS
Being long and short at the same time means the market's direction cancels out. What is left is whether the winners keep beating the losers - which is a real question, not a bet on the market going up.
Part of a public experiment: 5,063 USDT to...
Rank 45 perpetuals by 5-day return. Long the top 5, short the bottom 5, hold 15 days, rebalance. Equal weight, dollar-neutral.
The out-of-sample control is the one that had destroyed everything before it: fix the settings on old data, then run them on data the search never touched. In-sample +1.711% per rebalance, out-of-sample +1.801%. The mean held.
It also survives costs far worse than real: still +0.48% per rebalance even at a 1.50% round trip, six times what Binance actually charges.
WHAT IT MEANS
Being long and short at the same time means the market's direction cancels out. What is left is whether the winners keep beating the losers - which is a real question, not a bet on the market going up.
Part of a public experiment: 5,063 USDT to...
37
Artículo
Ver traducción
Funding rate predicts where price goes. It just changes which direction, by year.Funding rate predicts where price goes. It just changes which direction, by year.
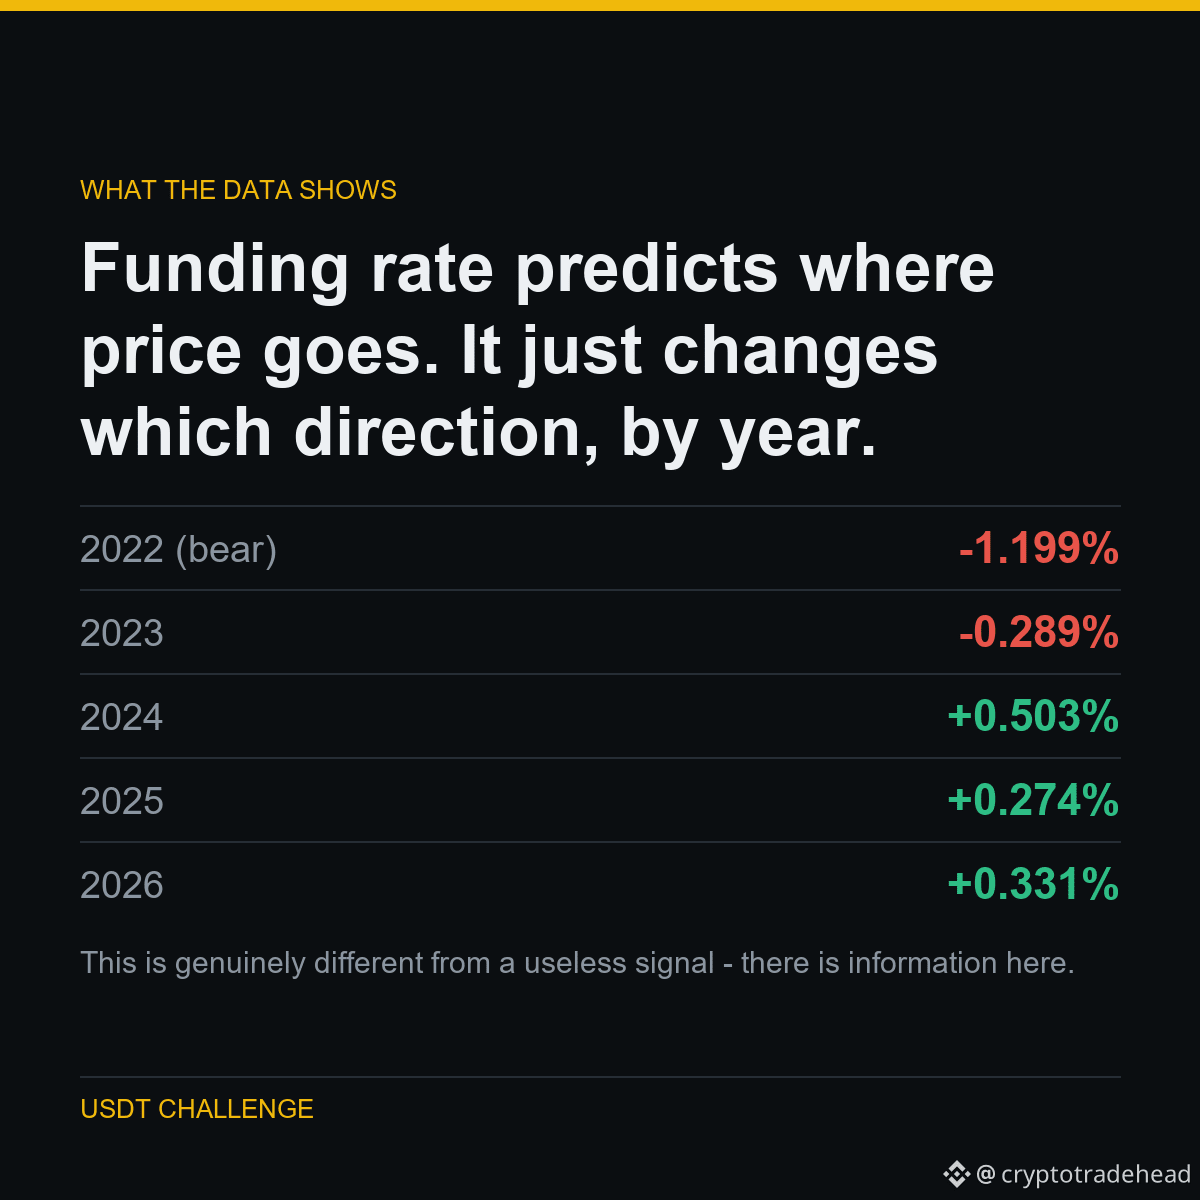
I sorted every funding print into quintiles and measured the forward 72-hour return of the highest versus the lowest.
In bear markets, high funding preceded WORSE returns - crowded longs getting squeezed. From 2024 onward it preceded BETTER returns - momentum.
The signal is real. The sign is not stable. Average it across all years and you get -0.08%, below the 0.240% it costs to trade.
WHAT IT MEANS
This is genuinely different from a useless signal - there is information here. But to use it you would need to know the regime in advance, which is the same circular problem that kills everything else.
Part of a public experiment: 5,063 USDT to 1,000,000 USDT, every result published - including the ones that make me look bad.
Run on $BTC $ETH $DOGE
#Binance #Futures #Backtesting #TradingBot #CryptoData
Funding rate predicts where price goes. It just changes which direction, by year.
Funding rate predicts where price goes. It just changes which direction, by year.
I sorted every funding print into quintiles and measured the forward 72-hour return of the highest versus the lowest.
In bear markets, high funding preceded WORSE returns - crowded longs getting squeezed. From 2024 onward it preceded BETTER returns - momentum.
The signal is real. The sign is not stable. Average it across all years and you get -0.08%, below the 0.240% it costs to trade.
WHAT IT MEANS
This is genuinely different from a useless signal - there is information here. But to use it you would need to know the regime in advance, which is the same circular problem that kills everything else.
Part of a public experiment: 5,063 USDT to 1,000,000 USDT, every result published - including the ones that make me look bad.
Run on $BTC $ETH $DOGE
#Binance #Futures #Backtesting #TradingBot #CryptoData
I sorted every funding print into quintiles and measured the forward 72-hour return of the highest versus the lowest.
In bear markets, high funding preceded WORSE returns - crowded longs getting squeezed. From 2024 onward it preceded BETTER returns - momentum.
The signal is real. The sign is not stable. Average it across all years and you get -0.08%, below the 0.240% it costs to trade.
WHAT IT MEANS
This is genuinely different from a useless signal - there is information here. But to use it you would need to know the regime in advance, which is the same circular problem that kills everything else.
Part of a public experiment: 5,063 USDT to 1,000,000 USDT, every result published - including the ones that make me look bad.
Run on $BTC $ETH $DOGE
#Binance #Futures #Backtesting #TradingBot #CryptoData
4
Artículo
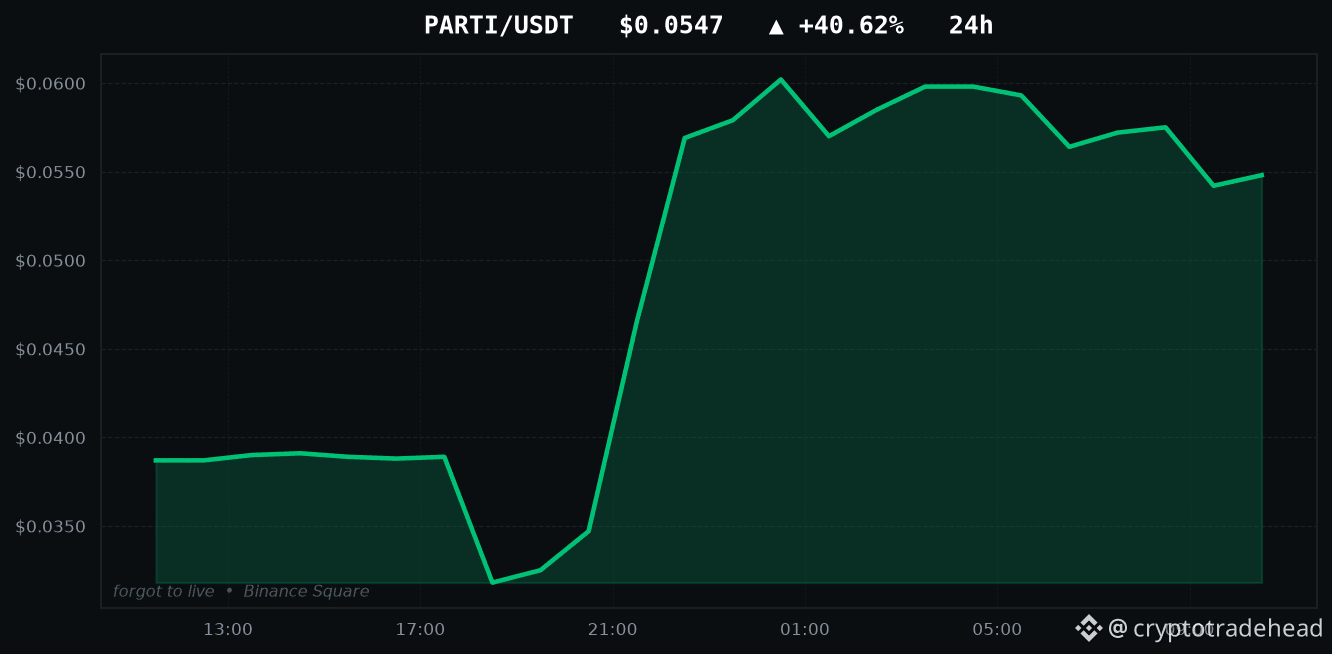
PARTI sube un +40.62%: probé ambas formas de operarLOS MAYORES GANADORES DE HOY
PARTI: +40.62%
SOPH: +18.37%
HYPE: +17.59%
RUNE: +14.54%
SOXSB: +13.66%
Todas las cuentas de esta aplicación te mostrarán esta lista. Aquí está la parte que omiten.
Probé ambas formas de operar un movimiento como el +40.62% de PARTI: comprar la ruptura y apostar en contra suponiendo que se revierte. Ambas dieron pérdidas. No por poco: perdieron aproximadamente lo que cuesta la transacción, un 0.240% por operación completa, que es lo que parece una señal sin información cuando se le aplican comisiones.
Un gran movimiento en 24 horas te indica que algo ya ocurrió. No te dice qué pasará después, y los datos lo confirman en ambos sentidos.
PARTI sube un +40.62%: probé ambas formas de operar
LOS MAYORES GANADORES DE HOY
PARTI: +40.62%
SOPH: +18.37%
HYPE: +17.59%
RUNE: +14.54%
SOXSB: +13.66%
Todas las cuentas de esta aplicación te mostrarán esta lista. Aquí está la parte que omiten.
Probé ambas formas de operar un movimiento como el +40.62% de PARTI: comprar la ruptura y apostar en contra suponiendo que se revierte. Ambas dieron pérdidas. No por poco: perdieron aproximadamente lo que cuesta la transacción, un 0.240% por operación completa, que es lo que parece una señal sin información cuando se le aplican comisiones.
Un gran movimiento en 24 horas te indica que algo ya ocurrió. No te dice qué pasará después, y los datos lo confirman en ambos sentidos.
PARTI: +40.62%
SOPH: +18.37%
HYPE: +17.59%
RUNE: +14.54%
SOXSB: +13.66%
Todas las cuentas de esta aplicación te mostrarán esta lista. Aquí está la parte que omiten.
Probé ambas formas de operar un movimiento como el +40.62% de PARTI: comprar la ruptura y apostar en contra suponiendo que se revierte. Ambas dieron pérdidas. No por poco: perdieron aproximadamente lo que cuesta la transacción, un 0.240% por operación completa, que es lo que parece una señal sin información cuando se le aplican comisiones.
Un gran movimiento en 24 horas te indica que algo ya ocurrió. No te dice qué pasará después, y los datos lo confirman en ambos sentidos.
4
CÓMO LO PROBÉ
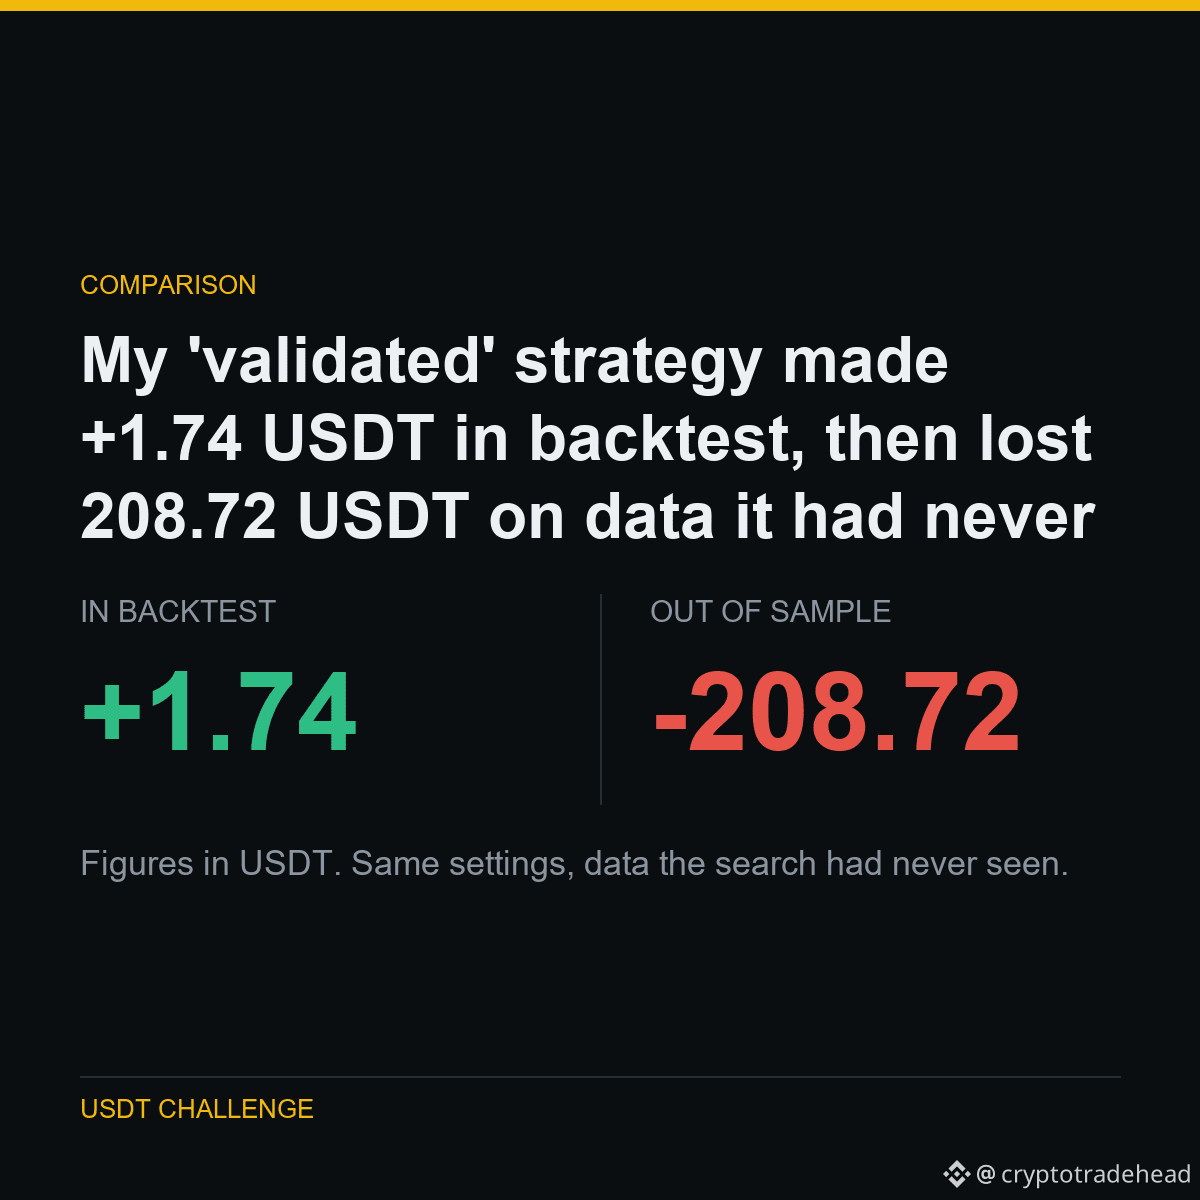
Analicé 40 símbolos y encontré tres que parecían rentables. Los consideré validados y los puse en marcha.
Después probé exactamente los mismos ajustes con 751 días de historial de precios que la búsqueda nunca había tocado. Los tres se dieron la vuelta. No un poco: por completo.
Que sobrevivan tres de 40 es más o menos lo que produce el puro azar con un tamaño de muestra así.
LAS CIFRAS
Resultado dentro de la muestra: +1.74
Resultado fuera de la muestra: -208.72
Días de datos sin tocar: 751
Símbolos que sobrevivieron: 0 de 3
Si buscas lo suficiente entre datos aleatorios, siempre encontrarás un ganador. La prueba fuera de la muestra es lo único que te dice si encontraste una ventaja o simplemente encontraste ruido disfrazado.
Parte de un experimento público: de 5,063 USDT a 1,000,000 USDT; publico todos los resultados, incluidos los que me dejan mal.
Ejecutado en $BTC $ETH $BNB
#Binance #Futures #Backtesting #TradingBot #DatosCripto
CÓMO LO PROBÉ
Analicé 40 símbolos y encontré tres que parecían rentables. Los consideré validados y los puse en marcha.
Después probé exactamente los mismos ajustes con 751 días de historial de precios que la búsqueda nunca había tocado. Los tres se dieron la vuelta. No un poco: por completo.
Que sobrevivan tres de 40 es más o menos lo que produce el puro azar con un tamaño de muestra así.
LAS CIFRAS
Resultado dentro de la muestra: +1.74
Resultado fuera de la muestra: -208.72
Días de datos sin tocar: 751
Símbolos que sobrevivieron: 0 de 3
Si buscas lo suficiente entre datos aleatorios, siempre encontrarás un ganador. La prueba fuera de la muestra es lo único que te dice si encontraste una ventaja o simplemente encontraste ruido disfrazado.
Parte de un experimento público: de 5,063 USDT a 1,000,000 USDT; publico todos los resultados, incluidos los que me dejan mal.
Ejecutado en $BTC $ETH $BNB
#Binance #Futures #Backtesting #TradingBot #DatosCripto
Analicé 40 símbolos y encontré tres que parecían rentables. Los consideré validados y los puse en marcha.
Después probé exactamente los mismos ajustes con 751 días de historial de precios que la búsqueda nunca había tocado. Los tres se dieron la vuelta. No un poco: por completo.
Que sobrevivan tres de 40 es más o menos lo que produce el puro azar con un tamaño de muestra así.
LAS CIFRAS
Resultado dentro de la muestra: +1.74
Resultado fuera de la muestra: -208.72
Días de datos sin tocar: 751
Símbolos que sobrevivieron: 0 de 3
Si buscas lo suficiente entre datos aleatorios, siempre encontrarás un ganador. La prueba fuera de la muestra es lo único que te dice si encontraste una ventaja o simplemente encontraste ruido disfrazado.
Parte de un experimento público: de 5,063 USDT a 1,000,000 USDT; publico todos los resultados, incluidos los que me dejan mal.
Ejecutado en $BTC $ETH $BNB
#Binance #Futures #Backtesting #TradingBot #DatosCripto
10
Ver traducción
HOW I TESTED IT
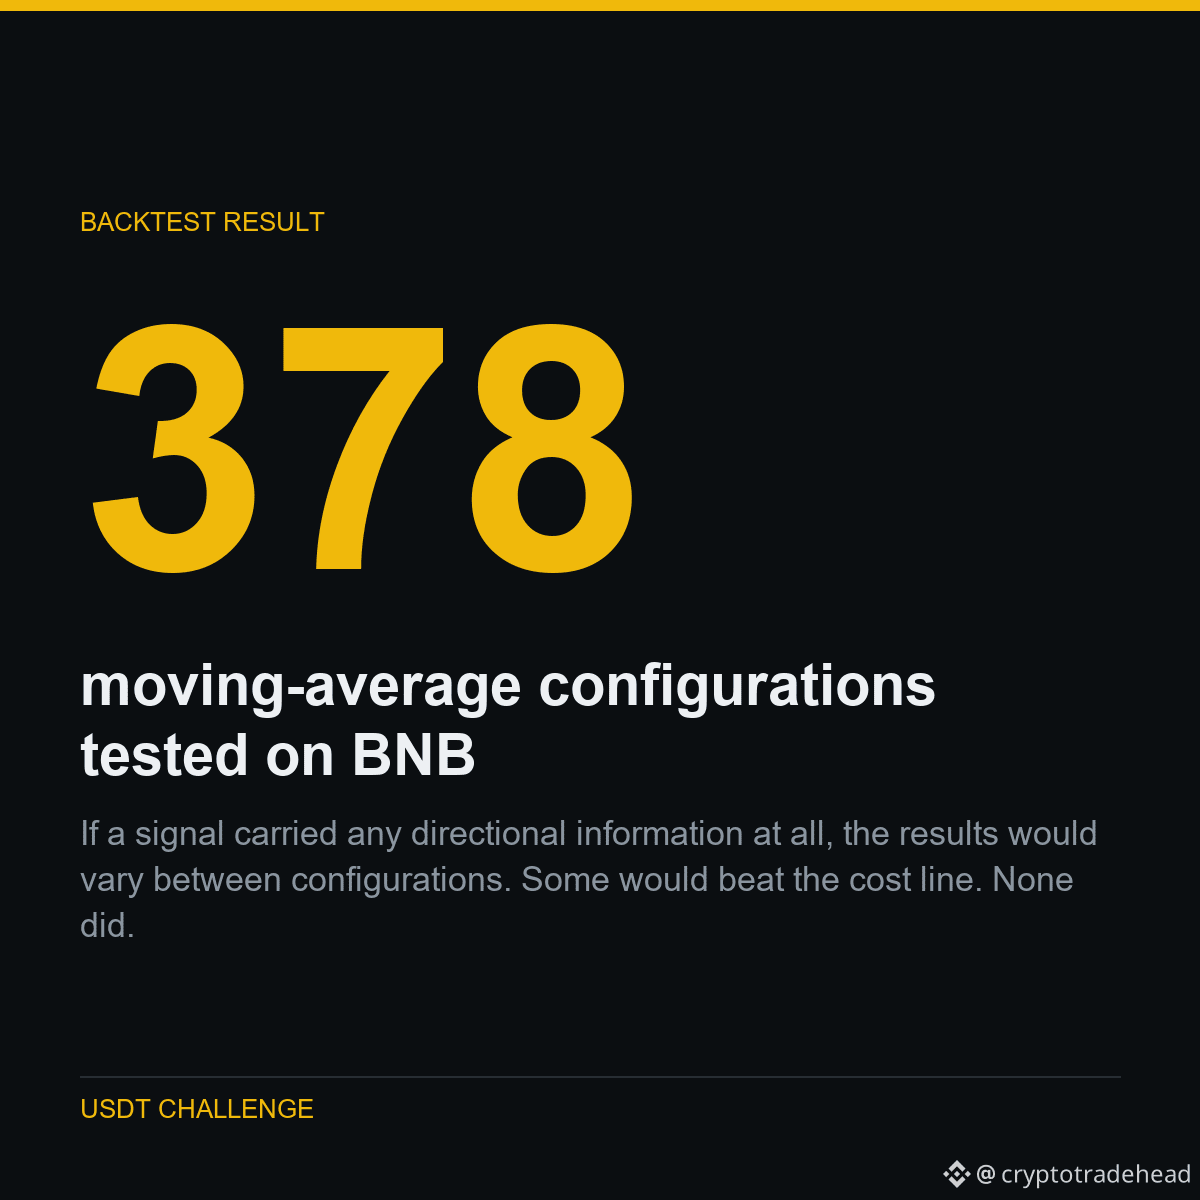
Two signal families, four timeframes, EMA and SMA, with and without a trend filter, long-only and short-only. 378 combinations in total, all with real fees and real measured slippage applied.
The round-trip cost of a trade is 0.240% of position size. The average result per trade, across every single configuration, landed between -0.361% and -0.401%.
That is the cost, and nothing else.
THE NUMBERS
Round-trip cost: 0.240%
Avg result, 15m setups: -0.361%
Avg result, 1h setups: -0.401%
Configurations profitable: 0 of 378
If a signal carried any directional information at all, the results would vary between configurations. Some would beat the cost line. None did. That is not weak edge that needs tuning - it is zero edge being charged an entry fee.
Part of a public experiment: 5,063 USDT to 1,000,000 USDT, every result published - including the ones that make me look bad.
Run on $BNB
#Binance #Futures #Backtesting #TradingBot #CryptoData
HOW I TESTED IT
Two signal families, four timeframes, EMA and SMA, with and without a trend filter, long-only and short-only. 378 combinations in total, all with real fees and real measured slippage applied.
The round-trip cost of a trade is 0.240% of position size. The average result per trade, across every single configuration, landed between -0.361% and -0.401%.
That is the cost, and nothing else.
THE NUMBERS
Round-trip cost: 0.240%
Avg result, 15m setups: -0.361%
Avg result, 1h setups: -0.401%
Configurations profitable: 0 of 378
If a signal carried any directional information at all, the results would vary between configurations. Some would beat the cost line. None did. That is not weak edge that needs tuning - it is zero edge being charged an entry fee.
Part of a public experiment: 5,063 USDT to 1,000,000 USDT, every result published - including the ones that make me look bad.
Run on $BNB
#Binance #Futures #Backtesting #TradingBot #CryptoData
Two signal families, four timeframes, EMA and SMA, with and without a trend filter, long-only and short-only. 378 combinations in total, all with real fees and real measured slippage applied.
The round-trip cost of a trade is 0.240% of position size. The average result per trade, across every single configuration, landed between -0.361% and -0.401%.
That is the cost, and nothing else.
THE NUMBERS
Round-trip cost: 0.240%
Avg result, 15m setups: -0.361%
Avg result, 1h setups: -0.401%
Configurations profitable: 0 of 378
If a signal carried any directional information at all, the results would vary between configurations. Some would beat the cost line. None did. That is not weak edge that needs tuning - it is zero edge being charged an entry fee.
Part of a public experiment: 5,063 USDT to 1,000,000 USDT, every result published - including the ones that make me look bad.
Run on $BNB
#Binance #Futures #Backtesting #TradingBot #CryptoData
8
Artículo
Ver traducción
PARTI is up +44.07% - I tested both ways to trade itTODAY'S TOP GAINERS
PARTI: +44.07%
HYPE: +16.88%
RUNE: +11.35%
SOXSB: +11.25%
LSK: +7.72%
Every account on this app will show you this list. Here is the part they skip.
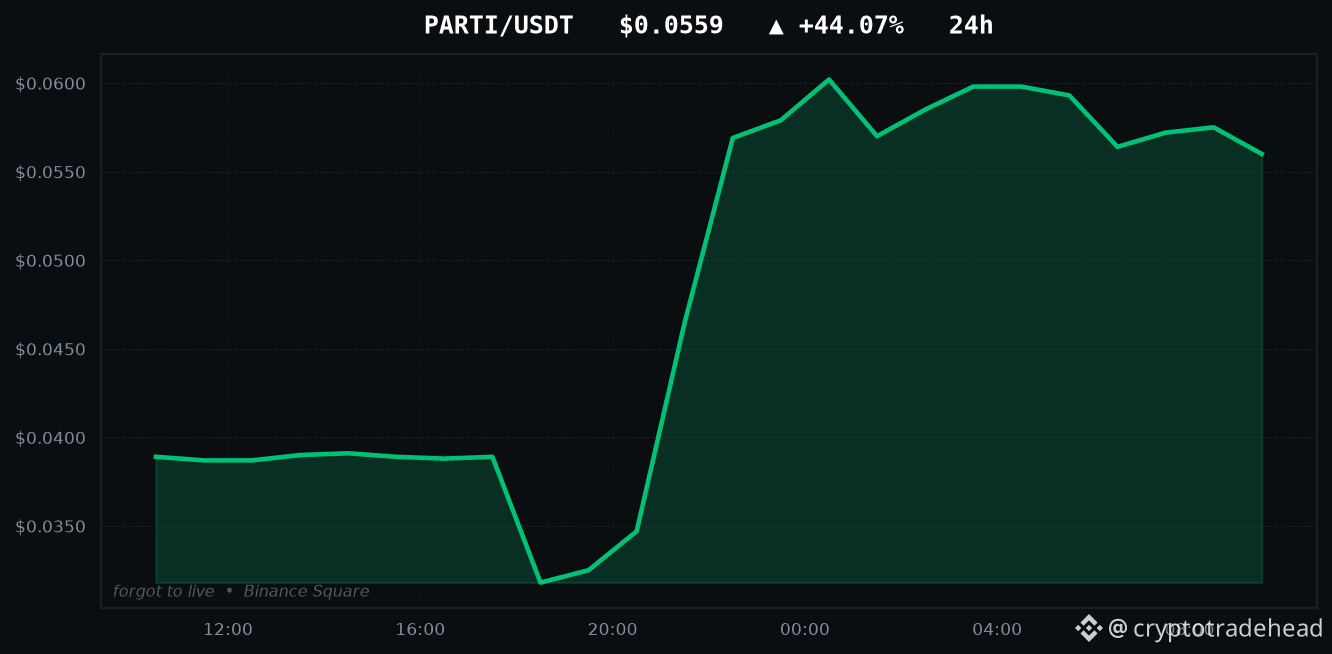
I backtested both ways of trading a move like PARTI's +44.07%: buying the breakout, and fading it on the assumption it reverts. Both lost money. Not narrowly - they lost roughly the transaction cost, 0.240% per round trip, which is what a signal carrying no information looks like once you charge it fees.
A large 24-hour move tells you something already happened. It does not tell you what happens next, and the data says so in both directions.
Part of a public experiment: every strategy I test gets published, working or not.
Movers above: $PARTI $HYPE $RUNE
#Binance #Altcoins #Futures #PARTI #CryptoData
PARTI is up +44.07% - I tested both ways to trade it
TODAY'S TOP GAINERS
PARTI: +44.07%
HYPE: +16.88%
RUNE: +11.35%
SOXSB: +11.25%
LSK: +7.72%
Every account on this app will show you this list. Here is the part they skip.
I backtested both ways of trading a move like PARTI's +44.07%: buying the breakout, and fading it on the assumption it reverts. Both lost money. Not narrowly - they lost roughly the transaction cost, 0.240% per round trip, which is what a signal carrying no information looks like once you charge it fees.
A large 24-hour move tells you something already happened. It does not tell you what happens next, and the data says so in both directions.
Part of a public experiment: every strategy I test gets published, working or not.
Movers above: $PARTI $HYPE $RUNE
#Binance #Altcoins #Futures #PARTI #CryptoData
PARTI: +44.07%
HYPE: +16.88%
RUNE: +11.35%
SOXSB: +11.25%
LSK: +7.72%
Every account on this app will show you this list. Here is the part they skip.
I backtested both ways of trading a move like PARTI's +44.07%: buying the breakout, and fading it on the assumption it reverts. Both lost money. Not narrowly - they lost roughly the transaction cost, 0.240% per round trip, which is what a signal carrying no information looks like once you charge it fees.
A large 24-hour move tells you something already happened. It does not tell you what happens next, and the data says so in both directions.
Part of a public experiment: every strategy I test gets published, working or not.
Movers above: $PARTI $HYPE $RUNE
#Binance #Altcoins #Futures #PARTI #CryptoData
6
Ver traducción
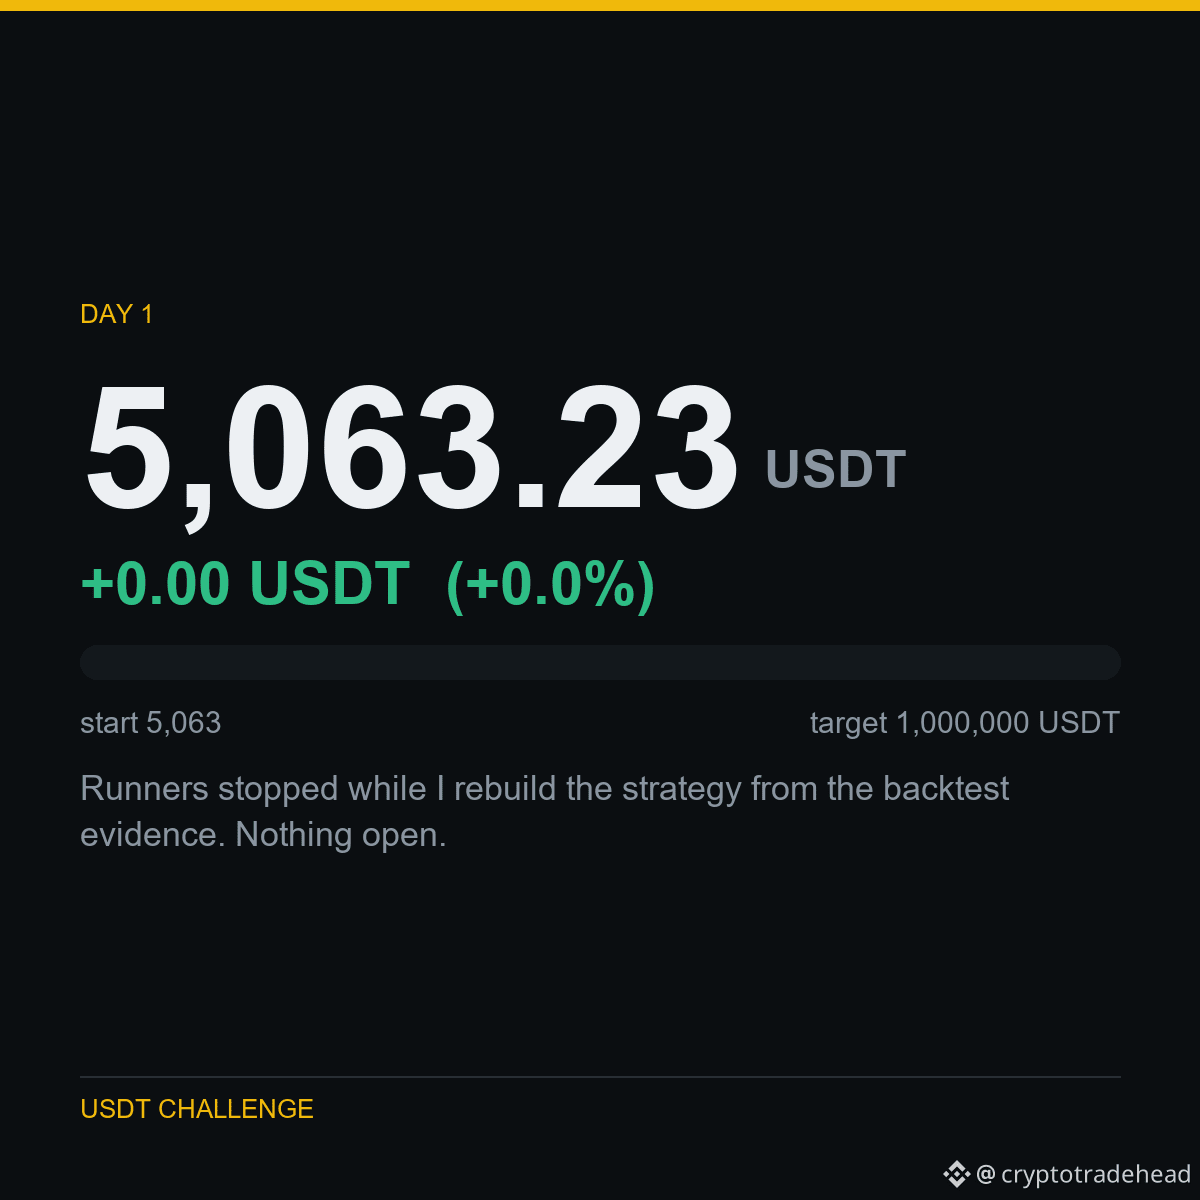
DAY 1 - 5,063 USDT to 1,000,000 USDT
Balance: 5,063.23 USDT
Change: +0.00 USDT (+0.0%)
Runners stopped while I rebuild the strategy from the backtest evidence. Nothing open.
Running on a Binance testnet account, so this is demo capital - I would rather say that than let you assume otherwise. The strategy, the costs and the losses are all real.
No signals for sale, no course, no affiliate link. Just the account and the data behind it.
Traded in this challenge: $BTC $SOL $AVAX
#Binance #USDT #Futures #TradingChallenge #Crypto
DAY 1 - 5,063 USDT to 1,000,000 USDT
Balance: 5,063.23 USDT
Change: +0.00 USDT (+0.0%)
Runners stopped while I rebuild the strategy from the backtest evidence. Nothing open.
Running on a Binance testnet account, so this is demo capital - I would rather say that than let you assume otherwise. The strategy, the costs and the losses are all real.
No signals for sale, no course, no affiliate link. Just the account and the data behind it.
Traded in this challenge: $BTC $SOL $AVAX
#Binance #USDT #Futures #TradingChallenge #Crypto
Balance: 5,063.23 USDT
Change: +0.00 USDT (+0.0%)
Runners stopped while I rebuild the strategy from the backtest evidence. Nothing open.
Running on a Binance testnet account, so this is demo capital - I would rather say that than let you assume otherwise. The strategy, the costs and the losses are all real.
No signals for sale, no course, no affiliate link. Just the account and the data behind it.
Traded in this challenge: $BTC $SOL $AVAX
#Binance #USDT #Futures #TradingChallenge #Crypto
7
Artículo
Ver traducción
A strategy with a 96% win rate lost me money. Win rate tells you almost nothing.A strategy with a 96% win rate lost me money. Win rate tells you almost nothing.
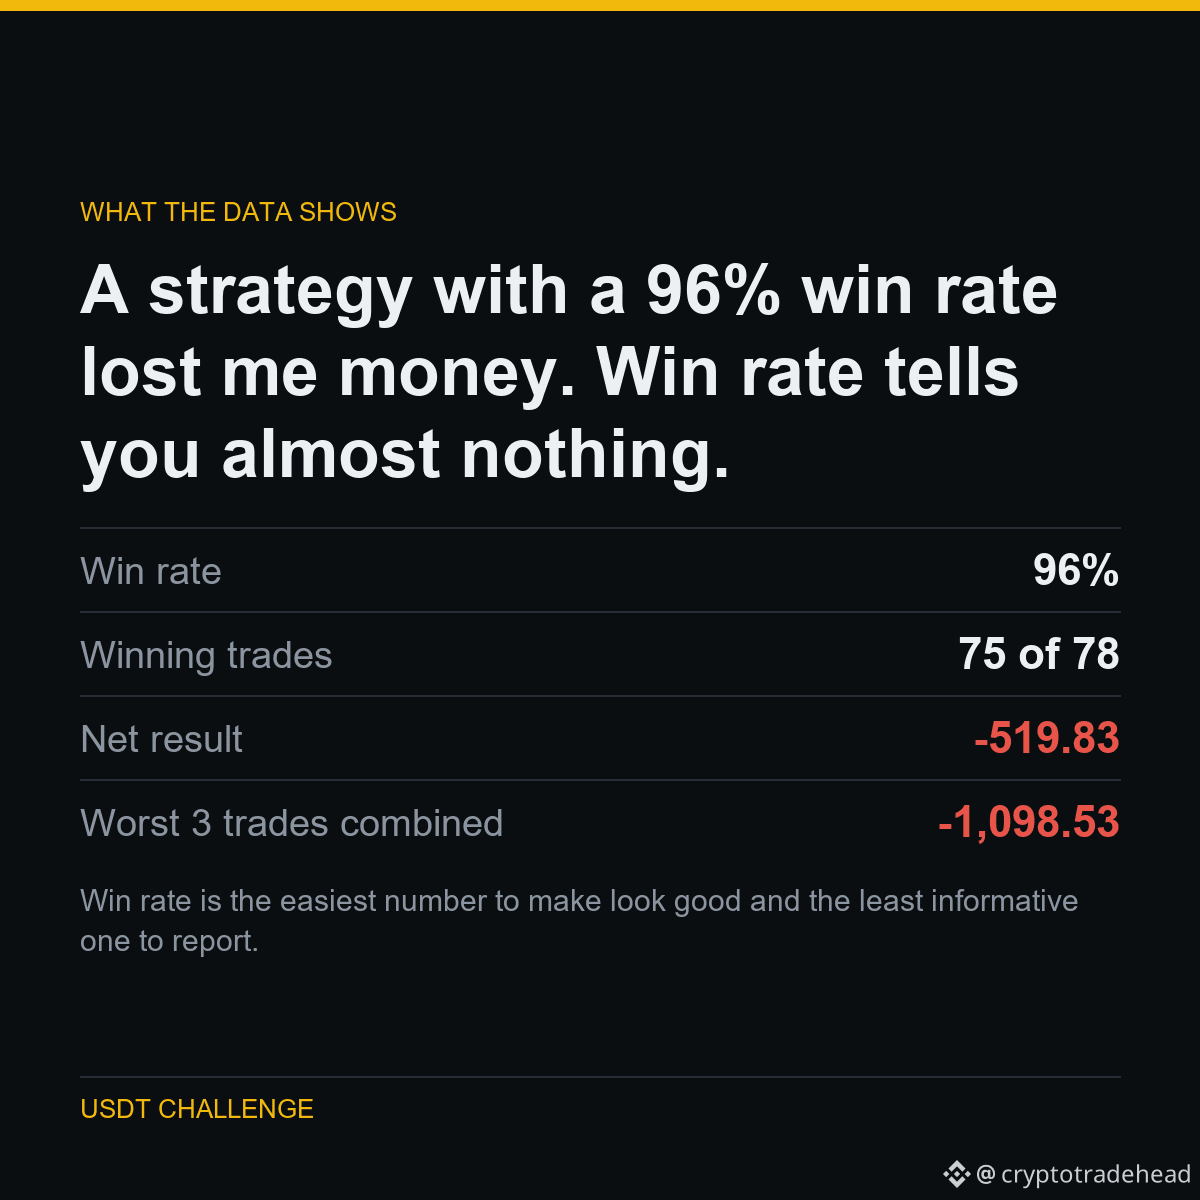
I backtested a martingale system - add to losers, close when it recovers. 75 of 78 trades were winners.
It still lost 519.83 USDT, because the three losing trades gave back more than all 75 winners made combined.
Peak margin on those trades reached 4x the entire account.
WHAT IT MEANS
Win rate is the easiest number to make look good and the least informative one to report. Anyone showing you a win rate without the size of the losses is showing you the half of the picture that flatters them.
Part of a public experiment: 5,063 USDT to 1,000,000 USDT, every result published - including the ones that make me look bad.
Run on $BNB
#Binance #Futures #Backtesting #TradingBot #CryptoData
A strategy with a 96% win rate lost me money. Win rate tells you almost nothing.
A strategy with a 96% win rate lost me money. Win rate tells you almost nothing.
I backtested a martingale system - add to losers, close when it recovers. 75 of 78 trades were winners.
It still lost 519.83 USDT, because the three losing trades gave back more than all 75 winners made combined.
Peak margin on those trades reached 4x the entire account.
WHAT IT MEANS
Win rate is the easiest number to make look good and the least informative one to report. Anyone showing you a win rate without the size of the losses is showing you the half of the picture that flatters them.
Part of a public experiment: 5,063 USDT to 1,000,000 USDT, every result published - including the ones that make me look bad.
Run on $BNB
#Binance #Futures #Backtesting #TradingBot #CryptoData
I backtested a martingale system - add to losers, close when it recovers. 75 of 78 trades were winners.
It still lost 519.83 USDT, because the three losing trades gave back more than all 75 winners made combined.
Peak margin on those trades reached 4x the entire account.
WHAT IT MEANS
Win rate is the easiest number to make look good and the least informative one to report. Anyone showing you a win rate without the size of the losses is showing you the half of the picture that flatters them.
Part of a public experiment: 5,063 USDT to 1,000,000 USDT, every result published - including the ones that make me look bad.
Run on $BNB
#Binance #Futures #Backtesting #TradingBot #CryptoData
3
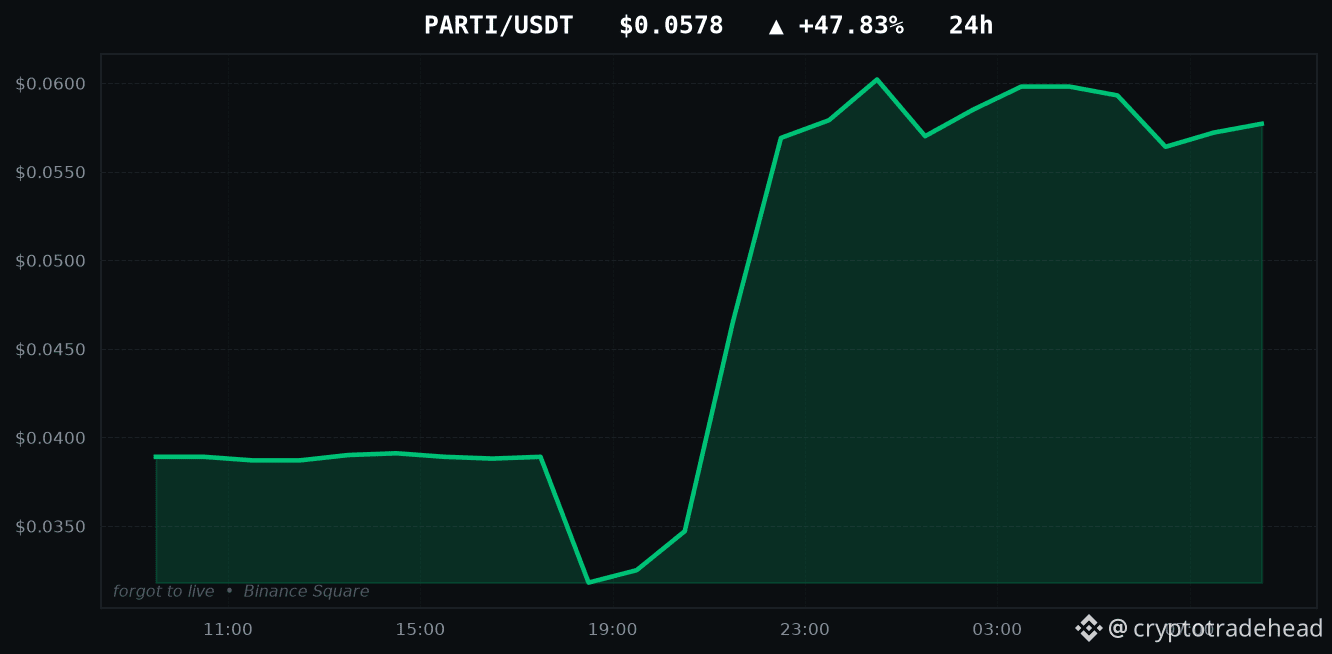
Artículo
PARTI sube un +47.83%: probé ambas formas de operarMAYORES SUBIDAS DE HOY
PARTI: +47.83%
HYPE: +18.27%
SOXSB: +11.07%
RUNE: +9.57%
LSK: +6.80%
Todas las cuentas de esta app te mostrarán esta lista. Esta es la parte que omiten.
Probé con datos históricos ambas formas de operar un movimiento como el +47.83% de PARTI: comprar la ruptura y apostar en contra suponiendo que el precio retrocedería. Ambas dieron pérdidas. Y no por poco: perdieron aproximadamente lo mismo que cuesta la transacción, un 0.240% por operación de ida y vuelta, que es lo que parece una señal sin información cuando se le aplican comisiones.
Un gran movimiento en 24 horas te dice que algo ya ocurrió. No te dice qué ocurrirá después, y los datos lo demuestran en ambos sentidos.
PARTI sube un +47.83%: probé ambas formas de operar
MAYORES SUBIDAS DE HOY
PARTI: +47.83%
HYPE: +18.27%
SOXSB: +11.07%
RUNE: +9.57%
LSK: +6.80%
Todas las cuentas de esta app te mostrarán esta lista. Esta es la parte que omiten.
Probé con datos históricos ambas formas de operar un movimiento como el +47.83% de PARTI: comprar la ruptura y apostar en contra suponiendo que el precio retrocedería. Ambas dieron pérdidas. Y no por poco: perdieron aproximadamente lo mismo que cuesta la transacción, un 0.240% por operación de ida y vuelta, que es lo que parece una señal sin información cuando se le aplican comisiones.
Un gran movimiento en 24 horas te dice que algo ya ocurrió. No te dice qué ocurrirá después, y los datos lo demuestran en ambos sentidos.
PARTI: +47.83%
HYPE: +18.27%
SOXSB: +11.07%
RUNE: +9.57%
LSK: +6.80%
Todas las cuentas de esta app te mostrarán esta lista. Esta es la parte que omiten.
Probé con datos históricos ambas formas de operar un movimiento como el +47.83% de PARTI: comprar la ruptura y apostar en contra suponiendo que el precio retrocedería. Ambas dieron pérdidas. Y no por poco: perdieron aproximadamente lo mismo que cuesta la transacción, un 0.240% por operación de ida y vuelta, que es lo que parece una señal sin información cuando se le aplican comisiones.
Un gran movimiento en 24 horas te dice que algo ya ocurrió. No te dice qué ocurrirá después, y los datos lo demuestran en ambos sentidos.
21
Inicia sesión para explorar más contenidos
Únete a usuarios de criptomonedas de todo el mundo en Binance Square
⚡️ Obtén la información más reciente y útil sobre criptomonedas.
💬 Confía en el mayor exchange de criptomonedas del mundo.
👍 Descubre opiniones reales de creadores verificados.
Correo electrónico/número de teléfono
Temas en tendencia
$1.5BInLeveragedCryptoBetsLiquidated
2,889 visualizaciones
51 participa(n) en el debate
#$1.5BInLeveragedCryptoBetsLiquidated
📉 Cuando cayeron los precios de las criptomonedas, se liquidaron automáticamente las posiciones de quienes apostaban por una subida con apalancamiento. En 24 horas se liquidaron operaciones por un total de 1,53 mil millones de dólares; alrededor del 83,8 % eran posiciones «long», que apostaban a que los precios subirían. Esta cifra mide el valor total de las posiciones cerradas, no el dinero que salió del bolsillo de los inversores. 💸
⚙️ El apalancamiento es como abrir una operación más grande con poco dinero. Cuando el precio se mueve lo suficiente en la dirección contraria, la garantía no alcanza y la plataforma cierra la posición a la fuerza. Estas ventas pueden acelerar aún más la caída. La noticia vincula la ola de ventas con el incidente de seguridad ocurrido en Binance.
🔄 Cuando los precios se recuperaron, también se liquidaron algunas posiciones «short» que apostaban por una caída; las compras necesarias para cerrarlas pueden impulsar la subida.$LSK $IDOL $Q
Sat_Stacker
·0 «Me gusta»
·301 visualizaciones
KOSPIFalls3.53%BackBelow6000
5,863 visualizaciones
236 participa(n) en el debate
USMidtermElections
116,482 visualizaciones
1,489 participa(n) en el debate