
Mukhtiar_Ali_55
11.8k Publicaciones

Mukhtiar_Ali_55
Denunciar
Bloquear usuario
32 Siguiendo
433 Seguidores
4.4K+ Me gusta
Publicaciones
Todo
Cotizaciones
Ver traducción
RLC, LSK and GTC: Infrastructure Tokens Show Fresh Signs of Market ParticipationThe latest spot market action is bringing renewed attention to blockchain infrastructure tokens, with RLC, LSK and GTC all trading higher in the current 24 hour window. These assets represent three different corners of the infrastructure narrative: decentralized computing, scalable blockchain development, and open source funding. Their gains are notable, but the market structure behind each move matters more than the headline percentage alone.
RLC is trading near $0.3120, up +3.11% from its 24 hour open of $0.3026. It has traded between $0.3021 and $0.3169, producing a 4.90% session range. The price is holding relatively close to the session high, which suggests buyers have remained present after the initial advance.
RLC is the utility token associated with iExec, a project focused on decentralized cloud computing and resource coordination. Its relevance comes from the continuing interest in distributed compute, AI related infrastructure, and blockchain based data services. As AI and decentralized infrastructure become more visible themes across crypto, assets connected to practical computing use cases can attract fresh attention.
The current RLC move is measured rather than explosive. That can be a constructive sign because it suggests a more orderly recovery than a sudden, low liquidity spike. However, its trading volume and broader sentiment around infrastructure tokens will remain important. If market participation stays consistent, RLC may continue to hold attention within the decentralized computing category. If liquidity weakens, the relatively contained range can still expand quickly.
LSK is showing the strongest 24 hour move of the group, trading around $0.1409, up +5.39% from its open of $0.1337. The session low was $0.1324, while the high reached $0.1426, resulting in a 7.70% intraday range. LSK is currently close to its session peak, showing stronger near term buyer interest than RLC and GTC.
Lisk has evolved its market identity toward an Ethereum aligned blockchain ecosystem focused on accessibility, application development, and scalable infrastructure. The project remains relevant to traders tracking Layer 2 development, developer activity, and broader adoption of blockchain applications. When the market rotates toward ecosystem tokens with identifiable technical narratives, LSK can become more active.
The latest move reflects improving demand, yet the wider intraday range also shows that volatility is elevated. A move toward the session high can bring more visibility, but sustained momentum depends on whether buyers remain active after the first wave of attention. For LSK, continued volume and wider interest in Layer 2 infrastructure will be key factors to watch. Price movement without follow through can become vulnerable to short term reversals, especially in lower priced altcoins where sentiment can change quickly.
GTC is trading near $0.13425, up +3.23% from its 24 hour open of $0.13005. It recorded a high of $0.13741 and a low of $0.12984, creating a 5.83% session range. GTC is also trading in the upper part of its daily range, showing that demand has remained stable during the current session.
Gitcoin is widely associated with public goods funding, open source development, and community driven support for Web3 builders. Its market role is distinct from RLC and LSK because GTC is linked more directly to the social and funding layer of the blockchain ecosystem. This gives it exposure to a narrative centered on developer incentives, grants, governance, and the long term sustainability of decentralized applications.
The current GTC recovery suggests renewed participation, but its performance should be viewed through the lens of liquidity and ecosystem engagement. Tokens connected to governance and public goods can respond to broader Ethereum ecosystem sentiment, project activity, and market appetite for infrastructure narratives. The current move is positive, but long term relevance depends on continued ecosystem usage rather than short term price momentum alone.
Together, RLC, LSK and GTC show that the market is looking beyond a single crypto theme. RLC offers exposure to decentralized computing and AI linked infrastructure. LSK reflects interest in scalable blockchain and application development. GTC represents the funding and governance layer supporting open source Web3 innovation.
The strongest current percentage performer is LSK at +5.39%, followed by GTC at +3.23% and RLC at +3.11%. However, these are different market exposures, not interchangeable assets. The next phase for each will depend on trading volume, liquidity conditions, project level developments, and broader sentiment across Bitcoin, Ethereum, and altcoins.
In fast moving markets, the most useful signals are consistent volume, orderly price behavior, and sustained participation after the initial move. Green candles can create attention, but durable momentum usually needs a stronger foundation than one positive session.
#RLC #LSK #GTC #CryptoMarket #Blockchain
$RLC
{spot}(RLCUSDT)
$LSK
{spot}(LSKUSDT)
$GTC
{spot}(GTCUSDT)
RLC, LSK and GTC: Infrastructure Tokens Show Fresh Signs of Market Participation
The latest spot market action is bringing renewed attention to blockchain infrastructure tokens, with RLC, LSK and GTC all trading higher in the current 24 hour window. These assets represent three different corners of the infrastructure narrative: decentralized computing, scalable blockchain development, and open source funding. Their gains are notable, but the market structure behind each move matters more than the headline percentage alone.
RLC is trading near $0.3120, up +3.11% from its 24 hour open of $0.3026. It has traded between $0.3021 and $0.3169, producing a 4.90% session range. The price is holding relatively close to the session high, which suggests buyers have remained present after the initial advance.
RLC is the utility token associated with iExec, a project focused on decentralized cloud computing and resource coordination. Its relevance comes from the continuing interest in distributed compute, AI related infrastructure, and blockchain based data services. As AI and decentralized infrastructure become more visible themes across crypto, assets connected to practical computing use cases can attract fresh attention.
The current RLC move is measured rather than explosive. That can be a constructive sign because it suggests a more orderly recovery than a sudden, low liquidity spike. However, its trading volume and broader sentiment around infrastructure tokens will remain important. If market participation stays consistent, RLC may continue to hold attention within the decentralized computing category. If liquidity weakens, the relatively contained range can still expand quickly.
LSK is showing the strongest 24 hour move of the group, trading around $0.1409, up +5.39% from its open of $0.1337. The session low was $0.1324, while the high reached $0.1426, resulting in a 7.70% intraday range. LSK is currently close to its session peak, showing stronger near term buyer interest than RLC and GTC.
Lisk has evolved its market identity toward an Ethereum aligned blockchain ecosystem focused on accessibility, application development, and scalable infrastructure. The project remains relevant to traders tracking Layer 2 development, developer activity, and broader adoption of blockchain applications. When the market rotates toward ecosystem tokens with identifiable technical narratives, LSK can become more active.
The latest move reflects improving demand, yet the wider intraday range also shows that volatility is elevated. A move toward the session high can bring more visibility, but sustained momentum depends on whether buyers remain active after the first wave of attention. For LSK, continued volume and wider interest in Layer 2 infrastructure will be key factors to watch. Price movement without follow through can become vulnerable to short term reversals, especially in lower priced altcoins where sentiment can change quickly.
GTC is trading near $0.13425, up +3.23% from its 24 hour open of $0.13005. It recorded a high of $0.13741 and a low of $0.12984, creating a 5.83% session range. GTC is also trading in the upper part of its daily range, showing that demand has remained stable during the current session.
Gitcoin is widely associated with public goods funding, open source development, and community driven support for Web3 builders. Its market role is distinct from RLC and LSK because GTC is linked more directly to the social and funding layer of the blockchain ecosystem. This gives it exposure to a narrative centered on developer incentives, grants, governance, and the long term sustainability of decentralized applications.
The current GTC recovery suggests renewed participation, but its performance should be viewed through the lens of liquidity and ecosystem engagement. Tokens connected to governance and public goods can respond to broader Ethereum ecosystem sentiment, project activity, and market appetite for infrastructure narratives. The current move is positive, but long term relevance depends on continued ecosystem usage rather than short term price momentum alone.
Together, RLC, LSK and GTC show that the market is looking beyond a single crypto theme. RLC offers exposure to decentralized computing and AI linked infrastructure. LSK reflects interest in scalable blockchain and application development. GTC represents the funding and governance layer supporting open source Web3 innovation.
The strongest current percentage performer is LSK at +5.39%, followed by GTC at +3.23% and RLC at +3.11%. However, these are different market exposures, not interchangeable assets. The next phase for each will depend on trading volume, liquidity conditions, project level developments, and broader sentiment across Bitcoin, Ethereum, and altcoins.
In fast moving markets, the most useful signals are consistent volume, orderly price behavior, and sustained participation after the initial move. Green candles can create attention, but durable momentum usually needs a stronger foundation than one positive session.
#RLC #LSK #GTC #CryptoMarket #Blockchain
$RLC
$LSK
$GTC
RLC is trading near $0.3120, up +3.11% from its 24 hour open of $0.3026. It has traded between $0.3021 and $0.3169, producing a 4.90% session range. The price is holding relatively close to the session high, which suggests buyers have remained present after the initial advance.
RLC is the utility token associated with iExec, a project focused on decentralized cloud computing and resource coordination. Its relevance comes from the continuing interest in distributed compute, AI related infrastructure, and blockchain based data services. As AI and decentralized infrastructure become more visible themes across crypto, assets connected to practical computing use cases can attract fresh attention.
The current RLC move is measured rather than explosive. That can be a constructive sign because it suggests a more orderly recovery than a sudden, low liquidity spike. However, its trading volume and broader sentiment around infrastructure tokens will remain important. If market participation stays consistent, RLC may continue to hold attention within the decentralized computing category. If liquidity weakens, the relatively contained range can still expand quickly.
LSK is showing the strongest 24 hour move of the group, trading around $0.1409, up +5.39% from its open of $0.1337. The session low was $0.1324, while the high reached $0.1426, resulting in a 7.70% intraday range. LSK is currently close to its session peak, showing stronger near term buyer interest than RLC and GTC.
Lisk has evolved its market identity toward an Ethereum aligned blockchain ecosystem focused on accessibility, application development, and scalable infrastructure. The project remains relevant to traders tracking Layer 2 development, developer activity, and broader adoption of blockchain applications. When the market rotates toward ecosystem tokens with identifiable technical narratives, LSK can become more active.
The latest move reflects improving demand, yet the wider intraday range also shows that volatility is elevated. A move toward the session high can bring more visibility, but sustained momentum depends on whether buyers remain active after the first wave of attention. For LSK, continued volume and wider interest in Layer 2 infrastructure will be key factors to watch. Price movement without follow through can become vulnerable to short term reversals, especially in lower priced altcoins where sentiment can change quickly.
GTC is trading near $0.13425, up +3.23% from its 24 hour open of $0.13005. It recorded a high of $0.13741 and a low of $0.12984, creating a 5.83% session range. GTC is also trading in the upper part of its daily range, showing that demand has remained stable during the current session.
Gitcoin is widely associated with public goods funding, open source development, and community driven support for Web3 builders. Its market role is distinct from RLC and LSK because GTC is linked more directly to the social and funding layer of the blockchain ecosystem. This gives it exposure to a narrative centered on developer incentives, grants, governance, and the long term sustainability of decentralized applications.
The current GTC recovery suggests renewed participation, but its performance should be viewed through the lens of liquidity and ecosystem engagement. Tokens connected to governance and public goods can respond to broader Ethereum ecosystem sentiment, project activity, and market appetite for infrastructure narratives. The current move is positive, but long term relevance depends on continued ecosystem usage rather than short term price momentum alone.
Together, RLC, LSK and GTC show that the market is looking beyond a single crypto theme. RLC offers exposure to decentralized computing and AI linked infrastructure. LSK reflects interest in scalable blockchain and application development. GTC represents the funding and governance layer supporting open source Web3 innovation.
The strongest current percentage performer is LSK at +5.39%, followed by GTC at +3.23% and RLC at +3.11%. However, these are different market exposures, not interchangeable assets. The next phase for each will depend on trading volume, liquidity conditions, project level developments, and broader sentiment across Bitcoin, Ethereum, and altcoins.
In fast moving markets, the most useful signals are consistent volume, orderly price behavior, and sustained participation after the initial move. Green candles can create attention, but durable momentum usually needs a stronger foundation than one positive session.
#RLC #LSK #GTC #CryptoMarket #Blockchain
$RLC
$LSK
$GTC
5
Ver traducción
DASH, NIGHT and MARSCOIN: Payment Utility, Infrastructure and Meme Momentum in FocusThe crypto market is showing renewed interest across very different sectors, and DASH, NIGHT and MARSCOIN are currently drawing attention for three distinct reasons. DASH represents established digital payment utility, NIGHT is positioned around blockchain infrastructure, and MARSCOIN is moving within the high risk meme token category. Their latest price action highlights how quickly capital can rotate between mature use cases and newer speculative narratives.
DASH is trading near $35.09, up +7.94% in the latest 24 hour session from an opening level of $32.51. The token reached a high of $35.75 and a low of $32.34, creating a session range of 10.54%. DASH is trading relatively close to its session high, which suggests that buyers have remained active after the early recovery.
Dash has long been associated with fast and low cost digital payments. In a market often dominated by short term narratives, this payment focused identity gives DASH a different type of relevance. Its value proposition is connected to real world transfer utility, merchant focused use cases, and a network designed to support efficient peer to peer transactions.
The latest move in DASH points to improving short term demand, but its next phase will depend on whether market participation remains steady. Volume, broader altcoin sentiment, and renewed attention toward payment focused crypto assets will be important factors. The current recovery is positive from a momentum perspective, yet the double digit session range also confirms that volatility remains active. Traders watching DASH may find it useful to focus on whether price can maintain stability after its recent push higher rather than reacting only to a single green move.
NIGHT is trading around $0.04686, up +17.44% in the latest 24 hour session from an opening level of $0.03990. It recorded a high of $0.04783 and a low of $0.03974, resulting in a session range of 20.36%. NIGHT is showing the strongest daily percentage gain among the three assets and is also trading close to its current session peak.
NIGHT is linked to the Midnight network narrative and sits within the blockchain infrastructure category. Infrastructure focused tokens can attract strong attention when the market begins looking beyond simple price speculation and toward networks designed to support applications, privacy, scalability, and broader developer activity. This sector can be especially active when capital rotates toward newer Layer 1 and Layer 2 ecosystems.
The current upside move reflects strong buyer interest, but the wide intraday range is equally important. A gain of more than 17% can create visibility quickly, yet a 20% session range also shows that the market is moving with high intensity. Sustained strength would require continued liquidity, stable demand, and a supportive environment for infrastructure focused altcoins. If trading activity cools after the initial breakout attempt, NIGHT may remain vulnerable to rapid swings in either direction.
MARSCOIN is trading near $0.0312, up +14.71% in the latest 24 hour session from an opening level of $0.0272. The token traded between $0.0271 and $0.0333, producing the widest session range of the group at 22.88%. This indicates strong participation, but it also places MARSCOIN firmly in a high volatility market environment.
MARSCOIN is categorized within the meme token segment, where social attention, community activity, liquidity conditions, and changing market sentiment can have a major impact on price behavior. Unlike DASH, which has an established payments identity, or NIGHT, which is linked to infrastructure development, MARSCOIN is more sensitive to speculative flows and short term narrative strength.
The latest move shows that buyers are active, but meme token momentum requires careful context. A rapid rise can bring large trading interest, while reduced attention can create equally rapid pullbacks. For MARSCOIN, the key signals are whether volume stays strong, whether liquidity remains orderly, and whether the wider meme sector continues attracting risk appetite. The token’s large session range shows that price discovery is active, but it also signals that risk management and market awareness are essential.
The bigger market picture is that DASH, NIGHT and MARSCOIN are benefiting from different forms of participation. DASH is showing renewed demand around a payment utility narrative. NIGHT is gaining attention through the infrastructure and network development theme. MARSCOIN is capturing speculative interest through meme driven momentum.
These are not identical market exposures. DASH may appeal to traders tracking established payment focused assets. NIGHT reflects interest in emerging blockchain infrastructure. MARSCOIN represents a faster moving, community driven market where volatility can increase sharply.
The latest gains are notable, but price direction will still depend on liquidity, trading volume, broader Bitcoin and altcoin sentiment, and project specific developments. A disciplined market view should always consider both the opportunity created by momentum and the risks that emerge when price movements become crowded.
#DASH #NIGHT #MARSCOIN #CryptoMarket #Altcoins
$DASH
{spot}(DASHUSDT)
$NIGHT
{spot}(NIGHTUSDT)
$MARSCOIN
{spot}(MARSCOINUSDT)
DASH, NIGHT and MARSCOIN: Payment Utility, Infrastructure and Meme Momentum in Focus
The crypto market is showing renewed interest across very different sectors, and DASH, NIGHT and MARSCOIN are currently drawing attention for three distinct reasons. DASH represents established digital payment utility, NIGHT is positioned around blockchain infrastructure, and MARSCOIN is moving within the high risk meme token category. Their latest price action highlights how quickly capital can rotate between mature use cases and newer speculative narratives.
DASH is trading near $35.09, up +7.94% in the latest 24 hour session from an opening level of $32.51. The token reached a high of $35.75 and a low of $32.34, creating a session range of 10.54%. DASH is trading relatively close to its session high, which suggests that buyers have remained active after the early recovery.
Dash has long been associated with fast and low cost digital payments. In a market often dominated by short term narratives, this payment focused identity gives DASH a different type of relevance. Its value proposition is connected to real world transfer utility, merchant focused use cases, and a network designed to support efficient peer to peer transactions.
The latest move in DASH points to improving short term demand, but its next phase will depend on whether market participation remains steady. Volume, broader altcoin sentiment, and renewed attention toward payment focused crypto assets will be important factors. The current recovery is positive from a momentum perspective, yet the double digit session range also confirms that volatility remains active. Traders watching DASH may find it useful to focus on whether price can maintain stability after its recent push higher rather than reacting only to a single green move.
NIGHT is trading around $0.04686, up +17.44% in the latest 24 hour session from an opening level of $0.03990. It recorded a high of $0.04783 and a low of $0.03974, resulting in a session range of 20.36%. NIGHT is showing the strongest daily percentage gain among the three assets and is also trading close to its current session peak.
NIGHT is linked to the Midnight network narrative and sits within the blockchain infrastructure category. Infrastructure focused tokens can attract strong attention when the market begins looking beyond simple price speculation and toward networks designed to support applications, privacy, scalability, and broader developer activity. This sector can be especially active when capital rotates toward newer Layer 1 and Layer 2 ecosystems.
The current upside move reflects strong buyer interest, but the wide intraday range is equally important. A gain of more than 17% can create visibility quickly, yet a 20% session range also shows that the market is moving with high intensity. Sustained strength would require continued liquidity, stable demand, and a supportive environment for infrastructure focused altcoins. If trading activity cools after the initial breakout attempt, NIGHT may remain vulnerable to rapid swings in either direction.
MARSCOIN is trading near $0.0312, up +14.71% in the latest 24 hour session from an opening level of $0.0272. The token traded between $0.0271 and $0.0333, producing the widest session range of the group at 22.88%. This indicates strong participation, but it also places MARSCOIN firmly in a high volatility market environment.
MARSCOIN is categorized within the meme token segment, where social attention, community activity, liquidity conditions, and changing market sentiment can have a major impact on price behavior. Unlike DASH, which has an established payments identity, or NIGHT, which is linked to infrastructure development, MARSCOIN is more sensitive to speculative flows and short term narrative strength.
The latest move shows that buyers are active, but meme token momentum requires careful context. A rapid rise can bring large trading interest, while reduced attention can create equally rapid pullbacks. For MARSCOIN, the key signals are whether volume stays strong, whether liquidity remains orderly, and whether the wider meme sector continues attracting risk appetite. The token’s large session range shows that price discovery is active, but it also signals that risk management and market awareness are essential.
The bigger market picture is that DASH, NIGHT and MARSCOIN are benefiting from different forms of participation. DASH is showing renewed demand around a payment utility narrative. NIGHT is gaining attention through the infrastructure and network development theme. MARSCOIN is capturing speculative interest through meme driven momentum.
These are not identical market exposures. DASH may appeal to traders tracking established payment focused assets. NIGHT reflects interest in emerging blockchain infrastructure. MARSCOIN represents a faster moving, community driven market where volatility can increase sharply.
The latest gains are notable, but price direction will still depend on liquidity, trading volume, broader Bitcoin and altcoin sentiment, and project specific developments. A disciplined market view should always consider both the opportunity created by momentum and the risks that emerge when price movements become crowded.
#DASH #NIGHT #MARSCOIN #CryptoMarket #Altcoins
$DASH
$NIGHT
$MARSCOIN
DASH is trading near $35.09, up +7.94% in the latest 24 hour session from an opening level of $32.51. The token reached a high of $35.75 and a low of $32.34, creating a session range of 10.54%. DASH is trading relatively close to its session high, which suggests that buyers have remained active after the early recovery.
Dash has long been associated with fast and low cost digital payments. In a market often dominated by short term narratives, this payment focused identity gives DASH a different type of relevance. Its value proposition is connected to real world transfer utility, merchant focused use cases, and a network designed to support efficient peer to peer transactions.
The latest move in DASH points to improving short term demand, but its next phase will depend on whether market participation remains steady. Volume, broader altcoin sentiment, and renewed attention toward payment focused crypto assets will be important factors. The current recovery is positive from a momentum perspective, yet the double digit session range also confirms that volatility remains active. Traders watching DASH may find it useful to focus on whether price can maintain stability after its recent push higher rather than reacting only to a single green move.
NIGHT is trading around $0.04686, up +17.44% in the latest 24 hour session from an opening level of $0.03990. It recorded a high of $0.04783 and a low of $0.03974, resulting in a session range of 20.36%. NIGHT is showing the strongest daily percentage gain among the three assets and is also trading close to its current session peak.
NIGHT is linked to the Midnight network narrative and sits within the blockchain infrastructure category. Infrastructure focused tokens can attract strong attention when the market begins looking beyond simple price speculation and toward networks designed to support applications, privacy, scalability, and broader developer activity. This sector can be especially active when capital rotates toward newer Layer 1 and Layer 2 ecosystems.
The current upside move reflects strong buyer interest, but the wide intraday range is equally important. A gain of more than 17% can create visibility quickly, yet a 20% session range also shows that the market is moving with high intensity. Sustained strength would require continued liquidity, stable demand, and a supportive environment for infrastructure focused altcoins. If trading activity cools after the initial breakout attempt, NIGHT may remain vulnerable to rapid swings in either direction.
MARSCOIN is trading near $0.0312, up +14.71% in the latest 24 hour session from an opening level of $0.0272. The token traded between $0.0271 and $0.0333, producing the widest session range of the group at 22.88%. This indicates strong participation, but it also places MARSCOIN firmly in a high volatility market environment.
MARSCOIN is categorized within the meme token segment, where social attention, community activity, liquidity conditions, and changing market sentiment can have a major impact on price behavior. Unlike DASH, which has an established payments identity, or NIGHT, which is linked to infrastructure development, MARSCOIN is more sensitive to speculative flows and short term narrative strength.
The latest move shows that buyers are active, but meme token momentum requires careful context. A rapid rise can bring large trading interest, while reduced attention can create equally rapid pullbacks. For MARSCOIN, the key signals are whether volume stays strong, whether liquidity remains orderly, and whether the wider meme sector continues attracting risk appetite. The token’s large session range shows that price discovery is active, but it also signals that risk management and market awareness are essential.
The bigger market picture is that DASH, NIGHT and MARSCOIN are benefiting from different forms of participation. DASH is showing renewed demand around a payment utility narrative. NIGHT is gaining attention through the infrastructure and network development theme. MARSCOIN is capturing speculative interest through meme driven momentum.
These are not identical market exposures. DASH may appeal to traders tracking established payment focused assets. NIGHT reflects interest in emerging blockchain infrastructure. MARSCOIN represents a faster moving, community driven market where volatility can increase sharply.
The latest gains are notable, but price direction will still depend on liquidity, trading volume, broader Bitcoin and altcoin sentiment, and project specific developments. A disciplined market view should always consider both the opportunity created by momentum and the risks that emerge when price movements become crowded.
#DASH #NIGHT #MARSCOIN #CryptoMarket #Altcoins
$DASH
$NIGHT
$MARSCOIN
6
ONDO, ETHFI y FIL: los RWA, el restaking y el almacenamiento descentralizado captan renovada atención del mercadoLa sesión más reciente del mercado cripto muestra un renovado interés por las altcoins impulsadas por la utilidad, con ONDO, ETHFI y FIL registrando ganancias significativas. Estos activos representan tres sectores distintos que siguen dando forma al mercado general de activos digitales: activos del mundo real, restaking de Ethereum y almacenamiento descentralizado de datos.
La fortaleza de los tres tokens sugiere que los operadores no se centran en una sola narrativa. En cambio, la atención del mercado se está desplazando hacia proyectos con casos de uso consolidados, ecosistemas activos y posiciones claras en la próxima fase de adopción de la cadena de bloques. Aun así, cada activo tiene su propio perfil de volatilidad, condiciones de liquidez y riesgos específicos de su sector.
ONDO, ETHFI y FIL: los RWA, el restaking y el almacenamiento descentralizado captan renovada atención del mercado
La sesión más reciente del mercado cripto muestra un renovado interés por las altcoins impulsadas por la utilidad, con ONDO, ETHFI y FIL registrando ganancias significativas. Estos activos representan tres sectores distintos que siguen dando forma al mercado general de activos digitales: activos del mundo real, restaking de Ethereum y almacenamiento descentralizado de datos.
La fortaleza de los tres tokens sugiere que los operadores no se centran en una sola narrativa. En cambio, la atención del mercado se está desplazando hacia proyectos con casos de uso consolidados, ecosistemas activos y posiciones claras en la próxima fase de adopción de la cadena de bloques. Aun así, cada activo tiene su propio perfil de volatilidad, condiciones de liquidez y riesgos específicos de su sector.
La fortaleza de los tres tokens sugiere que los operadores no se centran en una sola narrativa. En cambio, la atención del mercado se está desplazando hacia proyectos con casos de uso consolidados, ecosistemas activos y posiciones claras en la próxima fase de adopción de la cadena de bloques. Aun así, cada activo tiene su propio perfil de volatilidad, condiciones de liquidez y riesgos específicos de su sector.
18
Ver traducción
Render, Gensyn and OFFICIAL TRUMP: AI Infrastructure and Meme Momentum Return to the SpotlightThe current crypto market is showing renewed appetite for narratives that can capture attention quickly, and Render, Gensyn and OFFICIAL TRUMP are three assets reflecting very different forms of market participation. Render represents established decentralized GPU infrastructure, Gensyn represents the emerging decentralized AI compute narrative, and OFFICIAL TRUMP remains tied to fast moving meme token sentiment.
What makes this group interesting is that all three are green in the latest 24 hour session, but the quality of their moves, volatility levels, and underlying narratives are not the same. Traders watching these assets should focus on whether volume and liquidity remain consistent after the initial upside rather than treating one positive session as a guaranteed trend.
Render is currently trading near $1.337, up +8.70% from its 24 hour open of $1.230. The session high reached $1.362, while the low was $1.225, creating an intraday range of 11.18%. Render is trading close to the upper end of its current session range, which indicates that buyers have remained active after the rebound.
Render continues to be one of the more recognizable names in the decentralized computing segment. Its narrative is closely connected to GPU demand, rendering capacity, artificial intelligence workloads, and the expanding need for distributed infrastructure. As AI related tokens regain visibility, Render can attract interest because it is linked to a use case that extends beyond short term market speculation.
The latest move suggests improved demand, but the key test is whether Render can sustain trading activity after pushing higher. Continued spot volume, a supportive AI token sector, and stable sentiment across major crypto assets would strengthen the market structure. If volume cools sharply, the current momentum may become more vulnerable to profit taking. The 11.18% session range also shows that volatility remains elevated, so price swings should be expected even during a constructive move.
Gensyn is trading around $0.01529, up +12.51% from its 24 hour open of $0.01359. It traded between $0.01345 and $0.01815, resulting in a very wide intraday range of 34.94%. This is the strongest percentage gain among the three assets, but it is also the clearest reminder that fast upside momentum can come with substantial risk.
Gensyn is positioned within the decentralized machine learning and compute infrastructure category. This segment is receiving growing attention because AI development increasingly depends on access to computing resources, distributed networks, and scalable data processing. The asset’s recent activity suggests that market participants are responding strongly to that narrative.
However, the size of the intraday range makes one point very clear. Gensyn is currently a high volatility market. A move of this scale can attract momentum traders quickly, but it can also reverse rapidly if liquidity thins or if buyers lose conviction near the session high. For this reason, the more meaningful signal is not simply the +12.51% gain. It is whether demand remains active after the initial expansion and whether the token can maintain orderly trading conditions.
OFFICIAL TRUMP is trading near $0.903, up +6.24% from its 24 hour open of $0.850. The token recorded a high of $0.919 and a low of $0.846, producing an intraday range of 8.63%. Compared with Gensyn, the price behavior is relatively more contained, although meme token volatility remains inherently sensitive to social attention and changing sentiment.
OFFICIAL TRUMP operates in a very different market category from Render and Gensyn. Its price behavior can be influenced by community activity, social media trends, headline risk, overall meme coin liquidity, and broader market appetite for speculative assets. This can create sudden bursts of demand, but it can also make short term price action less connected to traditional fundamentals.
The current recovery shows that buyers are active, yet this type of token requires close attention to volume quality and market sentiment. If participation remains broad and liquidity stays healthy, the market may continue to see strong engagement. If attention shifts away, sentiment driven assets can experience quick reversals. That uncertainty is part of the meme token market structure and should be considered alongside the latest positive move.
The broader message from these three assets is that crypto capital is moving across multiple narratives. Render reflects established decentralized AI infrastructure. Gensyn reflects emerging AI compute speculation with much higher volatility. OFFICIAL TRUMP reflects the continued strength of social and meme driven participation.
Each asset may attract a different type of trader, but none should be viewed in isolation from overall market conditions. Price action, liquidity, token specific developments, and wider risk appetite will remain the main factors shaping their next phase.
#Render #Gensyn #TRUMP #CryptoMarket #AI
$RENDER
{spot}(RENDERUSDT)
$AIGENSYN
{spot}(AIGENSYNUSDT)
$TRUMP
{spot}(TRUMPUSDT)
Render, Gensyn and OFFICIAL TRUMP: AI Infrastructure and Meme Momentum Return to the Spotlight
The current crypto market is showing renewed appetite for narratives that can capture attention quickly, and Render, Gensyn and OFFICIAL TRUMP are three assets reflecting very different forms of market participation. Render represents established decentralized GPU infrastructure, Gensyn represents the emerging decentralized AI compute narrative, and OFFICIAL TRUMP remains tied to fast moving meme token sentiment.
What makes this group interesting is that all three are green in the latest 24 hour session, but the quality of their moves, volatility levels, and underlying narratives are not the same. Traders watching these assets should focus on whether volume and liquidity remain consistent after the initial upside rather than treating one positive session as a guaranteed trend.
Render is currently trading near $1.337, up +8.70% from its 24 hour open of $1.230. The session high reached $1.362, while the low was $1.225, creating an intraday range of 11.18%. Render is trading close to the upper end of its current session range, which indicates that buyers have remained active after the rebound.
Render continues to be one of the more recognizable names in the decentralized computing segment. Its narrative is closely connected to GPU demand, rendering capacity, artificial intelligence workloads, and the expanding need for distributed infrastructure. As AI related tokens regain visibility, Render can attract interest because it is linked to a use case that extends beyond short term market speculation.
The latest move suggests improved demand, but the key test is whether Render can sustain trading activity after pushing higher. Continued spot volume, a supportive AI token sector, and stable sentiment across major crypto assets would strengthen the market structure. If volume cools sharply, the current momentum may become more vulnerable to profit taking. The 11.18% session range also shows that volatility remains elevated, so price swings should be expected even during a constructive move.
Gensyn is trading around $0.01529, up +12.51% from its 24 hour open of $0.01359. It traded between $0.01345 and $0.01815, resulting in a very wide intraday range of 34.94%. This is the strongest percentage gain among the three assets, but it is also the clearest reminder that fast upside momentum can come with substantial risk.
Gensyn is positioned within the decentralized machine learning and compute infrastructure category. This segment is receiving growing attention because AI development increasingly depends on access to computing resources, distributed networks, and scalable data processing. The asset’s recent activity suggests that market participants are responding strongly to that narrative.
However, the size of the intraday range makes one point very clear. Gensyn is currently a high volatility market. A move of this scale can attract momentum traders quickly, but it can also reverse rapidly if liquidity thins or if buyers lose conviction near the session high. For this reason, the more meaningful signal is not simply the +12.51% gain. It is whether demand remains active after the initial expansion and whether the token can maintain orderly trading conditions.
OFFICIAL TRUMP is trading near $0.903, up +6.24% from its 24 hour open of $0.850. The token recorded a high of $0.919 and a low of $0.846, producing an intraday range of 8.63%. Compared with Gensyn, the price behavior is relatively more contained, although meme token volatility remains inherently sensitive to social attention and changing sentiment.
OFFICIAL TRUMP operates in a very different market category from Render and Gensyn. Its price behavior can be influenced by community activity, social media trends, headline risk, overall meme coin liquidity, and broader market appetite for speculative assets. This can create sudden bursts of demand, but it can also make short term price action less connected to traditional fundamentals.
The current recovery shows that buyers are active, yet this type of token requires close attention to volume quality and market sentiment. If participation remains broad and liquidity stays healthy, the market may continue to see strong engagement. If attention shifts away, sentiment driven assets can experience quick reversals. That uncertainty is part of the meme token market structure and should be considered alongside the latest positive move.
The broader message from these three assets is that crypto capital is moving across multiple narratives. Render reflects established decentralized AI infrastructure. Gensyn reflects emerging AI compute speculation with much higher volatility. OFFICIAL TRUMP reflects the continued strength of social and meme driven participation.
Each asset may attract a different type of trader, but none should be viewed in isolation from overall market conditions. Price action, liquidity, token specific developments, and wider risk appetite will remain the main factors shaping their next phase.
#Render #Gensyn #TRUMP #CryptoMarket #AI
$RENDER
$AIGENSYN
$TRUMP
What makes this group interesting is that all three are green in the latest 24 hour session, but the quality of their moves, volatility levels, and underlying narratives are not the same. Traders watching these assets should focus on whether volume and liquidity remain consistent after the initial upside rather than treating one positive session as a guaranteed trend.
Render is currently trading near $1.337, up +8.70% from its 24 hour open of $1.230. The session high reached $1.362, while the low was $1.225, creating an intraday range of 11.18%. Render is trading close to the upper end of its current session range, which indicates that buyers have remained active after the rebound.
Render continues to be one of the more recognizable names in the decentralized computing segment. Its narrative is closely connected to GPU demand, rendering capacity, artificial intelligence workloads, and the expanding need for distributed infrastructure. As AI related tokens regain visibility, Render can attract interest because it is linked to a use case that extends beyond short term market speculation.
The latest move suggests improved demand, but the key test is whether Render can sustain trading activity after pushing higher. Continued spot volume, a supportive AI token sector, and stable sentiment across major crypto assets would strengthen the market structure. If volume cools sharply, the current momentum may become more vulnerable to profit taking. The 11.18% session range also shows that volatility remains elevated, so price swings should be expected even during a constructive move.
Gensyn is trading around $0.01529, up +12.51% from its 24 hour open of $0.01359. It traded between $0.01345 and $0.01815, resulting in a very wide intraday range of 34.94%. This is the strongest percentage gain among the three assets, but it is also the clearest reminder that fast upside momentum can come with substantial risk.
Gensyn is positioned within the decentralized machine learning and compute infrastructure category. This segment is receiving growing attention because AI development increasingly depends on access to computing resources, distributed networks, and scalable data processing. The asset’s recent activity suggests that market participants are responding strongly to that narrative.
However, the size of the intraday range makes one point very clear. Gensyn is currently a high volatility market. A move of this scale can attract momentum traders quickly, but it can also reverse rapidly if liquidity thins or if buyers lose conviction near the session high. For this reason, the more meaningful signal is not simply the +12.51% gain. It is whether demand remains active after the initial expansion and whether the token can maintain orderly trading conditions.
OFFICIAL TRUMP is trading near $0.903, up +6.24% from its 24 hour open of $0.850. The token recorded a high of $0.919 and a low of $0.846, producing an intraday range of 8.63%. Compared with Gensyn, the price behavior is relatively more contained, although meme token volatility remains inherently sensitive to social attention and changing sentiment.
OFFICIAL TRUMP operates in a very different market category from Render and Gensyn. Its price behavior can be influenced by community activity, social media trends, headline risk, overall meme coin liquidity, and broader market appetite for speculative assets. This can create sudden bursts of demand, but it can also make short term price action less connected to traditional fundamentals.
The current recovery shows that buyers are active, yet this type of token requires close attention to volume quality and market sentiment. If participation remains broad and liquidity stays healthy, the market may continue to see strong engagement. If attention shifts away, sentiment driven assets can experience quick reversals. That uncertainty is part of the meme token market structure and should be considered alongside the latest positive move.
The broader message from these three assets is that crypto capital is moving across multiple narratives. Render reflects established decentralized AI infrastructure. Gensyn reflects emerging AI compute speculation with much higher volatility. OFFICIAL TRUMP reflects the continued strength of social and meme driven participation.
Each asset may attract a different type of trader, but none should be viewed in isolation from overall market conditions. Price action, liquidity, token specific developments, and wider risk appetite will remain the main factors shaping their next phase.
#Render #Gensyn #TRUMP #CryptoMarket #AI
$RENDER
$AIGENSYN
$TRUMP
8
ARB, ZRO y QNT: los tokens de infraestructura vuelven a captar la atención del mercadoLa sesión más reciente del mercado cripto muestra un renovado interés por los activos centrados en infraestructura, con ARB, ZRO y QNT registrando ganancias destacadas. Aunque cada token cumple una función diferente dentro del ecosistema blockchain más amplio, la evolución actual de sus precios refleja un mayor apetito por las redes escalables, la conectividad entre cadenas y la interoperabilidad enfocada en empresas.
ARB cotiza alrededor de $0.1151, un alza del +4.73% respecto a su apertura más reciente de las últimas 24 horas, de $0.1099. El token alcanzó un máximo de $0.1155 y un mínimo de $0.1091, lo que produjo un rango de sesión del 5.87%. Este movimiento sitúa a ARB cerca del máximo de la sesión, lo que indica que los compradores se han mantenido activos durante todo el período de negociación actual.
ARB, ZRO y QNT: los tokens de infraestructura vuelven a captar la atención del mercado
La sesión más reciente del mercado cripto muestra un renovado interés por los activos centrados en infraestructura, con ARB, ZRO y QNT registrando ganancias destacadas. Aunque cada token cumple una función diferente dentro del ecosistema blockchain más amplio, la evolución actual de sus precios refleja un mayor apetito por las redes escalables, la conectividad entre cadenas y la interoperabilidad enfocada en empresas.
ARB cotiza alrededor de $0.1151, un alza del +4.73% respecto a su apertura más reciente de las últimas 24 horas, de $0.1099. El token alcanzó un máximo de $0.1155 y un mínimo de $0.1091, lo que produjo un rango de sesión del 5.87%. Este movimiento sitúa a ARB cerca del máximo de la sesión, lo que indica que los compradores se han mantenido activos durante todo el período de negociación actual.
ARB cotiza alrededor de $0.1151, un alza del +4.73% respecto a su apertura más reciente de las últimas 24 horas, de $0.1099. El token alcanzó un máximo de $0.1155 y un mínimo de $0.1091, lo que produjo un rango de sesión del 5.87%. Este movimiento sitúa a ARB cerca del máximo de la sesión, lo que indica que los compradores se han mantenido activos durante todo el período de negociación actual.
9
Ver traducción
ORCA, ASTER and AVAX: Three Crypto Narratives Gaining Fresh MomentumThe latest market action shows that capital is not flowing into only one type of crypto asset. Traders are engaging with Solana DeFi, emerging DeFi infrastructure, and established Layer 1 ecosystems at the same time. ORCA, ASTER and AVAX are each moving higher in the current session, but the reasons behind their strength are different, which makes this a more interesting market than a simple broad based rally.
ORCA is trading near $1.169, up +4.47% from its 24 hour open of $1.119. During the session, ORCA reached a high of $1.326 and a low of $1.116, producing a wide intraday range of 18.82%. That level of movement highlights the higher beta nature of the asset and the sensitivity of Solana DeFi tokens to changing liquidity conditions.
Orca has built its relevance through decentralized exchange infrastructure within the Solana ecosystem. When trading volumes, on chain activity, and attention around Solana improve, liquidity focused protocols can quickly return to the spotlight. The current price action suggests active participation, but the distance between the session low and high also shows that buyers and sellers are still competing aggressively.
For ORCA, sustained interest will depend on whether volume stays elevated after the initial rebound. A strong green candle can attract attention, but lasting momentum usually needs continued liquidity, broader strength in Solana linked assets, and stable demand from traders using decentralized finance products. If activity fades, volatility can remain high in both directions. ORCA is therefore a market that rewards close attention to volume and price behavior rather than reaction to a single session move.
ASTER is trading around $0.5033, up +5.40% from its 24 hour open of $0.4775. It traded between $0.4762 and $0.5115, creating an intraday range of 7.41%. Among these three assets, ASTER is recording the strongest daily percentage gain, showing that buyers are currently more willing to support this emerging DeFi focused token.
ASTER sits in a category where market positioning can shift rapidly. Newer DeFi assets often respond strongly to liquidity growth, ecosystem developments, attention from active traders, and broader sentiment toward decentralized trading. Its current move is constructive, but the asset also remains exposed to the risks that often come with newer and smaller market narratives, including sharp reversals, changing liquidity conditions, and fast sentiment shifts.
The key development to watch is whether ASTER can maintain participation after reaching its session high. A healthy continuation would usually be associated with stable volume and buyers returning on periods of weakness. If the move loses activity quickly, short term volatility may increase. The current strength is notable, but it should be viewed in the context of the asset’s risk profile and the broader DeFi market environment.
AVAX is trading near $6.704, up +4.03% from its 24 hour open of $6.444. The session range has been comparatively controlled, with a low of $6.424 and a high of $6.715, equal to a 4.53% intraday range. This tighter range compared with ORCA and ASTER suggests a more measured recovery, while still showing positive demand.
Avalanche remains one of the better known Layer 1 ecosystems, with its value proposition linked to scalable blockchain infrastructure, subnet architecture, decentralized applications, gaming activity, and real world asset development. Unlike smaller DeFi tokens, AVAX often attracts attention from traders looking for exposure to a more established ecosystem with a broader set of use cases.
The current recovery in AVAX is encouraging from a market participation perspective, but the next phase depends on whether broader altcoin liquidity remains supportive. Layer 1 assets tend to perform best when the market is willing to take risk beyond Bitcoin and major large cap assets. If the wider crypto market strengthens, established ecosystems like Avalanche may benefit from renewed rotation. If risk appetite weakens, AVAX can still face pressure alongside the rest of the altcoin market.
The bigger picture is that these three assets offer different forms of crypto exposure. ORCA reflects Solana DeFi activity and higher volatility. ASTER represents an emerging DeFi narrative with strong short term momentum. AVAX provides exposure to a larger Layer 1 ecosystem with comparatively steadier session behavior.
The market is showing interest across multiple sectors, but price direction remains dependent on volume, liquidity, ecosystem progress, and overall crypto sentiment. Staying focused on these factors is more useful than chasing momentum without context.
#ORCA #ASTER #AVAX #CryptoMarket #DeFi
$ORCA
{spot}(ORCAUSDT)
$ASTER
{spot}(ASTERUSDT)
$AVAX
{spot}(AVAXUSDT)
ORCA, ASTER and AVAX: Three Crypto Narratives Gaining Fresh Momentum
The latest market action shows that capital is not flowing into only one type of crypto asset. Traders are engaging with Solana DeFi, emerging DeFi infrastructure, and established Layer 1 ecosystems at the same time. ORCA, ASTER and AVAX are each moving higher in the current session, but the reasons behind their strength are different, which makes this a more interesting market than a simple broad based rally.
ORCA is trading near $1.169, up +4.47% from its 24 hour open of $1.119. During the session, ORCA reached a high of $1.326 and a low of $1.116, producing a wide intraday range of 18.82%. That level of movement highlights the higher beta nature of the asset and the sensitivity of Solana DeFi tokens to changing liquidity conditions.
Orca has built its relevance through decentralized exchange infrastructure within the Solana ecosystem. When trading volumes, on chain activity, and attention around Solana improve, liquidity focused protocols can quickly return to the spotlight. The current price action suggests active participation, but the distance between the session low and high also shows that buyers and sellers are still competing aggressively.
For ORCA, sustained interest will depend on whether volume stays elevated after the initial rebound. A strong green candle can attract attention, but lasting momentum usually needs continued liquidity, broader strength in Solana linked assets, and stable demand from traders using decentralized finance products. If activity fades, volatility can remain high in both directions. ORCA is therefore a market that rewards close attention to volume and price behavior rather than reaction to a single session move.
ASTER is trading around $0.5033, up +5.40% from its 24 hour open of $0.4775. It traded between $0.4762 and $0.5115, creating an intraday range of 7.41%. Among these three assets, ASTER is recording the strongest daily percentage gain, showing that buyers are currently more willing to support this emerging DeFi focused token.
ASTER sits in a category where market positioning can shift rapidly. Newer DeFi assets often respond strongly to liquidity growth, ecosystem developments, attention from active traders, and broader sentiment toward decentralized trading. Its current move is constructive, but the asset also remains exposed to the risks that often come with newer and smaller market narratives, including sharp reversals, changing liquidity conditions, and fast sentiment shifts.
The key development to watch is whether ASTER can maintain participation after reaching its session high. A healthy continuation would usually be associated with stable volume and buyers returning on periods of weakness. If the move loses activity quickly, short term volatility may increase. The current strength is notable, but it should be viewed in the context of the asset’s risk profile and the broader DeFi market environment.
AVAX is trading near $6.704, up +4.03% from its 24 hour open of $6.444. The session range has been comparatively controlled, with a low of $6.424 and a high of $6.715, equal to a 4.53% intraday range. This tighter range compared with ORCA and ASTER suggests a more measured recovery, while still showing positive demand.
Avalanche remains one of the better known Layer 1 ecosystems, with its value proposition linked to scalable blockchain infrastructure, subnet architecture, decentralized applications, gaming activity, and real world asset development. Unlike smaller DeFi tokens, AVAX often attracts attention from traders looking for exposure to a more established ecosystem with a broader set of use cases.
The current recovery in AVAX is encouraging from a market participation perspective, but the next phase depends on whether broader altcoin liquidity remains supportive. Layer 1 assets tend to perform best when the market is willing to take risk beyond Bitcoin and major large cap assets. If the wider crypto market strengthens, established ecosystems like Avalanche may benefit from renewed rotation. If risk appetite weakens, AVAX can still face pressure alongside the rest of the altcoin market.
The bigger picture is that these three assets offer different forms of crypto exposure. ORCA reflects Solana DeFi activity and higher volatility. ASTER represents an emerging DeFi narrative with strong short term momentum. AVAX provides exposure to a larger Layer 1 ecosystem with comparatively steadier session behavior.
The market is showing interest across multiple sectors, but price direction remains dependent on volume, liquidity, ecosystem progress, and overall crypto sentiment. Staying focused on these factors is more useful than chasing momentum without context.
#ORCA #ASTER #AVAX #CryptoMarket #DeFi
$ORCA
$ASTER
$AVAX
ORCA is trading near $1.169, up +4.47% from its 24 hour open of $1.119. During the session, ORCA reached a high of $1.326 and a low of $1.116, producing a wide intraday range of 18.82%. That level of movement highlights the higher beta nature of the asset and the sensitivity of Solana DeFi tokens to changing liquidity conditions.
Orca has built its relevance through decentralized exchange infrastructure within the Solana ecosystem. When trading volumes, on chain activity, and attention around Solana improve, liquidity focused protocols can quickly return to the spotlight. The current price action suggests active participation, but the distance between the session low and high also shows that buyers and sellers are still competing aggressively.
For ORCA, sustained interest will depend on whether volume stays elevated after the initial rebound. A strong green candle can attract attention, but lasting momentum usually needs continued liquidity, broader strength in Solana linked assets, and stable demand from traders using decentralized finance products. If activity fades, volatility can remain high in both directions. ORCA is therefore a market that rewards close attention to volume and price behavior rather than reaction to a single session move.
ASTER is trading around $0.5033, up +5.40% from its 24 hour open of $0.4775. It traded between $0.4762 and $0.5115, creating an intraday range of 7.41%. Among these three assets, ASTER is recording the strongest daily percentage gain, showing that buyers are currently more willing to support this emerging DeFi focused token.
ASTER sits in a category where market positioning can shift rapidly. Newer DeFi assets often respond strongly to liquidity growth, ecosystem developments, attention from active traders, and broader sentiment toward decentralized trading. Its current move is constructive, but the asset also remains exposed to the risks that often come with newer and smaller market narratives, including sharp reversals, changing liquidity conditions, and fast sentiment shifts.
The key development to watch is whether ASTER can maintain participation after reaching its session high. A healthy continuation would usually be associated with stable volume and buyers returning on periods of weakness. If the move loses activity quickly, short term volatility may increase. The current strength is notable, but it should be viewed in the context of the asset’s risk profile and the broader DeFi market environment.
AVAX is trading near $6.704, up +4.03% from its 24 hour open of $6.444. The session range has been comparatively controlled, with a low of $6.424 and a high of $6.715, equal to a 4.53% intraday range. This tighter range compared with ORCA and ASTER suggests a more measured recovery, while still showing positive demand.
Avalanche remains one of the better known Layer 1 ecosystems, with its value proposition linked to scalable blockchain infrastructure, subnet architecture, decentralized applications, gaming activity, and real world asset development. Unlike smaller DeFi tokens, AVAX often attracts attention from traders looking for exposure to a more established ecosystem with a broader set of use cases.
The current recovery in AVAX is encouraging from a market participation perspective, but the next phase depends on whether broader altcoin liquidity remains supportive. Layer 1 assets tend to perform best when the market is willing to take risk beyond Bitcoin and major large cap assets. If the wider crypto market strengthens, established ecosystems like Avalanche may benefit from renewed rotation. If risk appetite weakens, AVAX can still face pressure alongside the rest of the altcoin market.
The bigger picture is that these three assets offer different forms of crypto exposure. ORCA reflects Solana DeFi activity and higher volatility. ASTER represents an emerging DeFi narrative with strong short term momentum. AVAX provides exposure to a larger Layer 1 ecosystem with comparatively steadier session behavior.
The market is showing interest across multiple sectors, but price direction remains dependent on volume, liquidity, ecosystem progress, and overall crypto sentiment. Staying focused on these factors is more useful than chasing momentum without context.
#ORCA #ASTER #AVAX #CryptoMarket #DeFi
$ORCA
$ASTER
$AVAX
9
INJ, WLD y XAUT: tres narrativas de mercado distintas que empiezan a tomar formaEl mercado cripto no se está moviendo ahora mismo como una sola operación. El capital está rotando entre activos de infraestructura de alta beta, narrativas vinculadas a la IA y exposición a activos tangibles tokenizados. INJ, WLD y XAUT representan tres ámbitos muy distintos de ese mercado, y sus últimos movimientos de precio muestran por qué los traders los siguen de cerca.
Injective (INJ) cotiza actualmente alrededor de $6.261, con una subida de +3.21% durante la última sesión de 24 horas. El movimiento se produjo dentro de un rango de sesión de $5.864 a $6.500, lo que refleja una oscilación intradía de aproximadamente 10.85%. Esa volatilidad pone de manifiesto una participación activa, más que un avance pausado.
INJ, WLD y XAUT: tres narrativas de mercado distintas que empiezan a tomar forma
El mercado cripto no se está moviendo ahora mismo como una sola operación. El capital está rotando entre activos de infraestructura de alta beta, narrativas vinculadas a la IA y exposición a activos tangibles tokenizados. INJ, WLD y XAUT representan tres ámbitos muy distintos de ese mercado, y sus últimos movimientos de precio muestran por qué los traders los siguen de cerca.
Injective (INJ) cotiza actualmente alrededor de $6.261, con una subida de +3.21% durante la última sesión de 24 horas. El movimiento se produjo dentro de un rango de sesión de $5.864 a $6.500, lo que refleja una oscilación intradía de aproximadamente 10.85%. Esa volatilidad pone de manifiesto una participación activa, más que un avance pausado.
Injective (INJ) cotiza actualmente alrededor de $6.261, con una subida de +3.21% durante la última sesión de 24 horas. El movimiento se produjo dentro de un rango de sesión de $5.864 a $6.500, lo que refleja una oscilación intradía de aproximadamente 10.85%. Esa volatilidad pone de manifiesto una participación activa, más que un avance pausado.
1
13
Ver traducción
MSTRB, CRCLB and NVDAB Market Analysis: Three Distinct Narratives Driving bStocks AttentionThe latest bStocks market session is showing strong activity across MSTRB, CRCLB and NVDAB, with all three tokenized securities moving higher against USDT. The common theme is improving short term momentum, but the reasons behind each move are very different. MSTRB is closely tied to the market’s appetite for Bitcoin related equity exposure, CRCLB reflects attention around stablecoin infrastructure and digital payments, while NVDAB remains a core proxy for the global AI, data center and semiconductor narrative.
These are not interchangeable assets. Each has its own risk profile, liquidity behaviour and market driver. For traders following bStocks, the important focus is not simply which ticker is gaining the most today. It is whether the price move is supported by sustained participation, whether the asset can hold above its session range, and whether the underlying narrative remains relevant as broader risk sentiment changes.
MSTRB is trading near $82.77, up 6.63% in the current session. It opened near $77.62, traded as low as $76.96 and reached a session high of $82.81. The intraday range is notable, covering 7.60%, which highlights strong volatility and aggressive price discovery. The move places MSTRB close to its session high, a sign that buyers have maintained control through much of the trading period.
MSTRB represents tokenized economic exposure to Strategy, a company widely followed because of its Bitcoin focused corporate treasury strategy. This means MSTRB can be influenced by several forces at once. Bitcoin market conditions matter, but so do equity market risk appetite, company specific developments, capital market sentiment and the premium or discount investors assign to Bitcoin related corporate exposure.
The latest price action suggests renewed demand, but traders should remember that high beta Bitcoin linked equities can move more sharply than Bitcoin itself during both positive and negative market phases. The current session volume is about 227.38K MSTRB, with turnover near $18.25M. That level of activity shows meaningful attention, but rapid gains near session highs can also bring short term volatility as participants react to changes in the wider crypto and equity environment.
CRCLB is trading near $49.98, up 4.10% in the current session. It opened near $48.01, reached a low of $47.69 and printed a high of $50.07. The session range is 4.99%, showing active but comparatively more measured trading than MSTRB. CRCLB is currently holding close to the upper end of its daily range, which indicates constructive short term momentum.
CRCLB provides tokenized exposure to Circle Internet Group. Its market narrative is closely connected to stablecoin adoption, payment infrastructure, regulatory developments and the expansion of digital finance. As stablecoins become a larger part of trading, settlement, remittances and onchain liquidity, companies operating around this infrastructure can attract significant market attention.
The current session volume is about 339.21K CRCLB, with turnover near $16.56M. This shows that the move is supported by active trading interest. Still, stablecoin related equities can react quickly to headlines involving regulation, partnerships, competitive developments and changes in the broader crypto market. A sustained recovery would depend on continued demand rather than a single positive session.
NVDAB is trading near $132.92, up 2.66% in the current session. It opened near $129.48, fell to $127.87 and reached a high of $133.19. The trading range is 4.16%, and price is holding close to the session high. Compared with MSTRB and CRCLB, NVDAB is posting the smallest percentage gain, yet it remains highly relevant because NVIDIA sits at the center of the AI infrastructure narrative.
NVDAB reflects tokenized economic exposure to NVIDIA, whose market attention is driven by data center demand, AI computing, GPU supply, cloud spending, enterprise adoption and the broader semiconductor cycle. The latest session volume is approximately 105.88K NVDAB, with turnover near $13.87M. The steady advance suggests buyers are active, although the relatively narrower gain compared with MSTRB and CRCLB may indicate a more balanced battle between buyers and sellers.
The larger takeaway is clear. MSTRB is leading the session with a 6.63% gain and the widest intraday range, making it the most volatile setup among the three. CRCLB is up 4.10%, supported by active turnover and the expanding stablecoin infrastructure narrative. NVDAB is up 2.66%, reflecting steady demand for AI related exposure while remaining linked to broader semiconductor and equity market sentiment.
MSTRB, CRCLB and NVDAB all offer different forms of tokenized market exposure. Their current momentum is constructive, but price strength alone is not enough to define a lasting trend. Sustained participation, broader market conditions and narrative durability will remain central to how these bStocks perform in the sessions ahead.
#MSTRB #CRCLB #NVDAB #bStocks #MarketAnalysis
$MSTRB
{spot}(MSTRBUSDT)
$CRCLB
{spot}(CRCLBUSDT)
$NVDAB
{spot}(NVDABUSDT)
MSTRB, CRCLB and NVDAB Market Analysis: Three Distinct Narratives Driving bStocks Attention
The latest bStocks market session is showing strong activity across MSTRB, CRCLB and NVDAB, with all three tokenized securities moving higher against USDT. The common theme is improving short term momentum, but the reasons behind each move are very different. MSTRB is closely tied to the market’s appetite for Bitcoin related equity exposure, CRCLB reflects attention around stablecoin infrastructure and digital payments, while NVDAB remains a core proxy for the global AI, data center and semiconductor narrative.
These are not interchangeable assets. Each has its own risk profile, liquidity behaviour and market driver. For traders following bStocks, the important focus is not simply which ticker is gaining the most today. It is whether the price move is supported by sustained participation, whether the asset can hold above its session range, and whether the underlying narrative remains relevant as broader risk sentiment changes.
MSTRB is trading near $82.77, up 6.63% in the current session. It opened near $77.62, traded as low as $76.96 and reached a session high of $82.81. The intraday range is notable, covering 7.60%, which highlights strong volatility and aggressive price discovery. The move places MSTRB close to its session high, a sign that buyers have maintained control through much of the trading period.
MSTRB represents tokenized economic exposure to Strategy, a company widely followed because of its Bitcoin focused corporate treasury strategy. This means MSTRB can be influenced by several forces at once. Bitcoin market conditions matter, but so do equity market risk appetite, company specific developments, capital market sentiment and the premium or discount investors assign to Bitcoin related corporate exposure.
The latest price action suggests renewed demand, but traders should remember that high beta Bitcoin linked equities can move more sharply than Bitcoin itself during both positive and negative market phases. The current session volume is about 227.38K MSTRB, with turnover near $18.25M. That level of activity shows meaningful attention, but rapid gains near session highs can also bring short term volatility as participants react to changes in the wider crypto and equity environment.
CRCLB is trading near $49.98, up 4.10% in the current session. It opened near $48.01, reached a low of $47.69 and printed a high of $50.07. The session range is 4.99%, showing active but comparatively more measured trading than MSTRB. CRCLB is currently holding close to the upper end of its daily range, which indicates constructive short term momentum.
CRCLB provides tokenized exposure to Circle Internet Group. Its market narrative is closely connected to stablecoin adoption, payment infrastructure, regulatory developments and the expansion of digital finance. As stablecoins become a larger part of trading, settlement, remittances and onchain liquidity, companies operating around this infrastructure can attract significant market attention.
The current session volume is about 339.21K CRCLB, with turnover near $16.56M. This shows that the move is supported by active trading interest. Still, stablecoin related equities can react quickly to headlines involving regulation, partnerships, competitive developments and changes in the broader crypto market. A sustained recovery would depend on continued demand rather than a single positive session.
NVDAB is trading near $132.92, up 2.66% in the current session. It opened near $129.48, fell to $127.87 and reached a high of $133.19. The trading range is 4.16%, and price is holding close to the session high. Compared with MSTRB and CRCLB, NVDAB is posting the smallest percentage gain, yet it remains highly relevant because NVIDIA sits at the center of the AI infrastructure narrative.
NVDAB reflects tokenized economic exposure to NVIDIA, whose market attention is driven by data center demand, AI computing, GPU supply, cloud spending, enterprise adoption and the broader semiconductor cycle. The latest session volume is approximately 105.88K NVDAB, with turnover near $13.87M. The steady advance suggests buyers are active, although the relatively narrower gain compared with MSTRB and CRCLB may indicate a more balanced battle between buyers and sellers.
The larger takeaway is clear. MSTRB is leading the session with a 6.63% gain and the widest intraday range, making it the most volatile setup among the three. CRCLB is up 4.10%, supported by active turnover and the expanding stablecoin infrastructure narrative. NVDAB is up 2.66%, reflecting steady demand for AI related exposure while remaining linked to broader semiconductor and equity market sentiment.
MSTRB, CRCLB and NVDAB all offer different forms of tokenized market exposure. Their current momentum is constructive, but price strength alone is not enough to define a lasting trend. Sustained participation, broader market conditions and narrative durability will remain central to how these bStocks perform in the sessions ahead.
#MSTRB #CRCLB #NVDAB #bStocks #MarketAnalysis
$MSTRB
$CRCLB
$NVDAB
These are not interchangeable assets. Each has its own risk profile, liquidity behaviour and market driver. For traders following bStocks, the important focus is not simply which ticker is gaining the most today. It is whether the price move is supported by sustained participation, whether the asset can hold above its session range, and whether the underlying narrative remains relevant as broader risk sentiment changes.
MSTRB is trading near $82.77, up 6.63% in the current session. It opened near $77.62, traded as low as $76.96 and reached a session high of $82.81. The intraday range is notable, covering 7.60%, which highlights strong volatility and aggressive price discovery. The move places MSTRB close to its session high, a sign that buyers have maintained control through much of the trading period.
MSTRB represents tokenized economic exposure to Strategy, a company widely followed because of its Bitcoin focused corporate treasury strategy. This means MSTRB can be influenced by several forces at once. Bitcoin market conditions matter, but so do equity market risk appetite, company specific developments, capital market sentiment and the premium or discount investors assign to Bitcoin related corporate exposure.
The latest price action suggests renewed demand, but traders should remember that high beta Bitcoin linked equities can move more sharply than Bitcoin itself during both positive and negative market phases. The current session volume is about 227.38K MSTRB, with turnover near $18.25M. That level of activity shows meaningful attention, but rapid gains near session highs can also bring short term volatility as participants react to changes in the wider crypto and equity environment.
CRCLB is trading near $49.98, up 4.10% in the current session. It opened near $48.01, reached a low of $47.69 and printed a high of $50.07. The session range is 4.99%, showing active but comparatively more measured trading than MSTRB. CRCLB is currently holding close to the upper end of its daily range, which indicates constructive short term momentum.
CRCLB provides tokenized exposure to Circle Internet Group. Its market narrative is closely connected to stablecoin adoption, payment infrastructure, regulatory developments and the expansion of digital finance. As stablecoins become a larger part of trading, settlement, remittances and onchain liquidity, companies operating around this infrastructure can attract significant market attention.
The current session volume is about 339.21K CRCLB, with turnover near $16.56M. This shows that the move is supported by active trading interest. Still, stablecoin related equities can react quickly to headlines involving regulation, partnerships, competitive developments and changes in the broader crypto market. A sustained recovery would depend on continued demand rather than a single positive session.
NVDAB is trading near $132.92, up 2.66% in the current session. It opened near $129.48, fell to $127.87 and reached a high of $133.19. The trading range is 4.16%, and price is holding close to the session high. Compared with MSTRB and CRCLB, NVDAB is posting the smallest percentage gain, yet it remains highly relevant because NVIDIA sits at the center of the AI infrastructure narrative.
NVDAB reflects tokenized economic exposure to NVIDIA, whose market attention is driven by data center demand, AI computing, GPU supply, cloud spending, enterprise adoption and the broader semiconductor cycle. The latest session volume is approximately 105.88K NVDAB, with turnover near $13.87M. The steady advance suggests buyers are active, although the relatively narrower gain compared with MSTRB and CRCLB may indicate a more balanced battle between buyers and sellers.
The larger takeaway is clear. MSTRB is leading the session with a 6.63% gain and the widest intraday range, making it the most volatile setup among the three. CRCLB is up 4.10%, supported by active turnover and the expanding stablecoin infrastructure narrative. NVDAB is up 2.66%, reflecting steady demand for AI related exposure while remaining linked to broader semiconductor and equity market sentiment.
MSTRB, CRCLB and NVDAB all offer different forms of tokenized market exposure. Their current momentum is constructive, but price strength alone is not enough to define a lasting trend. Sustained participation, broader market conditions and narrative durability will remain central to how these bStocks perform in the sessions ahead.
#MSTRB #CRCLB #NVDAB #bStocks #MarketAnalysis
$MSTRB
$CRCLB
$NVDAB
1
5
Ver traducción
SUI, Chainlink and Bittensor Market Analysis: Buyers Return, But the Bigger Trend Still Needs ProofThe latest crypto market session is showing renewed interest in SUI, Chainlink and Bittensor, with all three assets posting positive 24 hour performance. The recovery is attracting attention across Layer 1, oracle infrastructure and AI focused crypto narratives. Still, the current setup is more complex than a simple bullish breakout story.
SUI is trading near $0.6620, up +4.88% over the latest 24 hours, with a session range between $0.6257 and $0.6640. The move shows buyers responding after a period of sharp pressure. On the daily chart, SUI’s RSI has climbed to 26.83 from 19.28, meaning the asset is recovering from deeply oversold conditions. That is an important shift in short term momentum.
However, the broader technical picture remains cautious. SUI is still below its 7 day moving average of $0.6932, its 25 day moving average of $0.8017 and its 99 day moving average of $0.8875. Daily MACD remains bearish and SuperTrend is still pointed down. SUI is down 31.93% over the last 30 days, while current trading volume is only 0.41 times the 7 day average. This means the bounce has started, but it has not yet been accompanied by the sustained participation usually needed for a durable trend recovery.
The key point for SUI is whether this rebound can turn into repeated higher lows and stronger daily volume. Its latest capital flow is slightly positive, which is constructive, but momentum traders will be watching for continued demand rather than a single session reaction.
Chainlink is trading near $8.833, up +3.97% over the latest 24 hours. LINK reached a session high of $8.854 after opening at $8.496, showing steady intraday demand. The asset has also recorded positive daily capital inflow, with a 3.26% net inflow rate. This suggests that buyers are becoming more active as LINK attempts to stabilize.
LINK’s daily RSI has improved to 35.29 from 24.33, moving away from oversold conditions without entering an overheated zone. That gives the current recovery more balance than a purely momentum driven spike. Chainlink remains one of the most important infrastructure projects in crypto because of its role in connecting smart contracts with external data, tokenized assets and decentralized finance applications.
Yet price structure remains the main technical challenge. LINK is below its 7 day moving average of $8.94, 25 day moving average of $10.14 and 99 day moving average of $11.71. MACD remains bearish, while SuperTrend continues to indicate a daily downtrend. The token is down 26.15% over the last 30 days, and the current volume ratio is 0.46 versus its 7 day average.
This creates a realistic market picture. Chainlink is showing signs of stabilization and positive capital flow, but the recovery will need stronger volume and continued price acceptance before the broader bearish structure can be considered repaired.
Bittensor is trading near $190.6, up +5.36% over the latest 24 hours, after reaching $193.8 during the session. TAO is leading this group in daily percentage performance and continues to attract attention because of its exposure to the AI and decentralized machine intelligence narrative.
TAO’s daily RSI has increased to 42.28 from 34.54, showing that momentum is improving without signalling overbought conditions. It is also the strongest asset in this group over the last 7 days, up +3.70%, compared with SUI and LINK, which remain negative over the same period. TAO has recorded a daily net inflow rate of 26.59%, the strongest capital flow reading among the three assets. This points to notably stronger buyer participation in the current session.
Even with these constructive signs, TAO remains below its short, medium and long term moving averages. Its 7 day average is $190.26, while the 25 day and 99 day averages stand at $212.04 and $247.45. Daily MACD remains bearish and SuperTrend is still down. TAO is also down 25.98% over the last 30 days, while current volume is 0.35 times the 7 day average. The market is therefore seeing a recovery attempt, not a fully confirmed long term trend reversal.
The wider takeaway is that SUI, LINK and TAO are all benefiting from improved short term sentiment. SUI is rebounding from deeply oversold conditions, LINK is showing a more measured recovery supported by positive capital flow, and TAO is leading on relative momentum and inflows. At the same time, all three remain below key moving averages, with bearish MACD and SuperTrend readings still shaping the larger daily structure.
For traders monitoring these assets, the next phase will depend on follow through. Rising volume, continued positive capital flows and higher lows would support a more durable recovery narrative. If participation fades, short term rebounds may remain vulnerable to renewed volatility and profit taking.
#SuiNetwork #Chainlink #Bittensor #CryptoMarket #CryptoAnalysis
$SUI
{spot}(SUIUSDT)
$LINK
{spot}(LINKUSDT)
$TAO
{spot}(TAOUSDT)
SUI, Chainlink and Bittensor Market Analysis: Buyers Return, But the Bigger Trend Still Needs Proof
The latest crypto market session is showing renewed interest in SUI, Chainlink and Bittensor, with all three assets posting positive 24 hour performance. The recovery is attracting attention across Layer 1, oracle infrastructure and AI focused crypto narratives. Still, the current setup is more complex than a simple bullish breakout story.
SUI is trading near $0.6620, up +4.88% over the latest 24 hours, with a session range between $0.6257 and $0.6640. The move shows buyers responding after a period of sharp pressure. On the daily chart, SUI’s RSI has climbed to 26.83 from 19.28, meaning the asset is recovering from deeply oversold conditions. That is an important shift in short term momentum.
However, the broader technical picture remains cautious. SUI is still below its 7 day moving average of $0.6932, its 25 day moving average of $0.8017 and its 99 day moving average of $0.8875. Daily MACD remains bearish and SuperTrend is still pointed down. SUI is down 31.93% over the last 30 days, while current trading volume is only 0.41 times the 7 day average. This means the bounce has started, but it has not yet been accompanied by the sustained participation usually needed for a durable trend recovery.
The key point for SUI is whether this rebound can turn into repeated higher lows and stronger daily volume. Its latest capital flow is slightly positive, which is constructive, but momentum traders will be watching for continued demand rather than a single session reaction.
Chainlink is trading near $8.833, up +3.97% over the latest 24 hours. LINK reached a session high of $8.854 after opening at $8.496, showing steady intraday demand. The asset has also recorded positive daily capital inflow, with a 3.26% net inflow rate. This suggests that buyers are becoming more active as LINK attempts to stabilize.
LINK’s daily RSI has improved to 35.29 from 24.33, moving away from oversold conditions without entering an overheated zone. That gives the current recovery more balance than a purely momentum driven spike. Chainlink remains one of the most important infrastructure projects in crypto because of its role in connecting smart contracts with external data, tokenized assets and decentralized finance applications.
Yet price structure remains the main technical challenge. LINK is below its 7 day moving average of $8.94, 25 day moving average of $10.14 and 99 day moving average of $11.71. MACD remains bearish, while SuperTrend continues to indicate a daily downtrend. The token is down 26.15% over the last 30 days, and the current volume ratio is 0.46 versus its 7 day average.
This creates a realistic market picture. Chainlink is showing signs of stabilization and positive capital flow, but the recovery will need stronger volume and continued price acceptance before the broader bearish structure can be considered repaired.
Bittensor is trading near $190.6, up +5.36% over the latest 24 hours, after reaching $193.8 during the session. TAO is leading this group in daily percentage performance and continues to attract attention because of its exposure to the AI and decentralized machine intelligence narrative.
TAO’s daily RSI has increased to 42.28 from 34.54, showing that momentum is improving without signalling overbought conditions. It is also the strongest asset in this group over the last 7 days, up +3.70%, compared with SUI and LINK, which remain negative over the same period. TAO has recorded a daily net inflow rate of 26.59%, the strongest capital flow reading among the three assets. This points to notably stronger buyer participation in the current session.
Even with these constructive signs, TAO remains below its short, medium and long term moving averages. Its 7 day average is $190.26, while the 25 day and 99 day averages stand at $212.04 and $247.45. Daily MACD remains bearish and SuperTrend is still down. TAO is also down 25.98% over the last 30 days, while current volume is 0.35 times the 7 day average. The market is therefore seeing a recovery attempt, not a fully confirmed long term trend reversal.
The wider takeaway is that SUI, LINK and TAO are all benefiting from improved short term sentiment. SUI is rebounding from deeply oversold conditions, LINK is showing a more measured recovery supported by positive capital flow, and TAO is leading on relative momentum and inflows. At the same time, all three remain below key moving averages, with bearish MACD and SuperTrend readings still shaping the larger daily structure.
For traders monitoring these assets, the next phase will depend on follow through. Rising volume, continued positive capital flows and higher lows would support a more durable recovery narrative. If participation fades, short term rebounds may remain vulnerable to renewed volatility and profit taking.
#SuiNetwork #Chainlink #Bittensor #CryptoMarket #CryptoAnalysis
$SUI
$LINK
$TAO
SUI is trading near $0.6620, up +4.88% over the latest 24 hours, with a session range between $0.6257 and $0.6640. The move shows buyers responding after a period of sharp pressure. On the daily chart, SUI’s RSI has climbed to 26.83 from 19.28, meaning the asset is recovering from deeply oversold conditions. That is an important shift in short term momentum.
However, the broader technical picture remains cautious. SUI is still below its 7 day moving average of $0.6932, its 25 day moving average of $0.8017 and its 99 day moving average of $0.8875. Daily MACD remains bearish and SuperTrend is still pointed down. SUI is down 31.93% over the last 30 days, while current trading volume is only 0.41 times the 7 day average. This means the bounce has started, but it has not yet been accompanied by the sustained participation usually needed for a durable trend recovery.
The key point for SUI is whether this rebound can turn into repeated higher lows and stronger daily volume. Its latest capital flow is slightly positive, which is constructive, but momentum traders will be watching for continued demand rather than a single session reaction.
Chainlink is trading near $8.833, up +3.97% over the latest 24 hours. LINK reached a session high of $8.854 after opening at $8.496, showing steady intraday demand. The asset has also recorded positive daily capital inflow, with a 3.26% net inflow rate. This suggests that buyers are becoming more active as LINK attempts to stabilize.
LINK’s daily RSI has improved to 35.29 from 24.33, moving away from oversold conditions without entering an overheated zone. That gives the current recovery more balance than a purely momentum driven spike. Chainlink remains one of the most important infrastructure projects in crypto because of its role in connecting smart contracts with external data, tokenized assets and decentralized finance applications.
Yet price structure remains the main technical challenge. LINK is below its 7 day moving average of $8.94, 25 day moving average of $10.14 and 99 day moving average of $11.71. MACD remains bearish, while SuperTrend continues to indicate a daily downtrend. The token is down 26.15% over the last 30 days, and the current volume ratio is 0.46 versus its 7 day average.
This creates a realistic market picture. Chainlink is showing signs of stabilization and positive capital flow, but the recovery will need stronger volume and continued price acceptance before the broader bearish structure can be considered repaired.
Bittensor is trading near $190.6, up +5.36% over the latest 24 hours, after reaching $193.8 during the session. TAO is leading this group in daily percentage performance and continues to attract attention because of its exposure to the AI and decentralized machine intelligence narrative.
TAO’s daily RSI has increased to 42.28 from 34.54, showing that momentum is improving without signalling overbought conditions. It is also the strongest asset in this group over the last 7 days, up +3.70%, compared with SUI and LINK, which remain negative over the same period. TAO has recorded a daily net inflow rate of 26.59%, the strongest capital flow reading among the three assets. This points to notably stronger buyer participation in the current session.
Even with these constructive signs, TAO remains below its short, medium and long term moving averages. Its 7 day average is $190.26, while the 25 day and 99 day averages stand at $212.04 and $247.45. Daily MACD remains bearish and SuperTrend is still down. TAO is also down 25.98% over the last 30 days, while current volume is 0.35 times the 7 day average. The market is therefore seeing a recovery attempt, not a fully confirmed long term trend reversal.
The wider takeaway is that SUI, LINK and TAO are all benefiting from improved short term sentiment. SUI is rebounding from deeply oversold conditions, LINK is showing a more measured recovery supported by positive capital flow, and TAO is leading on relative momentum and inflows. At the same time, all three remain below key moving averages, with bearish MACD and SuperTrend readings still shaping the larger daily structure.
For traders monitoring these assets, the next phase will depend on follow through. Rising volume, continued positive capital flows and higher lows would support a more durable recovery narrative. If participation fades, short term rebounds may remain vulnerable to renewed volatility and profit taking.
#SuiNetwork #Chainlink #Bittensor #CryptoMarket #CryptoAnalysis
$SUI
$LINK
$TAO
1
35
Análisis de mercado de HYPE, DOGE y ADA: el impulso de recuperación cobra fuerza, pero la confirmación sigue siendo claveLa evolución más reciente del mercado cripto ha vuelto a centrar la atención en HYPE, DOGE y ADA, ya que los tres activos registran subidas en la sesión actual. El rebote es alentador tras varias semanas difíciles para las altcoins, pero la estructura técnica todavía exige cautela. Los precios se están recuperando de condiciones de sobreventa, aunque los indicadores de tendencia general siguen apuntando a la prudencia.
El entorno actual del mercado se define por una pugna conocida entre los compradores a corto plazo, que buscan oportunidades tras la venta masiva, y los vendedores, que aún dominan la tendencia diaria general. Para los operadores e inversores que siguen HYPE, Dogecoin y Cardano, la pregunta clave no es simplemente si los precios suben hoy. Lo más importante es si esta recuperación puede atraer un volumen sostenido, mayores entradas de capital y una secuencia de mínimos cada vez más altos.
Análisis de mercado de HYPE, DOGE y ADA: el impulso de recuperación cobra fuerza, pero la confirmación sigue siendo clave
La evolución más reciente del mercado cripto ha vuelto a centrar la atención en HYPE, DOGE y ADA, ya que los tres activos registran subidas en la sesión actual. El rebote es alentador tras varias semanas difíciles para las altcoins, pero la estructura técnica todavía exige cautela. Los precios se están recuperando de condiciones de sobreventa, aunque los indicadores de tendencia general siguen apuntando a la prudencia.
El entorno actual del mercado se define por una pugna conocida entre los compradores a corto plazo, que buscan oportunidades tras la venta masiva, y los vendedores, que aún dominan la tendencia diaria general. Para los operadores e inversores que siguen HYPE, Dogecoin y Cardano, la pregunta clave no es simplemente si los precios suben hoy. Lo más importante es si esta recuperación puede atraer un volumen sostenido, mayores entradas de capital y una secuencia de mínimos cada vez más altos.
El entorno actual del mercado se define por una pugna conocida entre los compradores a corto plazo, que buscan oportunidades tras la venta masiva, y los vendedores, que aún dominan la tendencia diaria general. Para los operadores e inversores que siguen HYPE, Dogecoin y Cardano, la pregunta clave no es simplemente si los precios suben hoy. Lo más importante es si esta recuperación puede atraer un volumen sostenido, mayores entradas de capital y una secuencia de mínimos cada vez más altos.
1
42
Análisis del mercado cripto de NEAR, UNI y ENA: un fuerte rebote se enfrenta a una dura prueba de tendenciaLa última sesión del mercado de criptomonedas ha traído un bienvenido rebote en varias altcoins, con ganancias notables de NEAR Protocol, Uniswap y Ethena. Las cifras en verde están atrayendo atención, y con razón. Sin embargo, lo que ocurre bajo la superficie es más complejo que un simple repunte de recuperación.
NEAR, UNI y ENA muestran un renovado interés comprador tras fuertes caídas de varias semanas. Su impulso diario ha mejorado, los flujos de capital se han vuelto positivos y los precios se han alejado de los mínimos recientes. Sin embargo, cada activo sigue por debajo de medias móviles clave, mientras que los indicadores diarios MACD y SuperTrend continúan mostrando estructuras generales bajistas. Esto hace que el movimiento actual sea importante, pero todavía no constituye un cambio de tendencia confirmado en el mercado.
Análisis del mercado cripto de NEAR, UNI y ENA: un fuerte rebote se enfrenta a una dura prueba de tendencia
La última sesión del mercado de criptomonedas ha traído un bienvenido rebote en varias altcoins, con ganancias notables de NEAR Protocol, Uniswap y Ethena. Las cifras en verde están atrayendo atención, y con razón. Sin embargo, lo que ocurre bajo la superficie es más complejo que un simple repunte de recuperación.
NEAR, UNI y ENA muestran un renovado interés comprador tras fuertes caídas de varias semanas. Su impulso diario ha mejorado, los flujos de capital se han vuelto positivos y los precios se han alejado de los mínimos recientes. Sin embargo, cada activo sigue por debajo de medias móviles clave, mientras que los indicadores diarios MACD y SuperTrend continúan mostrando estructuras generales bajistas. Esto hace que el movimiento actual sea importante, pero todavía no constituye un cambio de tendencia confirmado en el mercado.
NEAR, UNI y ENA muestran un renovado interés comprador tras fuertes caídas de varias semanas. Su impulso diario ha mejorado, los flujos de capital se han vuelto positivos y los precios se han alejado de los mínimos recientes. Sin embargo, cada activo sigue por debajo de medias móviles clave, mientras que los indicadores diarios MACD y SuperTrend continúan mostrando estructuras generales bajistas. Esto hace que el movimiento actual sea importante, pero todavía no constituye un cambio de tendencia confirmado en el mercado.
1
53
Análisis del mercado de SOL, ZEC y XRP: vuelve el impulso, pero confirmar la tendencia sigue siendo claveEl mercado de las criptomonedas muestra una actividad renovada, con Solana, Zcash y XRP al alza durante la sesión actual. El movimiento es alentador para el sentimiento a corto plazo, especialmente tras semanas de presión generalizada en el mercado, pero el panorama técnico todavía exige paciencia. Las velas verdes pueden atraer la atención rápidamente, pero para que el impulso sea sostenible se necesitan una demanda constante, un mayor volumen y pruebas de que la tendencia bajista general está perdiendo fuerza.
Solana cotiza actualmente cerca de los $70.81, con un alza del 3.72% en la sesión más reciente de 24 horas. SOL alcanzó un máximo intradía cercano a los $71.12, tras abrir alrededor de los $68.27, lo que muestra que los compradores intervinieron cuando el precio se acercó a niveles más bajos. El RSI diario actual se sitúa en 32.82, lo que refleja una mejora respecto a la debilidad reciente y sugiere que la presión vendedora ha comenzado a moderarse. Sin embargo, SOL sigue por debajo de sus medias móviles de 7, 25 y 99 días, y las lecturas bajistas del MACD y el SuperTrend siguen vigentes.
Análisis del mercado de SOL, ZEC y XRP: vuelve el impulso, pero confirmar la tendencia sigue siendo clave
El mercado de las criptomonedas muestra una actividad renovada, con Solana, Zcash y XRP al alza durante la sesión actual. El movimiento es alentador para el sentimiento a corto plazo, especialmente tras semanas de presión generalizada en el mercado, pero el panorama técnico todavía exige paciencia. Las velas verdes pueden atraer la atención rápidamente, pero para que el impulso sea sostenible se necesitan una demanda constante, un mayor volumen y pruebas de que la tendencia bajista general está perdiendo fuerza.
Solana cotiza actualmente cerca de los $70.81, con un alza del 3.72% en la sesión más reciente de 24 horas. SOL alcanzó un máximo intradía cercano a los $71.12, tras abrir alrededor de los $68.27, lo que muestra que los compradores intervinieron cuando el precio se acercó a niveles más bajos. El RSI diario actual se sitúa en 32.82, lo que refleja una mejora respecto a la debilidad reciente y sugiere que la presión vendedora ha comenzado a moderarse. Sin embargo, SOL sigue por debajo de sus medias móviles de 7, 25 y 99 días, y las lecturas bajistas del MACD y el SuperTrend siguen vigentes.
Solana cotiza actualmente cerca de los $70.81, con un alza del 3.72% en la sesión más reciente de 24 horas. SOL alcanzó un máximo intradía cercano a los $71.12, tras abrir alrededor de los $68.27, lo que muestra que los compradores intervinieron cuando el precio se acercó a niveles más bajos. El RSI diario actual se sitúa en 32.82, lo que refleja una mejora respecto a la debilidad reciente y sugiere que la presión vendedora ha comenzado a moderarse. Sin embargo, SOL sigue por debajo de sus medias móviles de 7, 25 y 99 días, y las lecturas bajistas del MACD y el SuperTrend siguen vigentes.
1
67
Actualización del mercado de BTC, ETH y BNB: un rebote de alivio, pero la confirmación de tendencia sigue siendo claveEl mercado cripto muestra hoy una renovada fortaleza: Bitcoin, Ethereum y BNB suben tras un período de intensa presión vendedora. La acción reciente de los precios refleja una mejora del sentimiento a corto plazo, pero la estructura técnica general aún exige paciencia, confirmación del volumen y una gestión disciplinada del riesgo.
Bitcoin cotiza cerca de los 60.981 $, con una subida del 5,35 % en las últimas 24 horas, después de alcanzar un máximo intradía de 61.365 $. BTC se ha recuperado desde la parte baja de su rango reciente, lo que demuestra que los compradores están volviendo a entrar tras una fuerte caída. El RSI diario ha subido hasta 27,70 desde niveles de sobreventa profunda, lo que indica que el impulso vendedor se ha moderado. Sin embargo, BTC sigue por debajo de sus medias móviles de 7, 25 y 99 días, mientras que el MACD y el SuperTrend continúan en territorio bajista. Esto significa que la recuperación actual es positiva, pero aún no confirma una reversión completa de la tendencia. El mercado estará atento a si Bitcoin puede sostener la demanda por encima de la zona de los 60.000 $ y recuperar impulso gradualmente con una mayor participación.
Actualización del mercado de BTC, ETH y BNB: un rebote de alivio, pero la confirmación de tendencia sigue siendo clave
El mercado cripto muestra hoy una renovada fortaleza: Bitcoin, Ethereum y BNB suben tras un período de intensa presión vendedora. La acción reciente de los precios refleja una mejora del sentimiento a corto plazo, pero la estructura técnica general aún exige paciencia, confirmación del volumen y una gestión disciplinada del riesgo.
Bitcoin cotiza cerca de los 60.981 $, con una subida del 5,35 % en las últimas 24 horas, después de alcanzar un máximo intradía de 61.365 $. BTC se ha recuperado desde la parte baja de su rango reciente, lo que demuestra que los compradores están volviendo a entrar tras una fuerte caída. El RSI diario ha subido hasta 27,70 desde niveles de sobreventa profunda, lo que indica que el impulso vendedor se ha moderado. Sin embargo, BTC sigue por debajo de sus medias móviles de 7, 25 y 99 días, mientras que el MACD y el SuperTrend continúan en territorio bajista. Esto significa que la recuperación actual es positiva, pero aún no confirma una reversión completa de la tendencia. El mercado estará atento a si Bitcoin puede sostener la demanda por encima de la zona de los 60.000 $ y recuperar impulso gradualmente con una mayor participación.
Bitcoin cotiza cerca de los 60.981 $, con una subida del 5,35 % en las últimas 24 horas, después de alcanzar un máximo intradía de 61.365 $. BTC se ha recuperado desde la parte baja de su rango reciente, lo que demuestra que los compradores están volviendo a entrar tras una fuerte caída. El RSI diario ha subido hasta 27,70 desde niveles de sobreventa profunda, lo que indica que el impulso vendedor se ha moderado. Sin embargo, BTC sigue por debajo de sus medias móviles de 7, 25 y 99 días, mientras que el MACD y el SuperTrend continúan en territorio bajista. Esto significa que la recuperación actual es positiva, pero aún no confirma una reversión completa de la tendencia. El mercado estará atento a si Bitcoin puede sostener la demanda por encima de la zona de los 60.000 $ y recuperar impulso gradualmente con una mayor participación.
1
85
BULLA sube un 12.5%, pero pierde impulso cerca de $0.015 tras el rechazo en los máximosBULLA cotiza a $0.015061, con una subida de aproximadamente el 12.57% en el día, tras un fuerte avance que se topó con presión vendedora cerca del máximo. Esta es una vista del token en cadena, por lo que los datos difieren ligeramente de los de un par estándar de un exchange.
Esto es lo que muestra el gráfico de 1 h:
El rango: BULLA pasó de un mínimo de 24 h de $0.013243 a un máximo de $0.016043, una variación de aproximadamente el 21% de abajo arriba. El gráfico muestra una subida gradual durante las primeras horas, seguida de una fuerte aceleración antes de que el precio alcanzara su máximo y empezara a retroceder.
La tendencia: El precio está justo en la MA(7), en $0.015129, y por encima de la MA(25), en $0.014121, y de la MA(99), en $0.013652. Las tres medias tienen una pendiente ascendente, lo que mantiene alcista la estructura general, pero ahora el precio está poniendo a prueba la media más corta como soporte.
BULLA sube un 12.5%, pero pierde impulso cerca de $0.015 tras el rechazo en los máximos
BULLA cotiza a $0.015061, con una subida de aproximadamente el 12.57% en el día, tras un fuerte avance que se topó con presión vendedora cerca del máximo. Esta es una vista del token en cadena, por lo que los datos difieren ligeramente de los de un par estándar de un exchange.
Esto es lo que muestra el gráfico de 1 h:
El rango: BULLA pasó de un mínimo de 24 h de $0.013243 a un máximo de $0.016043, una variación de aproximadamente el 21% de abajo arriba. El gráfico muestra una subida gradual durante las primeras horas, seguida de una fuerte aceleración antes de que el precio alcanzara su máximo y empezara a retroceder.
La tendencia: El precio está justo en la MA(7), en $0.015129, y por encima de la MA(25), en $0.014121, y de la MA(99), en $0.013652. Las tres medias tienen una pendiente ascendente, lo que mantiene alcista la estructura general, pero ahora el precio está poniendo a prueba la media más corta como soporte.
Esto es lo que muestra el gráfico de 1 h:
El rango: BULLA pasó de un mínimo de 24 h de $0.013243 a un máximo de $0.016043, una variación de aproximadamente el 21% de abajo arriba. El gráfico muestra una subida gradual durante las primeras horas, seguida de una fuerte aceleración antes de que el precio alcanzara su máximo y empezara a retroceder.
La tendencia: El precio está justo en la MA(7), en $0.015129, y por encima de la MA(25), en $0.014121, y de la MA(99), en $0.013652. Las tres medias tienen una pendiente ascendente, lo que mantiene alcista la estructura general, pero ahora el precio está poniendo a prueba la media más corta como soporte.
5
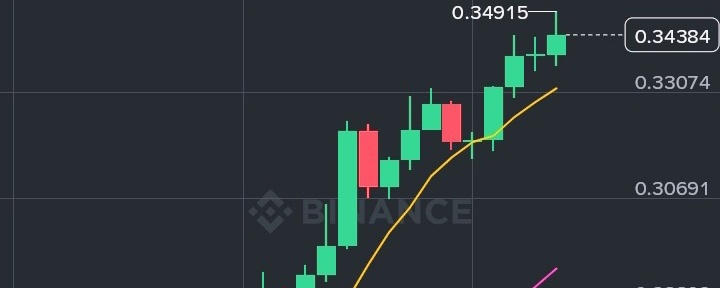
Artículo
Derive (DRV) se dispara un 40 % y se acerca a los 0,35 $ en una potente y sostenida tendencia alcistaDerive cotiza a 0,34384 $, con una subida de alrededor del 40,75 % en el día, tras un ascenso sostenido que lo ha llevado muy por encima de su rango anterior. Esta es una vista del token en cadena, por lo que los datos difieren ligeramente de los de un par estándar de exchange.
Esto es lo que muestra el gráfico de 1 h:
El rango: DRV pasó de un mínimo de 24 h de 0,24343 $ a un máximo de 0,34915 $, una variación de aproximadamente el 43 % de abajo arriba. El gráfico muestra un tramo inicial tranquilo y lateral, seguido de una larga serie de máximos y mínimos cada vez más altos que apenas ha hecho una pausa desde entonces.
Derive (DRV) se dispara un 40 % y se acerca a los 0,35 $ en una potente y sostenida tendencia alcista
Derive cotiza a 0,34384 $, con una subida de alrededor del 40,75 % en el día, tras un ascenso sostenido que lo ha llevado muy por encima de su rango anterior. Esta es una vista del token en cadena, por lo que los datos difieren ligeramente de los de un par estándar de exchange.
Esto es lo que muestra el gráfico de 1 h:
El rango: DRV pasó de un mínimo de 24 h de 0,24343 $ a un máximo de 0,34915 $, una variación de aproximadamente el 43 % de abajo arriba. El gráfico muestra un tramo inicial tranquilo y lateral, seguido de una larga serie de máximos y mínimos cada vez más altos que apenas ha hecho una pausa desde entonces.
Esto es lo que muestra el gráfico de 1 h:
El rango: DRV pasó de un mínimo de 24 h de 0,24343 $ a un máximo de 0,34915 $, una variación de aproximadamente el 43 % de abajo arriba. El gráfico muestra un tramo inicial tranquilo y lateral, seguido de una larga serie de máximos y mínimos cada vez más altos que apenas ha hecho una pausa desde entonces.
4
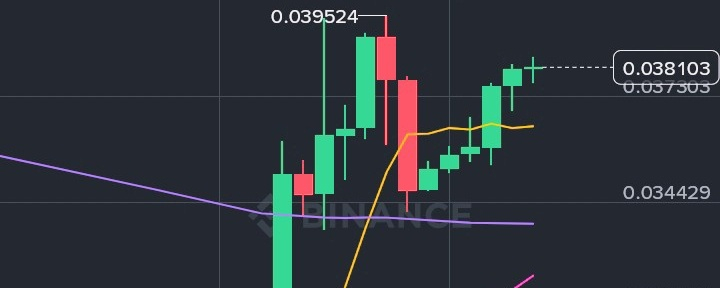
Artículo
SKYAI se dispara un 31% en 24 horas tras una ruptura explosiva y se mantiene por encima de $0.038SKYAI cotiza a $0.03805, con una subida aproximada del 31.63% en el día, tras una ruptura explosiva desde un rango tranquilo y descendente. Esta es una vista del token en cadena, por lo que los datos difieren ligeramente de los de un par estándar de exchange.
Esto es lo que muestra el gráfico de 1 h:
El rango: SKYAI pasó de un mínimo de 24 h de $0.026459 a un máximo de $0.039499, una variación de aproximadamente el 49% de mínimo a máximo. El gráfico muestra un descenso lento y constante al principio, seguido de una enorme vela verde que impulsó el movimiento.
La tendencia: El precio está por encima de las tres medias móviles: la MA(7) en $0.036495, la MA(25) en $0.032417 y la MA(99) en $0.033836. Las medias más cortas han girado bruscamente al alza, y el precio ha recuperado claramente la MA(99), un cambio constructivo tras la tendencia bajista anterior.
SKYAI se dispara un 31% en 24 horas tras una ruptura explosiva y se mantiene por encima de $0.038
SKYAI cotiza a $0.03805, con una subida aproximada del 31.63% en el día, tras una ruptura explosiva desde un rango tranquilo y descendente. Esta es una vista del token en cadena, por lo que los datos difieren ligeramente de los de un par estándar de exchange.
Esto es lo que muestra el gráfico de 1 h:
El rango: SKYAI pasó de un mínimo de 24 h de $0.026459 a un máximo de $0.039499, una variación de aproximadamente el 49% de mínimo a máximo. El gráfico muestra un descenso lento y constante al principio, seguido de una enorme vela verde que impulsó el movimiento.
La tendencia: El precio está por encima de las tres medias móviles: la MA(7) en $0.036495, la MA(25) en $0.032417 y la MA(99) en $0.033836. Las medias más cortas han girado bruscamente al alza, y el precio ha recuperado claramente la MA(99), un cambio constructivo tras la tendencia bajista anterior.
Esto es lo que muestra el gráfico de 1 h:
El rango: SKYAI pasó de un mínimo de 24 h de $0.026459 a un máximo de $0.039499, una variación de aproximadamente el 49% de mínimo a máximo. El gráfico muestra un descenso lento y constante al principio, seguido de una enorme vela verde que impulsó el movimiento.
La tendencia: El precio está por encima de las tres medias móviles: la MA(7) en $0.036495, la MA(25) en $0.032417 y la MA(99) en $0.033836. Las medias más cortas han girado bruscamente al alza, y el precio ha recuperado claramente la MA(99), un cambio constructivo tras la tendencia bajista anterior.
8
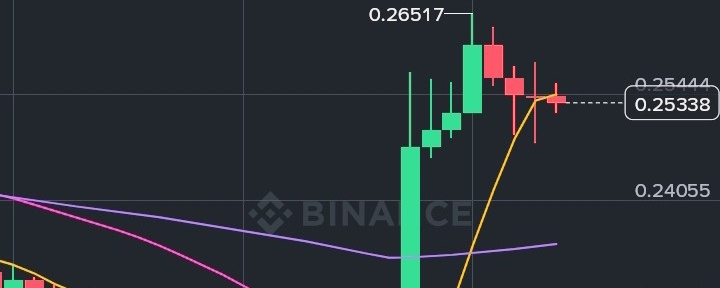
Artículo
Magma Finance (MAGMA) sube un 10 % tras una brusca reversión en forma de VMagma Finance cotiza a $0.25338, con una subida de aproximadamente el 10.21 % en el día, tras una reversión drástica que llevó el precio de una caída sostenida a una ruptura brusca. Esta es una vista del token en cadena, por lo que los datos difieren ligeramente de los de un par de intercambio estándar.
Esto es lo que muestra el gráfico de 1 h:
El rango: MAGMA pasó de un mínimo de 24 h de $0.2007 a un máximo de $0.26899, una variación de aproximadamente el 34 % de abajo arriba. El gráfico muestra un descenso largo y gradual durante las primeras horas, seguido de una recuperación violenta en forma de V, impulsada por una vela verde muy grande.
Magma Finance (MAGMA) sube un 10 % tras una brusca reversión en forma de V
Magma Finance cotiza a $0.25338, con una subida de aproximadamente el 10.21 % en el día, tras una reversión drástica que llevó el precio de una caída sostenida a una ruptura brusca. Esta es una vista del token en cadena, por lo que los datos difieren ligeramente de los de un par de intercambio estándar.
Esto es lo que muestra el gráfico de 1 h:
El rango: MAGMA pasó de un mínimo de 24 h de $0.2007 a un máximo de $0.26899, una variación de aproximadamente el 34 % de abajo arriba. El gráfico muestra un descenso largo y gradual durante las primeras horas, seguido de una recuperación violenta en forma de V, impulsada por una vela verde muy grande.
Esto es lo que muestra el gráfico de 1 h:
El rango: MAGMA pasó de un mínimo de 24 h de $0.2007 a un máximo de $0.26899, una variación de aproximadamente el 34 % de abajo arriba. El gráfico muestra un descenso largo y gradual durante las primeras horas, seguido de una recuperación violenta en forma de V, impulsada por una vela verde muy grande.
8
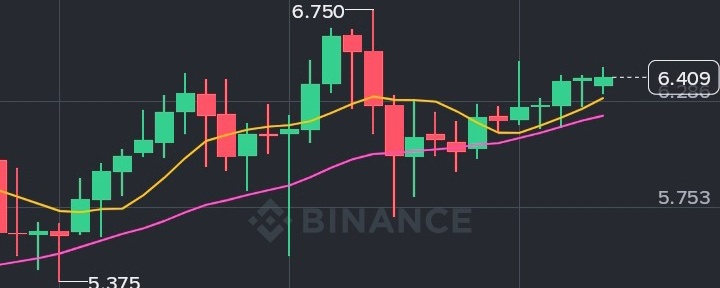
Artículo
EVAA (EVAA) sube un 10.6% y se mantiene por encima de $6.40 tras una sesión volátilEVAA cotiza a $6.40427, con una subida de aproximadamente el 10.61% en el día, tras una sesión irregular con fuertes oscilaciones en ambas direcciones. Esta es una vista del token en cadena, por lo que los datos difieren ligeramente de los de un par estándar de exchange.
Esto es lo que muestra el gráfico de 1 h:
El rango: EVAA pasó de un mínimo de 24 h de $5.23959 a un máximo de $7.18606, con una variación de aproximadamente el 37% de abajo arriba. El gráfico muestra una subida inicial hasta la zona de $6.75, un rechazo brusco y un retroceso, seguido de una recuperación constante que vuelve a impulsar el precio al alza.
EVAA (EVAA) sube un 10.6% y se mantiene por encima de $6.40 tras una sesión volátil
EVAA cotiza a $6.40427, con una subida de aproximadamente el 10.61% en el día, tras una sesión irregular con fuertes oscilaciones en ambas direcciones. Esta es una vista del token en cadena, por lo que los datos difieren ligeramente de los de un par estándar de exchange.
Esto es lo que muestra el gráfico de 1 h:
El rango: EVAA pasó de un mínimo de 24 h de $5.23959 a un máximo de $7.18606, con una variación de aproximadamente el 37% de abajo arriba. El gráfico muestra una subida inicial hasta la zona de $6.75, un rechazo brusco y un retroceso, seguido de una recuperación constante que vuelve a impulsar el precio al alza.
Esto es lo que muestra el gráfico de 1 h:
El rango: EVAA pasó de un mínimo de 24 h de $5.23959 a un máximo de $7.18606, con una variación de aproximadamente el 37% de abajo arriba. El gráfico muestra una subida inicial hasta la zona de $6.75, un rechazo brusco y un retroceso, seguido de una recuperación constante que vuelve a impulsar el precio al alza.
9
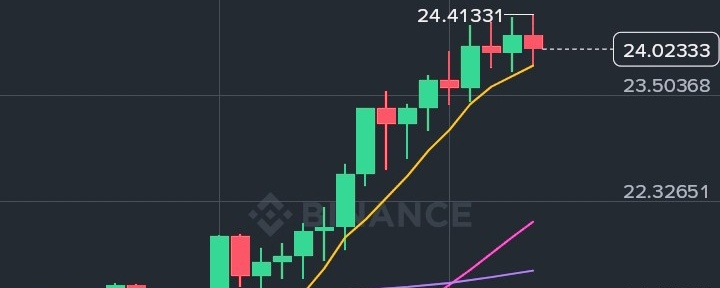
Artículo
Venice Token (VVV) sube un 18 % y se mantiene por encima de los 24 $ en una tendencia alcista constante y ordenadaVenice Token cotiza a 24,02 $, con una subida de aproximadamente el 18,47 % en el día, tras un ascenso sostenido que lo ha alejado bastante de su rango anterior. Esta es una vista del token en cadena, por lo que los datos difieren ligeramente de los de un par estándar de exchange.
Esto es lo que muestra el gráfico de 1 h:
El rango: VVV pasó de un mínimo de 19,63 $ en 24 h a un máximo de 24,41 $, una oscilación de aproximadamente el 24 % de mínimo a máximo. El gráfico muestra un tramo inicial irregular y lateral, seguido de una vela de ruptura alcista contundente y una serie de máximos y mínimos cada vez más altos desde entonces.
Venice Token (VVV) sube un 18 % y se mantiene por encima de los 24 $ en una tendencia alcista constante y ordenada
Venice Token cotiza a 24,02 $, con una subida de aproximadamente el 18,47 % en el día, tras un ascenso sostenido que lo ha alejado bastante de su rango anterior. Esta es una vista del token en cadena, por lo que los datos difieren ligeramente de los de un par estándar de exchange.
Esto es lo que muestra el gráfico de 1 h:
El rango: VVV pasó de un mínimo de 19,63 $ en 24 h a un máximo de 24,41 $, una oscilación de aproximadamente el 24 % de mínimo a máximo. El gráfico muestra un tramo inicial irregular y lateral, seguido de una vela de ruptura alcista contundente y una serie de máximos y mínimos cada vez más altos desde entonces.
Esto es lo que muestra el gráfico de 1 h:
El rango: VVV pasó de un mínimo de 19,63 $ en 24 h a un máximo de 24,41 $, una oscilación de aproximadamente el 24 % de mínimo a máximo. El gráfico muestra un tramo inicial irregular y lateral, seguido de una vela de ruptura alcista contundente y una serie de máximos y mínimos cada vez más altos desde entonces.
4
DGrid AI (DGAI) sube un 12% y se acerca a $0.79 en una tendencia alcista sostenidaDGrid AI cotiza a $0.7843, con una subida de aproximadamente el 11.94% en el día, tras una ruptura clara de un rango lateral tranquilo. Esta es una vista del token en cadena, por lo que los datos difieren ligeramente de los de un par estándar de exchange.
Esto es lo que muestra el gráfico de 1H:
El rango: DGAI pasó de un mínimo de 24 h de $0.6827 a un máximo de $0.79276, una variación de aproximadamente el 16% de abajo arriba. Durante las primeras horas, el precio se movió lateralmente en torno a $0.70, antes de que los compradores tomaran el control e impulsaran una subida sostenida.
La tendencia: El precio está por encima de todas las medias móviles: la MA(7), en $0.75662; la MA(25), en $0.71719; y la MA(99), en $0.70398. Las tres apuntan al alza, y el reciente cruce de las medias más cortas por encima de la MA(99) es una señal favorable para la tendencia.
DGrid AI (DGAI) sube un 12% y se acerca a $0.79 en una tendencia alcista sostenida
DGrid AI cotiza a $0.7843, con una subida de aproximadamente el 11.94% en el día, tras una ruptura clara de un rango lateral tranquilo. Esta es una vista del token en cadena, por lo que los datos difieren ligeramente de los de un par estándar de exchange.
Esto es lo que muestra el gráfico de 1H:
El rango: DGAI pasó de un mínimo de 24 h de $0.6827 a un máximo de $0.79276, una variación de aproximadamente el 16% de abajo arriba. Durante las primeras horas, el precio se movió lateralmente en torno a $0.70, antes de que los compradores tomaran el control e impulsaran una subida sostenida.
La tendencia: El precio está por encima de todas las medias móviles: la MA(7), en $0.75662; la MA(25), en $0.71719; y la MA(99), en $0.70398. Las tres apuntan al alza, y el reciente cruce de las medias más cortas por encima de la MA(99) es una señal favorable para la tendencia.
Esto es lo que muestra el gráfico de 1H:
El rango: DGAI pasó de un mínimo de 24 h de $0.6827 a un máximo de $0.79276, una variación de aproximadamente el 16% de abajo arriba. Durante las primeras horas, el precio se movió lateralmente en torno a $0.70, antes de que los compradores tomaran el control e impulsaran una subida sostenida.
La tendencia: El precio está por encima de todas las medias móviles: la MA(7), en $0.75662; la MA(25), en $0.71719; y la MA(99), en $0.70398. Las tres apuntan al alza, y el reciente cruce de las medias más cortas por encima de la MA(99) es una señal favorable para la tendencia.
8
Inicia sesión para explorar más contenidos
Únete a usuarios de criptomonedas de todo el mundo en Binance Square
⚡️ Obtén la información más reciente y útil sobre criptomonedas.
💬 Confía en el mayor exchange de criptomonedas del mundo.
👍 Descubre opiniones reales de creadores verificados.
Correo electrónico/número de teléfono
Temas en tendencia
BTCReboundsAbove$60KAmidWhaleDipBuying
34,591 visualizaciones
195 participa(n) en el debate
Abraxas Capital y otras ballenas compran la caída de BTC mientras Bitcoin recupera brevemente los 60.000 dólares
Binance News
·31 «Me gusta»
·48.2k visualizaciones
SolanaSets2027RoadmapToDoubleComputeCapacity
18,264 visualizaciones
472 participa(n) en el debate
CaliforniaNvidiaProbeExaminesPotentialCriminalViolations
4,806 visualizaciones
62 participa(n) en el debate