
芷若Zhǐruò
445 Publicaciones

芷若Zhǐruò
Denunciar
Bloquear usuario
Decoding market movements so you don't have to. Actionable crypto analysis, key levels, and risk management tips.🚀 Follow for daily market breakdowns & tradin
13 Siguiendo
6 Seguidores
6 Me gusta
Publicaciones
·
--
Bajista
Ver traducción
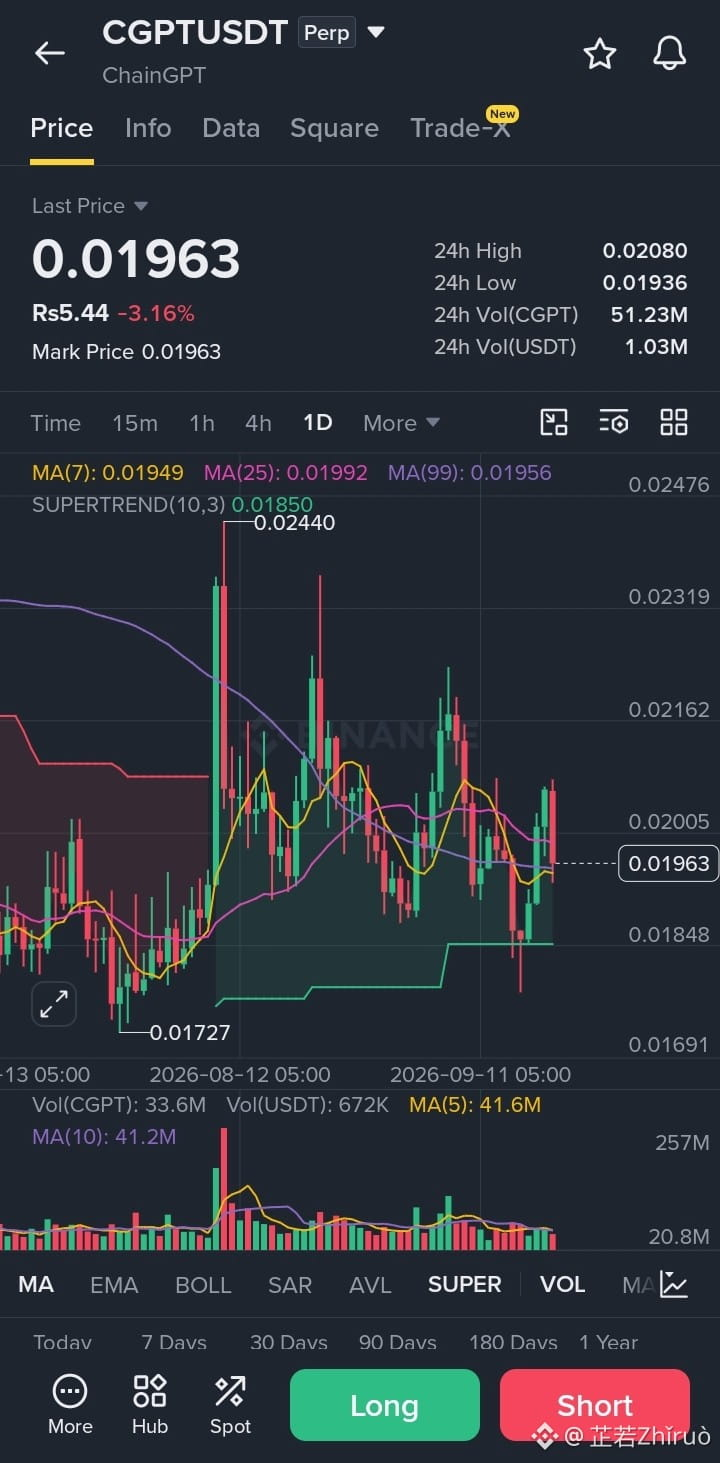
Based on the $CGPT
{future}(CGPTUSDT)
USDT (ChainGPT) 1-Day chart:
Current Price & Moving Averages
* Last / Mark Price: 0.01963 USDT
* MA(7) [Yellow]: 0.01949 USDT
* MA(25) [Pink]: 0.01992 USDT
* MA(99) [Purple]: 0.01956 USDT
Price action is squeezed in a tight cluster right around its moving averages, holding just above the MA(7) (0.01949) and MA(99) (0.01956), but facing immediate ceiling resistance at the MA(25) (0.01992).
Technical Indicators & Key Levels
* Supertrend (10, 3): Located at 0.01850 (Green line). Because the current price remains above this line, the Supertrend indicates an active bullish bias on the 1D timeframe.
* Immediate Resistance Levels:
* 0.01992 (MA25 dynamic resistance)
* 0.02080 (24h High and local spike peak)
* 0.02162 – 0.02319 (Intermediary high resistance zone)
* 0.02440 (Major historical spike high)
* Immediate Support Levels:
* 0.01956 (MA99 structural support)
* 0.01949 (MA7 short-term support)
* 0.01850 (Supertrend key trend support)
* 0.01727 (Major bottom swing low)
Trend Assessment
* Market Structure: CGPT is experiencing tight compression across all three moving averages (0.01949 – 0.01992). Tight consolidations like this typically precede a volatility expansion or strong directional move.
* Key Battle Zone: The range between 0.01956 (MA99) and 0.01992 (MA25) represents the critical breakout threshold.
* Outlook:
* Bullish Breakout: A daily candle close above 0.01992 (MA25) clears the path for a retest of 0.02080 and potential movement toward 0.02162+.
* Bearish Retest: Failing to hold above the 0.01949–0.01956 support band risks a slide back toward the 0.01850 Supertrend baseline.#BuffettStepsDownAsBerkshireChairman #SaylorHintsStrategyBitcoinBuy
Based on the $CGPT
USDT (ChainGPT) 1-Day chart:
Current Price & Moving Averages
* Last / Mark Price: 0.01963 USDT
* MA(7) [Yellow]: 0.01949 USDT
* MA(25) [Pink]: 0.01992 USDT
* MA(99) [Purple]: 0.01956 USDT
Price action is squeezed in a tight cluster right around its moving averages, holding just above the MA(7) (0.01949) and MA(99) (0.01956), but facing immediate ceiling resistance at the MA(25) (0.01992).
Technical Indicators & Key Levels
* Supertrend (10, 3): Located at 0.01850 (Green line). Because the current price remains above this line, the Supertrend indicates an active bullish bias on the 1D timeframe.
* Immediate Resistance Levels:
* 0.01992 (MA25 dynamic resistance)
* 0.02080 (24h High and local spike peak)
* 0.02162 – 0.02319 (Intermediary high resistance zone)
* 0.02440 (Major historical spike high)
* Immediate Support Levels:
* 0.01956 (MA99 structural support)
* 0.01949 (MA7 short-term support)
* 0.01850 (Supertrend key trend support)
* 0.01727 (Major bottom swing low)
Trend Assessment
* Market Structure: CGPT is experiencing tight compression across all three moving averages (0.01949 – 0.01992). Tight consolidations like this typically precede a volatility expansion or strong directional move.
* Key Battle Zone: The range between 0.01956 (MA99) and 0.01992 (MA25) represents the critical breakout threshold.
* Outlook:
* Bullish Breakout: A daily candle close above 0.01992 (MA25) clears the path for a retest of 0.02080 and potential movement toward 0.02162+.
* Bearish Retest: Failing to hold above the 0.01949–0.01956 support band risks a slide back toward the 0.01850 Supertrend baseline.#BuffettStepsDownAsBerkshireChairman #SaylorHintsStrategyBitcoinBuy
USDT (ChainGPT) 1-Day chart:
Current Price & Moving Averages
* Last / Mark Price: 0.01963 USDT
* MA(7) [Yellow]: 0.01949 USDT
* MA(25) [Pink]: 0.01992 USDT
* MA(99) [Purple]: 0.01956 USDT
Price action is squeezed in a tight cluster right around its moving averages, holding just above the MA(7) (0.01949) and MA(99) (0.01956), but facing immediate ceiling resistance at the MA(25) (0.01992).
Technical Indicators & Key Levels
* Supertrend (10, 3): Located at 0.01850 (Green line). Because the current price remains above this line, the Supertrend indicates an active bullish bias on the 1D timeframe.
* Immediate Resistance Levels:
* 0.01992 (MA25 dynamic resistance)
* 0.02080 (24h High and local spike peak)
* 0.02162 – 0.02319 (Intermediary high resistance zone)
* 0.02440 (Major historical spike high)
* Immediate Support Levels:
* 0.01956 (MA99 structural support)
* 0.01949 (MA7 short-term support)
* 0.01850 (Supertrend key trend support)
* 0.01727 (Major bottom swing low)
Trend Assessment
* Market Structure: CGPT is experiencing tight compression across all three moving averages (0.01949 – 0.01992). Tight consolidations like this typically precede a volatility expansion or strong directional move.
* Key Battle Zone: The range between 0.01956 (MA99) and 0.01992 (MA25) represents the critical breakout threshold.
* Outlook:
* Bullish Breakout: A daily candle close above 0.01992 (MA25) clears the path for a retest of 0.02080 and potential movement toward 0.02162+.
* Bearish Retest: Failing to hold above the 0.01949–0.01956 support band risks a slide back toward the 0.01850 Supertrend baseline.#BuffettStepsDownAsBerkshireChairman #SaylorHintsStrategyBitcoinBuy
1
·
--
Bajista
Ver traducción
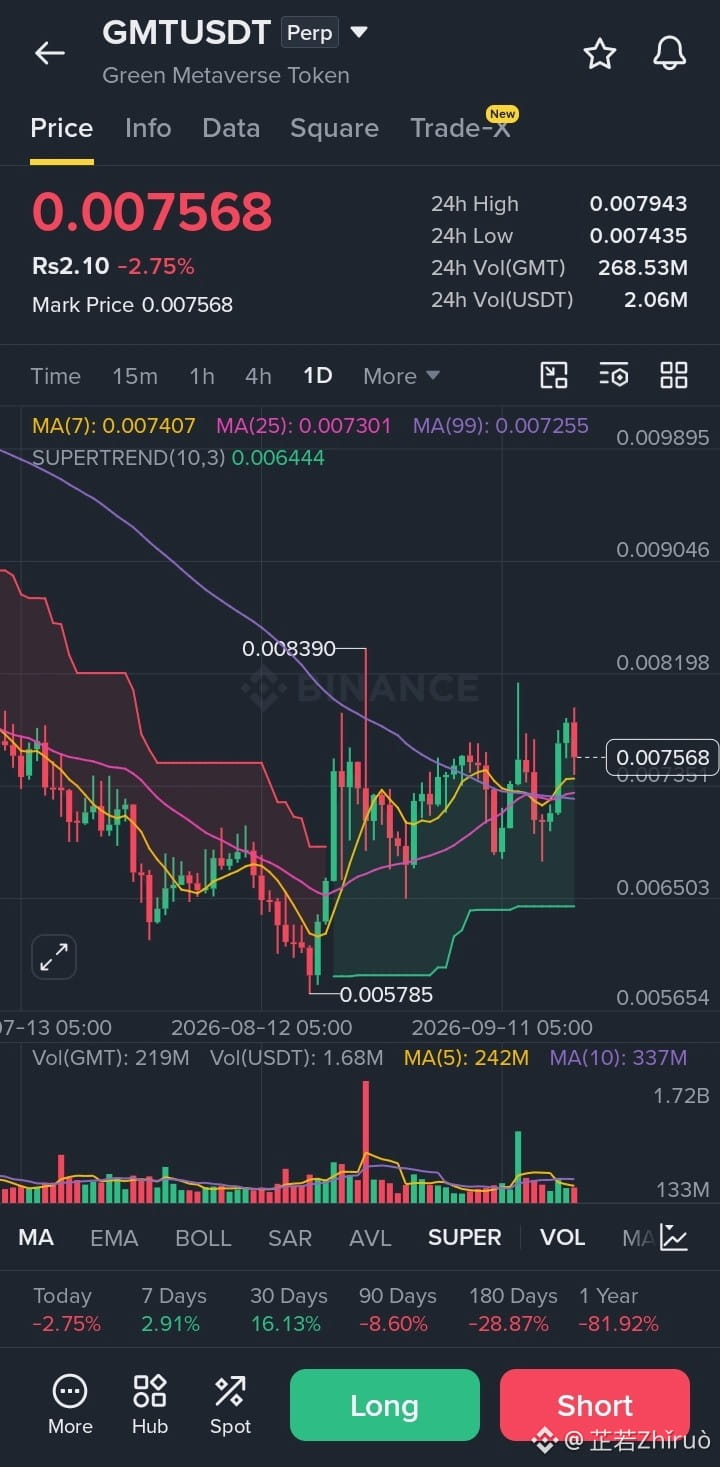
Based on the $GMT
{future}(GMTUSDT)
USDT (Green Metaverse Token) 1-Day chart:
Current Price & Moving Averages
* Last / Mark Price: 0.007568 USDT
* MA(7) [Yellow]: 0.007407 USDT
* MA(25) [Pink]: 0.007301 USDT
* MA(99) [Purple]: 0.007255 USDT
Price action is currently holding above all three major moving averages (MA7, MA25, and MA99), indicating short-to-medium-term bullish alignment.
Technical Indicators & Key Levels
* Supertrend (10, 3): Located at 0.006444 (Green line). Since the price is well above this indicator line, the Supertrend signals an active bullish trend on the daily timeframe.
* Immediate Support Levels:
* 0.007407 (MA7 dynamic support)
* 0.007301 (MA25 dynamic support)
* 0.007255 (MA99 structural support line)
* 0.006444 (Supertrend key support line)
* 0.005785 (Major bottom swing low)
* Immediate Resistance Levels & Targets:
* 0.007943 (24h High level / local peak resistance)
* 0.008390 (Previous major swing peak high)
* 0.009046 (Higher structural chart target)
Trend Assessment
* Market Structure: After bottoming out at 0.005785, GMTUSDT initiated a gradual recovery pattern, successfully reclaiming the MA99 (0.007255) and forming a series of higher swing lows.
* Key Battle Zone: The current price is pulling back slightly after testing resistance near 0.007943. The cluster of moving averages between 0.007255 and 0.007407 forms a dense support confluence.
* Outlook:
* Bullish Scenario: Holding above the 0.007255–0.007407 support cluster keeps the momentum intact for a retest of 0.007943 and a breakout attempt toward 0.008390.
* Bearish Scenario: A breakdown below 0.007255 (MA99) would invalidate the short-term bullish structure and expose the lower support toward 0.006444.#BTCBreaks80K #XRPExchangeReservesHitSevenYearLow
Based on the $GMT
USDT (Green Metaverse Token) 1-Day chart:
Current Price & Moving Averages
* Last / Mark Price: 0.007568 USDT
* MA(7) [Yellow]: 0.007407 USDT
* MA(25) [Pink]: 0.007301 USDT
* MA(99) [Purple]: 0.007255 USDT
Price action is currently holding above all three major moving averages (MA7, MA25, and MA99), indicating short-to-medium-term bullish alignment.
Technical Indicators & Key Levels
* Supertrend (10, 3): Located at 0.006444 (Green line). Since the price is well above this indicator line, the Supertrend signals an active bullish trend on the daily timeframe.
* Immediate Support Levels:
* 0.007407 (MA7 dynamic support)
* 0.007301 (MA25 dynamic support)
* 0.007255 (MA99 structural support line)
* 0.006444 (Supertrend key support line)
* 0.005785 (Major bottom swing low)
* Immediate Resistance Levels & Targets:
* 0.007943 (24h High level / local peak resistance)
* 0.008390 (Previous major swing peak high)
* 0.009046 (Higher structural chart target)
Trend Assessment
* Market Structure: After bottoming out at 0.005785, GMTUSDT initiated a gradual recovery pattern, successfully reclaiming the MA99 (0.007255) and forming a series of higher swing lows.
* Key Battle Zone: The current price is pulling back slightly after testing resistance near 0.007943. The cluster of moving averages between 0.007255 and 0.007407 forms a dense support confluence.
* Outlook:
* Bullish Scenario: Holding above the 0.007255–0.007407 support cluster keeps the momentum intact for a retest of 0.007943 and a breakout attempt toward 0.008390.
* Bearish Scenario: A breakdown below 0.007255 (MA99) would invalidate the short-term bullish structure and expose the lower support toward 0.006444.#BTCBreaks80K #XRPExchangeReservesHitSevenYearLow
USDT (Green Metaverse Token) 1-Day chart:
Current Price & Moving Averages
* Last / Mark Price: 0.007568 USDT
* MA(7) [Yellow]: 0.007407 USDT
* MA(25) [Pink]: 0.007301 USDT
* MA(99) [Purple]: 0.007255 USDT
Price action is currently holding above all three major moving averages (MA7, MA25, and MA99), indicating short-to-medium-term bullish alignment.
Technical Indicators & Key Levels
* Supertrend (10, 3): Located at 0.006444 (Green line). Since the price is well above this indicator line, the Supertrend signals an active bullish trend on the daily timeframe.
* Immediate Support Levels:
* 0.007407 (MA7 dynamic support)
* 0.007301 (MA25 dynamic support)
* 0.007255 (MA99 structural support line)
* 0.006444 (Supertrend key support line)
* 0.005785 (Major bottom swing low)
* Immediate Resistance Levels & Targets:
* 0.007943 (24h High level / local peak resistance)
* 0.008390 (Previous major swing peak high)
* 0.009046 (Higher structural chart target)
Trend Assessment
* Market Structure: After bottoming out at 0.005785, GMTUSDT initiated a gradual recovery pattern, successfully reclaiming the MA99 (0.007255) and forming a series of higher swing lows.
* Key Battle Zone: The current price is pulling back slightly after testing resistance near 0.007943. The cluster of moving averages between 0.007255 and 0.007407 forms a dense support confluence.
* Outlook:
* Bullish Scenario: Holding above the 0.007255–0.007407 support cluster keeps the momentum intact for a retest of 0.007943 and a breakout attempt toward 0.008390.
* Bearish Scenario: A breakdown below 0.007255 (MA99) would invalidate the short-term bullish structure and expose the lower support toward 0.006444.#BTCBreaks80K #XRPExchangeReservesHitSevenYearLow
2
·
--
Bajista
Ver traducción
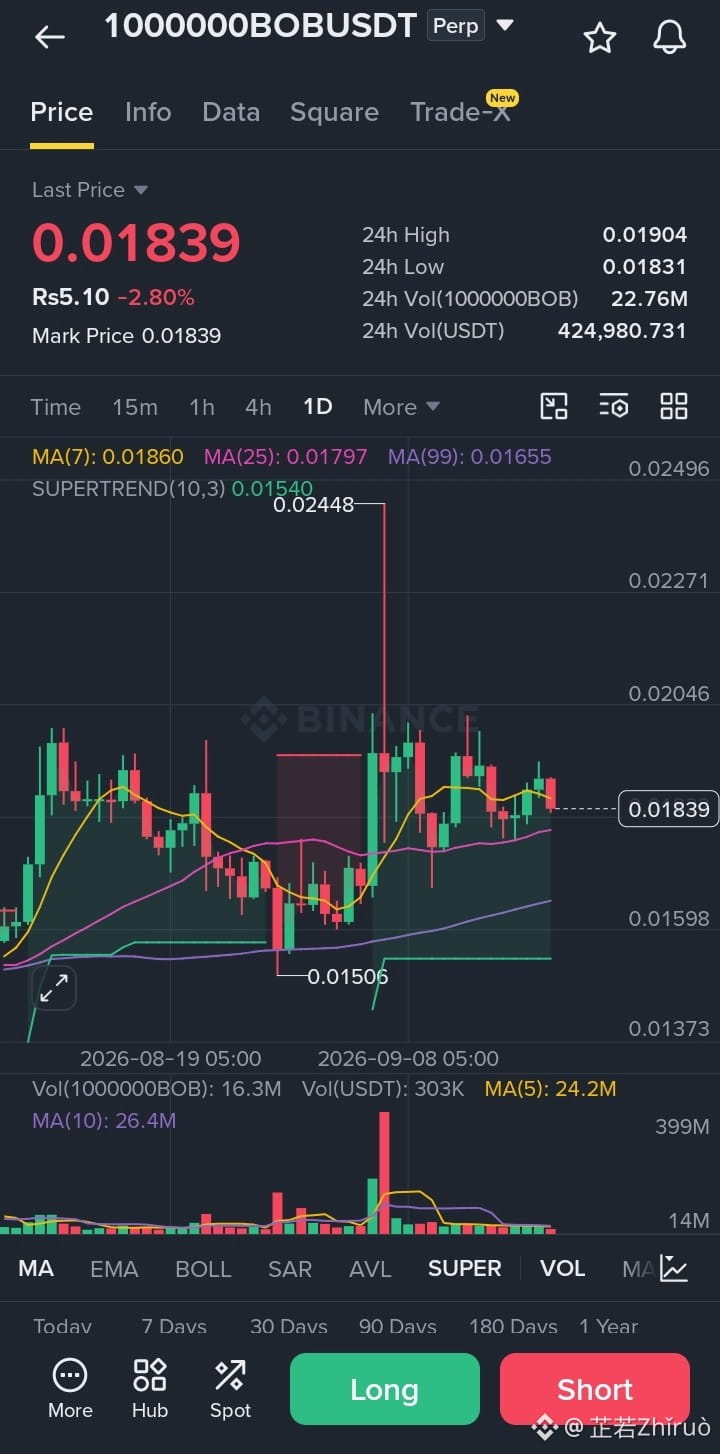
Based on the $1000000BOB
{future}(1000000BOBUSDT)
USDT 1-Day chart:
Current Price & Moving Averages
* Last / Mark Price: 0.01839 USDT
* MA(7) [Yellow]: 0.01860 USDT
* MA(25) [Pink]: 0.01797 USDT
* MA(99) [Purple]: 0.01655 USDT
The price is currently consolidating between short-term dynamic support at the MA(25) (0.01797) and short-term resistance at the MA(7) (0.01860).
Technical Indicators & Key Levels
* Supertrend (10, 3): Sitting at 0.01540 (Green line). Because the price action remains well above this level, the Supertrend indicates an active bullish bias on the 1D timeframe.
* Immediate Resistance Levels:
* 0.01860 (MA7 dynamic resistance)
* 0.01904 (24h High level)
* 0.02046 (Overhead swing resistance)
* 0.02448 (Major spike high)
* Immediate Support Levels:
* 0.01797 (MA25 dynamic support)
* 0.01655 (MA99 structural support)
* 0.01540 (Supertrend key trend support)
* 0.01506 (Major local swing low)
Trend Assessment
* Market Structure: After hitting a peak at 0.02448, price pulled back and has been ranging sideways in a tightening consolidation phase.
* Key Battle Zone: The tight range between 0.01797 (MA25) and 0.01860 (MA7) forms the immediate compression zone.
* Outlook:
* Bullish Expansion: A daily close above 0.01860 (MA7) is required to push toward 0.01904 and retest higher resistance levels near 0.02046.
* Bearish Retest: A break below 0.01797 (MA25) could trigger a pullback to test the 0.01655 (MA99) or 0.01540 (Supertrend) support levels.#BTCBreaks80K #SaylorHintsStrategyBitcoinBuy
Based on the $1000000BOB
USDT 1-Day chart:
Current Price & Moving Averages
* Last / Mark Price: 0.01839 USDT
* MA(7) [Yellow]: 0.01860 USDT
* MA(25) [Pink]: 0.01797 USDT
* MA(99) [Purple]: 0.01655 USDT
The price is currently consolidating between short-term dynamic support at the MA(25) (0.01797) and short-term resistance at the MA(7) (0.01860).
Technical Indicators & Key Levels
* Supertrend (10, 3): Sitting at 0.01540 (Green line). Because the price action remains well above this level, the Supertrend indicates an active bullish bias on the 1D timeframe.
* Immediate Resistance Levels:
* 0.01860 (MA7 dynamic resistance)
* 0.01904 (24h High level)
* 0.02046 (Overhead swing resistance)
* 0.02448 (Major spike high)
* Immediate Support Levels:
* 0.01797 (MA25 dynamic support)
* 0.01655 (MA99 structural support)
* 0.01540 (Supertrend key trend support)
* 0.01506 (Major local swing low)
Trend Assessment
* Market Structure: After hitting a peak at 0.02448, price pulled back and has been ranging sideways in a tightening consolidation phase.
* Key Battle Zone: The tight range between 0.01797 (MA25) and 0.01860 (MA7) forms the immediate compression zone.
* Outlook:
* Bullish Expansion: A daily close above 0.01860 (MA7) is required to push toward 0.01904 and retest higher resistance levels near 0.02046.
* Bearish Retest: A break below 0.01797 (MA25) could trigger a pullback to test the 0.01655 (MA99) or 0.01540 (Supertrend) support levels.#BTCBreaks80K #SaylorHintsStrategyBitcoinBuy
USDT 1-Day chart:
Current Price & Moving Averages
* Last / Mark Price: 0.01839 USDT
* MA(7) [Yellow]: 0.01860 USDT
* MA(25) [Pink]: 0.01797 USDT
* MA(99) [Purple]: 0.01655 USDT
The price is currently consolidating between short-term dynamic support at the MA(25) (0.01797) and short-term resistance at the MA(7) (0.01860).
Technical Indicators & Key Levels
* Supertrend (10, 3): Sitting at 0.01540 (Green line). Because the price action remains well above this level, the Supertrend indicates an active bullish bias on the 1D timeframe.
* Immediate Resistance Levels:
* 0.01860 (MA7 dynamic resistance)
* 0.01904 (24h High level)
* 0.02046 (Overhead swing resistance)
* 0.02448 (Major spike high)
* Immediate Support Levels:
* 0.01797 (MA25 dynamic support)
* 0.01655 (MA99 structural support)
* 0.01540 (Supertrend key trend support)
* 0.01506 (Major local swing low)
Trend Assessment
* Market Structure: After hitting a peak at 0.02448, price pulled back and has been ranging sideways in a tightening consolidation phase.
* Key Battle Zone: The tight range between 0.01797 (MA25) and 0.01860 (MA7) forms the immediate compression zone.
* Outlook:
* Bullish Expansion: A daily close above 0.01860 (MA7) is required to push toward 0.01904 and retest higher resistance levels near 0.02046.
* Bearish Retest: A break below 0.01797 (MA25) could trigger a pullback to test the 0.01655 (MA99) or 0.01540 (Supertrend) support levels.#BTCBreaks80K #SaylorHintsStrategyBitcoinBuy
4
·
--
Bajista
Ver traducción
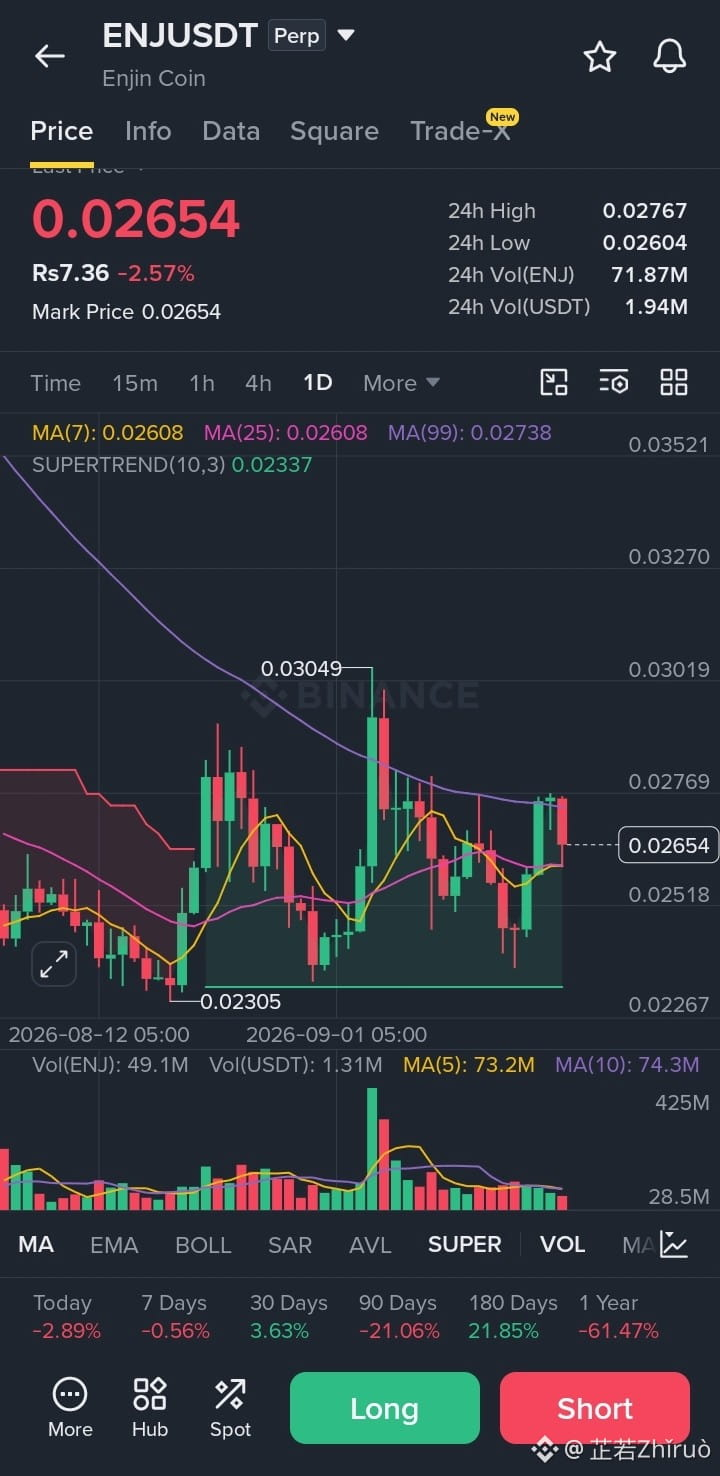
Based on the $ENJ
{future}(ENJUSDT)
USDT (Enjin Coin) 1-Day chart:
Current Price & Moving Averages
* Last / Mark Price: 0.02654 USDT
* MA(7) [Yellow]: 0.02608 USDT
* MA(25) [Pink]: 0.02608 USDT
* MA(99) [Purple]: 0.02738 USDT
The price is holding slightly above the converging short-to-medium moving averages (MA7 and MA25 at 0.02608), while remaining restricted below the long-term MA99 (0.02738).
Technical Indicators & Key Levels
* Supertrend (10, 3): Positioned at 0.02337 (Green line). Because the price action remains well above this indicator level, the Supertrend indicates an active bullish bias on the 1D timeframe.
* Immediate Resistance Levels:
* 0.02738 (MA99 dynamic overhead resistance)
* 0.02767 (24h High level)
* 0.03049 (Major recent swing peak high)
* Immediate Support Levels:
* 0.02608 (Confluence support of MA7 and MA25)
* 0.02518 (Local swing consolidation support)
* 0.02337 (Supertrend key support line)
* 0.02305 (Major bottom swing low)
Trend Assessment
* Market Structure: The pair is ranging in a consolidation zone between 0.02518 and 0.02767. The recent rejection off the MA(99) area indicates overhead selling pressure remains active.
* Key Battle Zone: The range around 0.02738 – 0.02767 forms the immediate hurdle.
* Outlook:
* Bullish Breakout: A daily candle close above 0.02738 (MA99) is required to trigger a push toward the 0.03049 peak.
* Bearish Retest: Failing to defend the 0.02608 support band could lead to a decline toward the 0.02337 Supertrend baseline.#HKCompletesFirstHKDStablecoinUseCase #BTCBreaks80K
Based on the $ENJ
USDT (Enjin Coin) 1-Day chart:
Current Price & Moving Averages
* Last / Mark Price: 0.02654 USDT
* MA(7) [Yellow]: 0.02608 USDT
* MA(25) [Pink]: 0.02608 USDT
* MA(99) [Purple]: 0.02738 USDT
The price is holding slightly above the converging short-to-medium moving averages (MA7 and MA25 at 0.02608), while remaining restricted below the long-term MA99 (0.02738).
Technical Indicators & Key Levels
* Supertrend (10, 3): Positioned at 0.02337 (Green line). Because the price action remains well above this indicator level, the Supertrend indicates an active bullish bias on the 1D timeframe.
* Immediate Resistance Levels:
* 0.02738 (MA99 dynamic overhead resistance)
* 0.02767 (24h High level)
* 0.03049 (Major recent swing peak high)
* Immediate Support Levels:
* 0.02608 (Confluence support of MA7 and MA25)
* 0.02518 (Local swing consolidation support)
* 0.02337 (Supertrend key support line)
* 0.02305 (Major bottom swing low)
Trend Assessment
* Market Structure: The pair is ranging in a consolidation zone between 0.02518 and 0.02767. The recent rejection off the MA(99) area indicates overhead selling pressure remains active.
* Key Battle Zone: The range around 0.02738 – 0.02767 forms the immediate hurdle.
* Outlook:
* Bullish Breakout: A daily candle close above 0.02738 (MA99) is required to trigger a push toward the 0.03049 peak.
* Bearish Retest: Failing to defend the 0.02608 support band could lead to a decline toward the 0.02337 Supertrend baseline.#HKCompletesFirstHKDStablecoinUseCase #BTCBreaks80K
USDT (Enjin Coin) 1-Day chart:
Current Price & Moving Averages
* Last / Mark Price: 0.02654 USDT
* MA(7) [Yellow]: 0.02608 USDT
* MA(25) [Pink]: 0.02608 USDT
* MA(99) [Purple]: 0.02738 USDT
The price is holding slightly above the converging short-to-medium moving averages (MA7 and MA25 at 0.02608), while remaining restricted below the long-term MA99 (0.02738).
Technical Indicators & Key Levels
* Supertrend (10, 3): Positioned at 0.02337 (Green line). Because the price action remains well above this indicator level, the Supertrend indicates an active bullish bias on the 1D timeframe.
* Immediate Resistance Levels:
* 0.02738 (MA99 dynamic overhead resistance)
* 0.02767 (24h High level)
* 0.03049 (Major recent swing peak high)
* Immediate Support Levels:
* 0.02608 (Confluence support of MA7 and MA25)
* 0.02518 (Local swing consolidation support)
* 0.02337 (Supertrend key support line)
* 0.02305 (Major bottom swing low)
Trend Assessment
* Market Structure: The pair is ranging in a consolidation zone between 0.02518 and 0.02767. The recent rejection off the MA(99) area indicates overhead selling pressure remains active.
* Key Battle Zone: The range around 0.02738 – 0.02767 forms the immediate hurdle.
* Outlook:
* Bullish Breakout: A daily candle close above 0.02738 (MA99) is required to trigger a push toward the 0.03049 peak.
* Bearish Retest: Failing to defend the 0.02608 support band could lead to a decline toward the 0.02337 Supertrend baseline.#HKCompletesFirstHKDStablecoinUseCase #BTCBreaks80K
7
·
--
Bajista
Ver traducción
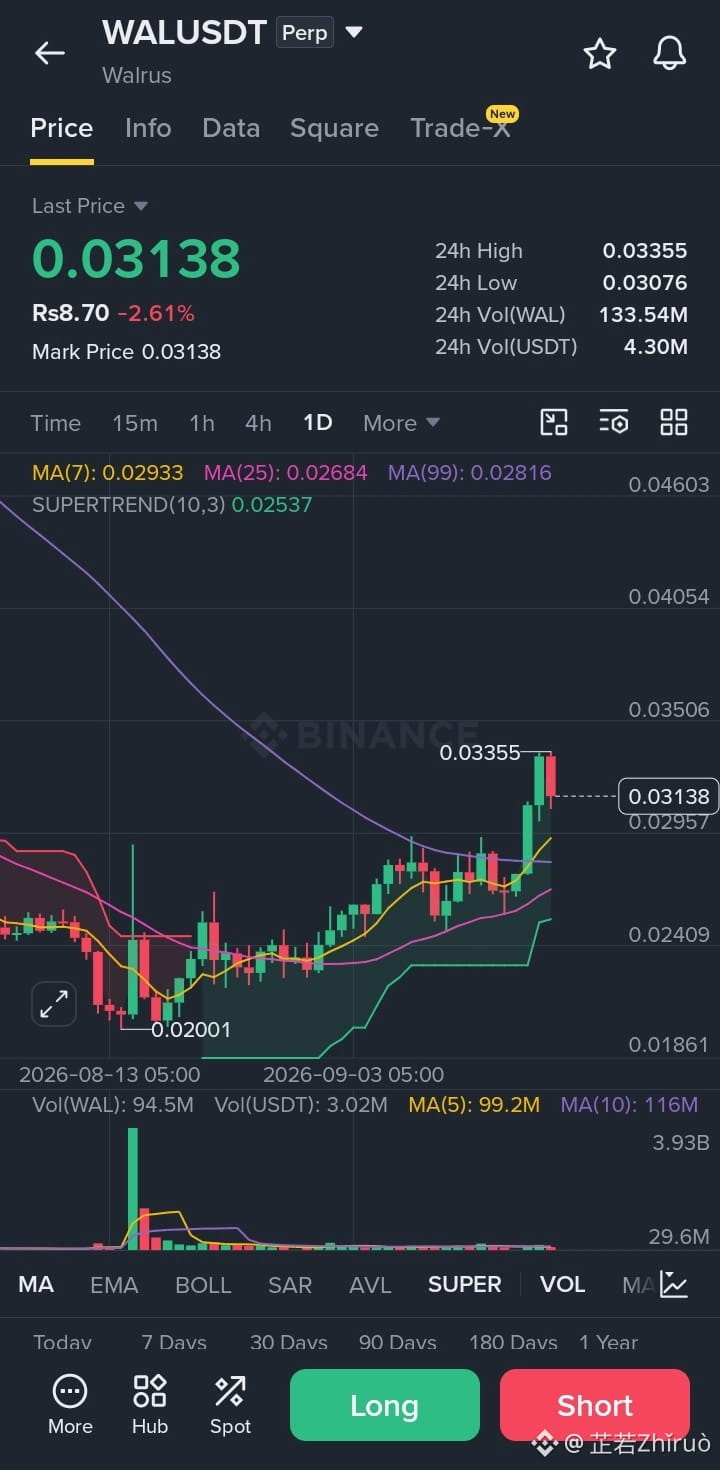
Based on the $WAL
{future}(WALUSDT)
USDT (Walrus) 1-Day chart:
Current Price & Moving Averages
* Last / Mark Price: 0.03138 USDT
* MA(7) [Yellow]: 0.02933 USDT
* MA(25) [Pink]: 0.02684 USDT
* MA(99) [Purple]: 0.02816 USDT
Price action has staged a strong breakout, holding above all major moving averages (MA7, MA25, and MA99), which confirms strong short-to-medium-term bullish momentum.
Technical Indicators & Key Levels
* Supertrend (10, 3): Positioned at 0.02537 (Green line). Since the indicator line sits well below the current price, the Supertrend reflects an active bullish signal on the daily timeframe.
* Immediate Resistance Levels & Targets:
* 0.03355 (24h High and recent breakout peak)
* 0.03506 (Next overhead price level)
* 0.04054 – 0.04603 (Higher swing targets from early chart history)
* Immediate Support Levels:
* 0.02933 (MA7 dynamic support)
* 0.02816 (MA99 structural support)
* 0.02684 (MA25 key support level)
* 0.02537 (Supertrend key trend support)
* 0.02001 (Major bottom swing low)
Trend Assessment
* Market Structure: Following a prolonged decline, WALUSDT established a local bottom around 0.02001 and initiated a series of higher highs and higher lows, culminating in a violent breakout above the 99-day moving average.
* Key Level to Watch: The recent peak at 0.03355 is the immediate barrier. A daily close above this level opens a path toward 0.03506 and higher extension levels.
* Outlook:
* Bullish Scenario: Retaining support above 0.02933 (MA7) keeps the momentum intact for another push to test 0.03355+.
* Pullback Scenario: If a short-term cooling occurs, key defensive support lies in the 0.02816–0.02933 band (MA99 and MA7).#VietnamPlansFirstCryptoLicensesIn2026 #SOLJumpsAbout10%
Based on the $WAL
USDT (Walrus) 1-Day chart:
Current Price & Moving Averages
* Last / Mark Price: 0.03138 USDT
* MA(7) [Yellow]: 0.02933 USDT
* MA(25) [Pink]: 0.02684 USDT
* MA(99) [Purple]: 0.02816 USDT
Price action has staged a strong breakout, holding above all major moving averages (MA7, MA25, and MA99), which confirms strong short-to-medium-term bullish momentum.
Technical Indicators & Key Levels
* Supertrend (10, 3): Positioned at 0.02537 (Green line). Since the indicator line sits well below the current price, the Supertrend reflects an active bullish signal on the daily timeframe.
* Immediate Resistance Levels & Targets:
* 0.03355 (24h High and recent breakout peak)
* 0.03506 (Next overhead price level)
* 0.04054 – 0.04603 (Higher swing targets from early chart history)
* Immediate Support Levels:
* 0.02933 (MA7 dynamic support)
* 0.02816 (MA99 structural support)
* 0.02684 (MA25 key support level)
* 0.02537 (Supertrend key trend support)
* 0.02001 (Major bottom swing low)
Trend Assessment
* Market Structure: Following a prolonged decline, WALUSDT established a local bottom around 0.02001 and initiated a series of higher highs and higher lows, culminating in a violent breakout above the 99-day moving average.
* Key Level to Watch: The recent peak at 0.03355 is the immediate barrier. A daily close above this level opens a path toward 0.03506 and higher extension levels.
* Outlook:
* Bullish Scenario: Retaining support above 0.02933 (MA7) keeps the momentum intact for another push to test 0.03355+.
* Pullback Scenario: If a short-term cooling occurs, key defensive support lies in the 0.02816–0.02933 band (MA99 and MA7).#VietnamPlansFirstCryptoLicensesIn2026 #SOLJumpsAbout10%
USDT (Walrus) 1-Day chart:
Current Price & Moving Averages
* Last / Mark Price: 0.03138 USDT
* MA(7) [Yellow]: 0.02933 USDT
* MA(25) [Pink]: 0.02684 USDT
* MA(99) [Purple]: 0.02816 USDT
Price action has staged a strong breakout, holding above all major moving averages (MA7, MA25, and MA99), which confirms strong short-to-medium-term bullish momentum.
Technical Indicators & Key Levels
* Supertrend (10, 3): Positioned at 0.02537 (Green line). Since the indicator line sits well below the current price, the Supertrend reflects an active bullish signal on the daily timeframe.
* Immediate Resistance Levels & Targets:
* 0.03355 (24h High and recent breakout peak)
* 0.03506 (Next overhead price level)
* 0.04054 – 0.04603 (Higher swing targets from early chart history)
* Immediate Support Levels:
* 0.02933 (MA7 dynamic support)
* 0.02816 (MA99 structural support)
* 0.02684 (MA25 key support level)
* 0.02537 (Supertrend key trend support)
* 0.02001 (Major bottom swing low)
Trend Assessment
* Market Structure: Following a prolonged decline, WALUSDT established a local bottom around 0.02001 and initiated a series of higher highs and higher lows, culminating in a violent breakout above the 99-day moving average.
* Key Level to Watch: The recent peak at 0.03355 is the immediate barrier. A daily close above this level opens a path toward 0.03506 and higher extension levels.
* Outlook:
* Bullish Scenario: Retaining support above 0.02933 (MA7) keeps the momentum intact for another push to test 0.03355+.
* Pullback Scenario: If a short-term cooling occurs, key defensive support lies in the 0.02816–0.02933 band (MA99 and MA7).#VietnamPlansFirstCryptoLicensesIn2026 #SOLJumpsAbout10%
7
·
--
Bajista
Ver traducción
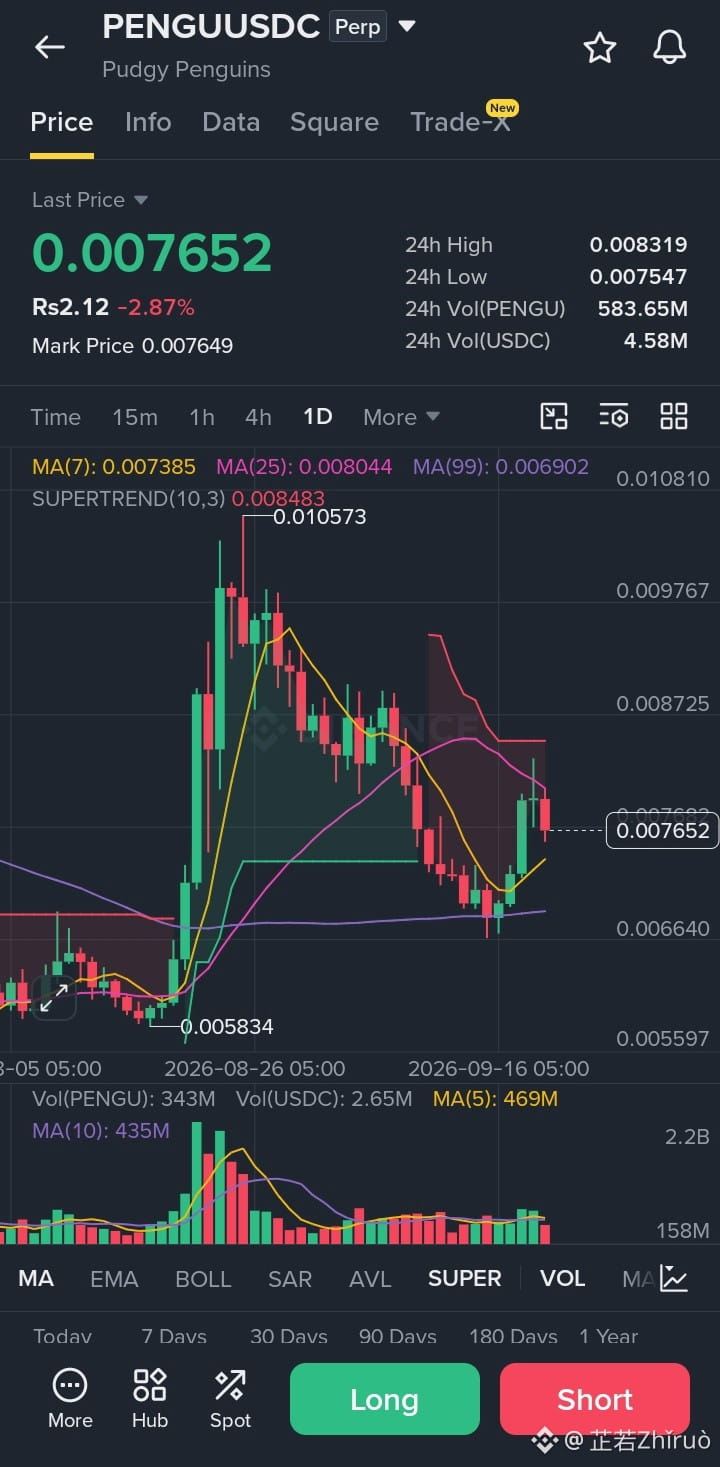
Based on the $PENGU
{future}(PENGUUSDT)
USDC (Pudgy Penguins) 1-Day chart:
Current Price & Moving Averages
* Last / Mark Price: 0.007652 USDC (Mark: 0.007649)
* MA(7) [Yellow]: 0.007385 USDC
* MA(25) [Pink]: 0.008044 USDC
* MA(99) [Purple]: 0.006902 USDC
Price action is currently sandwiched between the short-term MA(7) acting as immediate support below and the MA(25) acting as resistance overhead.
Technical Indicators & Key Levels
* Supertrend (10, 3): Sitting at 0.008483 (Red line). Because the Supertrend band sits above the current price, the overall indicator signals a bearish trend on the 1D timeframe.
* Immediate Support Levels:
* 0.007385 (MA7 dynamic support)
* 0.006902 (MA99 key long-term dynamic support)
* 0.005834 (Major swing low base)
* Immediate Resistance Levels & Targets:
* 0.008044 (MA25 dynamic resistance)
* 0.008319 (24h High level)
* 0.008483 (Supertrend resistance line)
* 0.010573 (Major historical peak high)
Trend Assessment
* Market Structure: After a massive surge towards 0.010573, the pair underwent a protracted correction down to test the MA(99) near 0.0069. It recently produced a bounce off that major moving average, but is struggling to reclaim higher resistance zones.
* Key Battle Zone: The area between 0.00804 and 0.00848 forms a major overhead resistance cluster (MA25 + Supertrend).
* Outlook:
* Bullish Scenario: A daily close above 0.00804 (MA25) would open up a test of the 0.00848 Supertrend line.
* Bearish Scenario: Rejection at current levels could see price retest the 0.00738 support, with key macro defense at the 0.00690 MA99 line.#BTCBreaks80K #SOLJumpsAbout10%
Based on the $PENGU
USDC (Pudgy Penguins) 1-Day chart:
Current Price & Moving Averages
* Last / Mark Price: 0.007652 USDC (Mark: 0.007649)
* MA(7) [Yellow]: 0.007385 USDC
* MA(25) [Pink]: 0.008044 USDC
* MA(99) [Purple]: 0.006902 USDC
Price action is currently sandwiched between the short-term MA(7) acting as immediate support below and the MA(25) acting as resistance overhead.
Technical Indicators & Key Levels
* Supertrend (10, 3): Sitting at 0.008483 (Red line). Because the Supertrend band sits above the current price, the overall indicator signals a bearish trend on the 1D timeframe.
* Immediate Support Levels:
* 0.007385 (MA7 dynamic support)
* 0.006902 (MA99 key long-term dynamic support)
* 0.005834 (Major swing low base)
* Immediate Resistance Levels & Targets:
* 0.008044 (MA25 dynamic resistance)
* 0.008319 (24h High level)
* 0.008483 (Supertrend resistance line)
* 0.010573 (Major historical peak high)
Trend Assessment
* Market Structure: After a massive surge towards 0.010573, the pair underwent a protracted correction down to test the MA(99) near 0.0069. It recently produced a bounce off that major moving average, but is struggling to reclaim higher resistance zones.
* Key Battle Zone: The area between 0.00804 and 0.00848 forms a major overhead resistance cluster (MA25 + Supertrend).
* Outlook:
* Bullish Scenario: A daily close above 0.00804 (MA25) would open up a test of the 0.00848 Supertrend line.
* Bearish Scenario: Rejection at current levels could see price retest the 0.00738 support, with key macro defense at the 0.00690 MA99 line.#BTCBreaks80K #SOLJumpsAbout10%
USDC (Pudgy Penguins) 1-Day chart:
Current Price & Moving Averages
* Last / Mark Price: 0.007652 USDC (Mark: 0.007649)
* MA(7) [Yellow]: 0.007385 USDC
* MA(25) [Pink]: 0.008044 USDC
* MA(99) [Purple]: 0.006902 USDC
Price action is currently sandwiched between the short-term MA(7) acting as immediate support below and the MA(25) acting as resistance overhead.
Technical Indicators & Key Levels
* Supertrend (10, 3): Sitting at 0.008483 (Red line). Because the Supertrend band sits above the current price, the overall indicator signals a bearish trend on the 1D timeframe.
* Immediate Support Levels:
* 0.007385 (MA7 dynamic support)
* 0.006902 (MA99 key long-term dynamic support)
* 0.005834 (Major swing low base)
* Immediate Resistance Levels & Targets:
* 0.008044 (MA25 dynamic resistance)
* 0.008319 (24h High level)
* 0.008483 (Supertrend resistance line)
* 0.010573 (Major historical peak high)
Trend Assessment
* Market Structure: After a massive surge towards 0.010573, the pair underwent a protracted correction down to test the MA(99) near 0.0069. It recently produced a bounce off that major moving average, but is struggling to reclaim higher resistance zones.
* Key Battle Zone: The area between 0.00804 and 0.00848 forms a major overhead resistance cluster (MA25 + Supertrend).
* Outlook:
* Bullish Scenario: A daily close above 0.00804 (MA25) would open up a test of the 0.00848 Supertrend line.
* Bearish Scenario: Rejection at current levels could see price retest the 0.00738 support, with key macro defense at the 0.00690 MA99 line.#BTCBreaks80K #SOLJumpsAbout10%
12
·
--
Bajista
Ver traducción
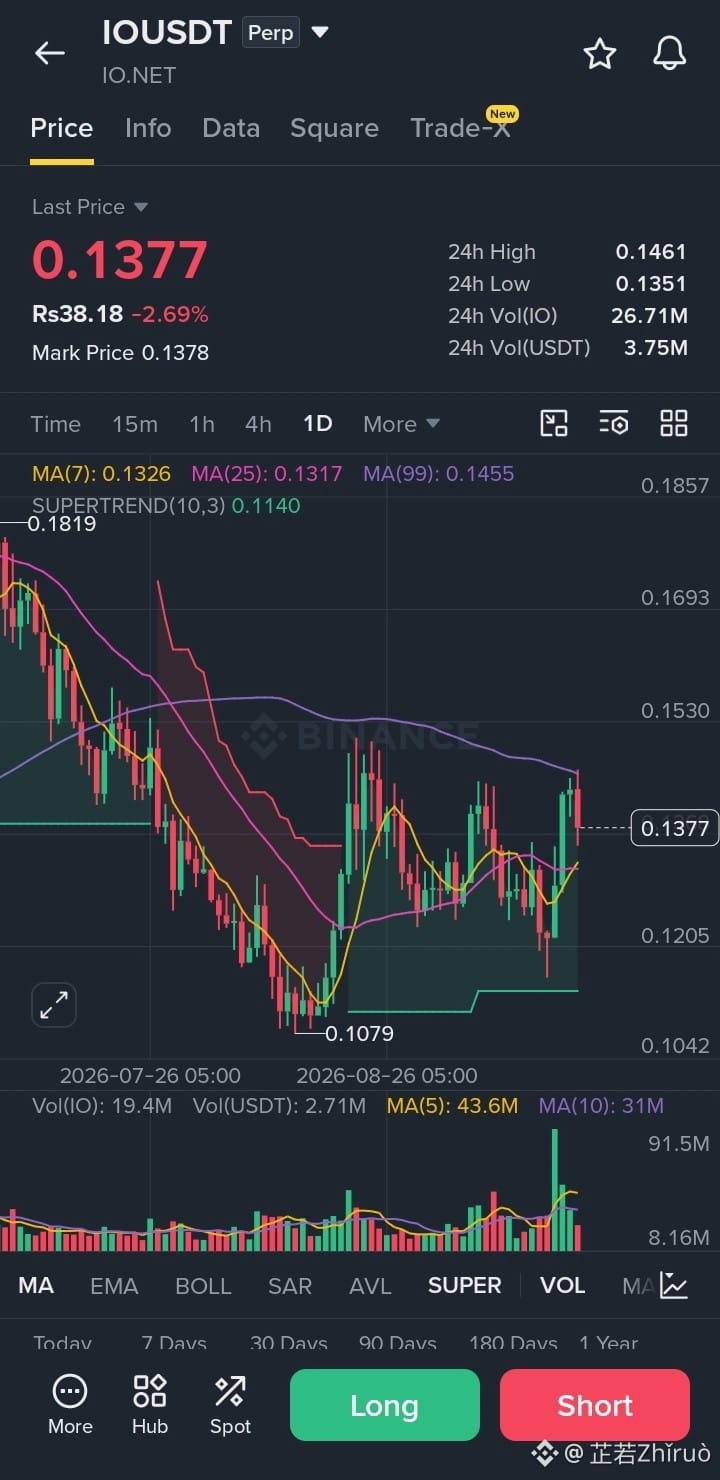
Based on the $IO
{future}(IOUSDT)
USDT (IO.NET) 1-Day chart:
Current Price & Moving Averages
* Last / Mark Price: 0.1377 USDT (Mark: 0.1378)
* MA(7) [Yellow]: 0.1326 USDT
* MA(25) [Pink]: 0.1317 USDT
* MA(99) [Purple]: 0.1455 USDT
The price is currently consolidating between short-term dynamic support (MA7 / MA25) and a major dynamic resistance level (MA99).
Technical Indicators & Key Levels
* Supertrend (10, 3): Located at 0.1140 (Green line). Since the price remains above this line, the Supertrend indicator reflects an active bullish bias on the 1D timeframe.
* Immediate Resistance Levels:
* 0.1455 (MA99 dynamic resistance)
* 0.1461 (24h High level)
* 0.1530 – 0.1693 (Key overhead swing resistance zones)
* Immediate Support Levels:
* 0.1326 (MA7 dynamic support)
* 0.1317 (MA25 dynamic support)
* 0.1205 (Local swing low support)
* 0.1140 (Supertrend key support level)
* 0.1079 (Major bottom swing low)
Trend Assessment
* Market Structure: The pair formed a strong base around 0.1079 and staged a recovery, but recent candle wicks near 0.1455 show strong selling pressure at the 99-day moving average.
* Volume Spike: A noticeable buying volume spike occurred recently, confirming active interest, though price action pulled back short-term after hitting resistance.
* Key Watch Zone:
* Bullish Breakout: A daily close above 0.1455–0.1461 confirms a trend reversal towards 0.1530+.
* Bearish Retest: Failure to hold above the 0.1317–0.1326 support cluster risks a slide back toward 0.1205.#HKCompletesFirstHKDStablecoinUseCase #BOJRaisesRatesTo31YearHigh
Based on the $IO
USDT (IO.NET) 1-Day chart:
Current Price & Moving Averages
* Last / Mark Price: 0.1377 USDT (Mark: 0.1378)
* MA(7) [Yellow]: 0.1326 USDT
* MA(25) [Pink]: 0.1317 USDT
* MA(99) [Purple]: 0.1455 USDT
The price is currently consolidating between short-term dynamic support (MA7 / MA25) and a major dynamic resistance level (MA99).
Technical Indicators & Key Levels
* Supertrend (10, 3): Located at 0.1140 (Green line). Since the price remains above this line, the Supertrend indicator reflects an active bullish bias on the 1D timeframe.
* Immediate Resistance Levels:
* 0.1455 (MA99 dynamic resistance)
* 0.1461 (24h High level)
* 0.1530 – 0.1693 (Key overhead swing resistance zones)
* Immediate Support Levels:
* 0.1326 (MA7 dynamic support)
* 0.1317 (MA25 dynamic support)
* 0.1205 (Local swing low support)
* 0.1140 (Supertrend key support level)
* 0.1079 (Major bottom swing low)
Trend Assessment
* Market Structure: The pair formed a strong base around 0.1079 and staged a recovery, but recent candle wicks near 0.1455 show strong selling pressure at the 99-day moving average.
* Volume Spike: A noticeable buying volume spike occurred recently, confirming active interest, though price action pulled back short-term after hitting resistance.
* Key Watch Zone:
* Bullish Breakout: A daily close above 0.1455–0.1461 confirms a trend reversal towards 0.1530+.
* Bearish Retest: Failure to hold above the 0.1317–0.1326 support cluster risks a slide back toward 0.1205.#HKCompletesFirstHKDStablecoinUseCase #BOJRaisesRatesTo31YearHigh
USDT (IO.NET) 1-Day chart:
Current Price & Moving Averages
* Last / Mark Price: 0.1377 USDT (Mark: 0.1378)
* MA(7) [Yellow]: 0.1326 USDT
* MA(25) [Pink]: 0.1317 USDT
* MA(99) [Purple]: 0.1455 USDT
The price is currently consolidating between short-term dynamic support (MA7 / MA25) and a major dynamic resistance level (MA99).
Technical Indicators & Key Levels
* Supertrend (10, 3): Located at 0.1140 (Green line). Since the price remains above this line, the Supertrend indicator reflects an active bullish bias on the 1D timeframe.
* Immediate Resistance Levels:
* 0.1455 (MA99 dynamic resistance)
* 0.1461 (24h High level)
* 0.1530 – 0.1693 (Key overhead swing resistance zones)
* Immediate Support Levels:
* 0.1326 (MA7 dynamic support)
* 0.1317 (MA25 dynamic support)
* 0.1205 (Local swing low support)
* 0.1140 (Supertrend key support level)
* 0.1079 (Major bottom swing low)
Trend Assessment
* Market Structure: The pair formed a strong base around 0.1079 and staged a recovery, but recent candle wicks near 0.1455 show strong selling pressure at the 99-day moving average.
* Volume Spike: A noticeable buying volume spike occurred recently, confirming active interest, though price action pulled back short-term after hitting resistance.
* Key Watch Zone:
* Bullish Breakout: A daily close above 0.1455–0.1461 confirms a trend reversal towards 0.1530+.
* Bearish Retest: Failure to hold above the 0.1317–0.1326 support cluster risks a slide back toward 0.1205.#HKCompletesFirstHKDStablecoinUseCase #BOJRaisesRatesTo31YearHigh
14
·
--
Bajista
Ver traducción
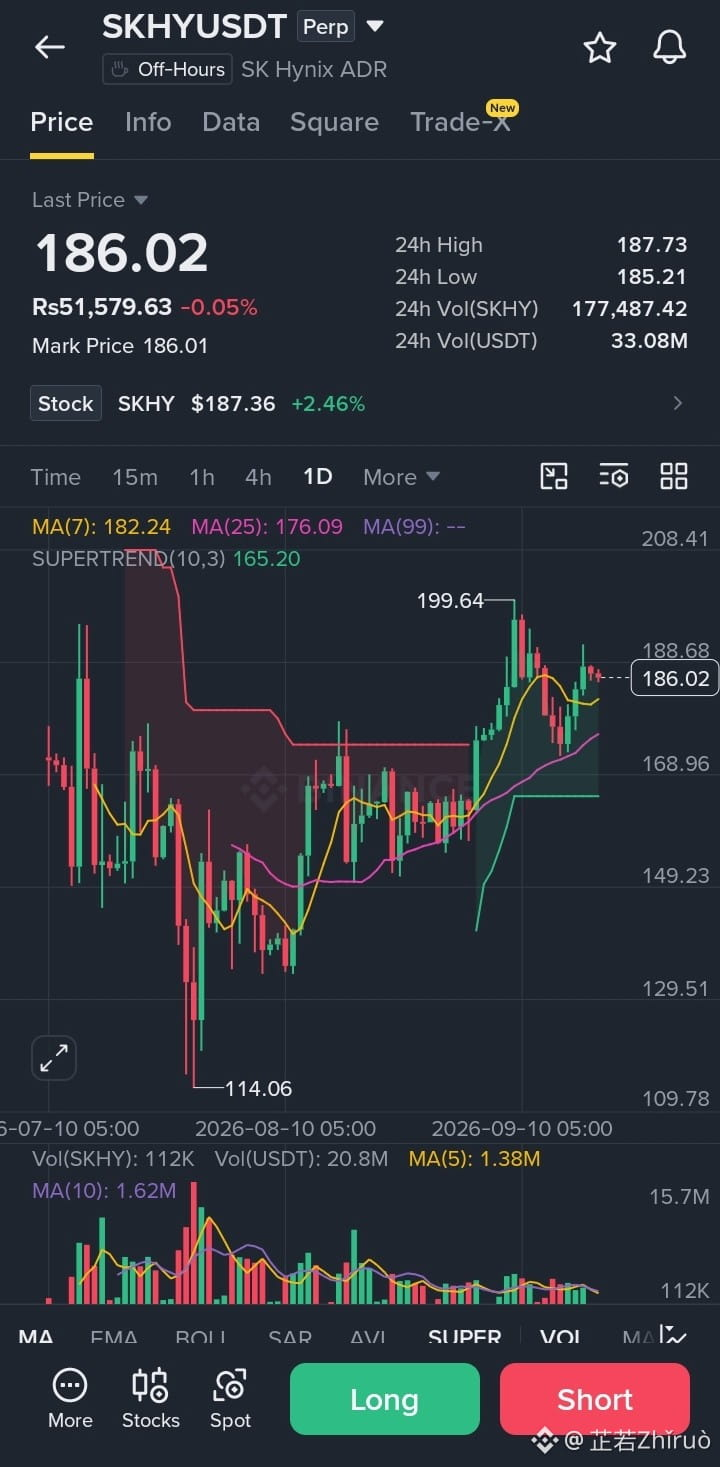
Based on the $SKHY
{future}(SKHYUSDT)
USDT (SK Hynix ADR) 1-Day chart:
Current Price & Moving Averages
* Last / Mark Price: 186.02 USDT (Mark: 186.01)
* MA(7) [Yellow]: 182.24 USDT
* MA(25) [Pink]: 176.09 USDT
* MA(99) [Purple]: N/A (Not enough history on chart)
The price is trading firmly above both the short-term MA(7) and medium-term MA(25), indicating strong bullish short-to-medium-term momentum.
Technical Indicators & Key Levels
* Supertrend (10, 3): Positioned at 165.20 (Green line). Because the price remains well above this indicator line, the Supertrend reflects an active bullish trend on the daily timeframe.
* Immediate Support Levels:
* 182.24 (MA7 dynamic support)
* 176.09 (MA25 dynamic support)
* 165.20 (Supertrend key support level)
* 114.06 (Major historical swing low)
* Resistance Levels & Targets:
* 188.68 (Immediate overhead local high resistance)
* 199.64 (Major recent swing peak high)
* 208.41 (Upper visual chart target / psychological level)
Trend Assessment
* Current Trend: The daily chart shows a strong upward trend structure following a bounce from low levels around August, breaking out into a higher high sequence.
* Key Level to Watch: 188.68 acts as immediate local resistance. Breaking and closing above this level puts the high at 199.64 back in focus.
* Outlook: As long as price holds above the 182.24 (MA7) and 176.09 (MA25) support band, the immediate trajectory favors further upside retests. A pull back below 176.09 would weaken the short-term momentum toward 165.20.#VietnamPlansFirstCryptoLicensesIn2026
Based on the $SKHY
USDT (SK Hynix ADR) 1-Day chart:
Current Price & Moving Averages
* Last / Mark Price: 186.02 USDT (Mark: 186.01)
* MA(7) [Yellow]: 182.24 USDT
* MA(25) [Pink]: 176.09 USDT
* MA(99) [Purple]: N/A (Not enough history on chart)
The price is trading firmly above both the short-term MA(7) and medium-term MA(25), indicating strong bullish short-to-medium-term momentum.
Technical Indicators & Key Levels
* Supertrend (10, 3): Positioned at 165.20 (Green line). Because the price remains well above this indicator line, the Supertrend reflects an active bullish trend on the daily timeframe.
* Immediate Support Levels:
* 182.24 (MA7 dynamic support)
* 176.09 (MA25 dynamic support)
* 165.20 (Supertrend key support level)
* 114.06 (Major historical swing low)
* Resistance Levels & Targets:
* 188.68 (Immediate overhead local high resistance)
* 199.64 (Major recent swing peak high)
* 208.41 (Upper visual chart target / psychological level)
Trend Assessment
* Current Trend: The daily chart shows a strong upward trend structure following a bounce from low levels around August, breaking out into a higher high sequence.
* Key Level to Watch: 188.68 acts as immediate local resistance. Breaking and closing above this level puts the high at 199.64 back in focus.
* Outlook: As long as price holds above the 182.24 (MA7) and 176.09 (MA25) support band, the immediate trajectory favors further upside retests. A pull back below 176.09 would weaken the short-term momentum toward 165.20.#VietnamPlansFirstCryptoLicensesIn2026
USDT (SK Hynix ADR) 1-Day chart:
Current Price & Moving Averages
* Last / Mark Price: 186.02 USDT (Mark: 186.01)
* MA(7) [Yellow]: 182.24 USDT
* MA(25) [Pink]: 176.09 USDT
* MA(99) [Purple]: N/A (Not enough history on chart)
The price is trading firmly above both the short-term MA(7) and medium-term MA(25), indicating strong bullish short-to-medium-term momentum.
Technical Indicators & Key Levels
* Supertrend (10, 3): Positioned at 165.20 (Green line). Because the price remains well above this indicator line, the Supertrend reflects an active bullish trend on the daily timeframe.
* Immediate Support Levels:
* 182.24 (MA7 dynamic support)
* 176.09 (MA25 dynamic support)
* 165.20 (Supertrend key support level)
* 114.06 (Major historical swing low)
* Resistance Levels & Targets:
* 188.68 (Immediate overhead local high resistance)
* 199.64 (Major recent swing peak high)
* 208.41 (Upper visual chart target / psychological level)
Trend Assessment
* Current Trend: The daily chart shows a strong upward trend structure following a bounce from low levels around August, breaking out into a higher high sequence.
* Key Level to Watch: 188.68 acts as immediate local resistance. Breaking and closing above this level puts the high at 199.64 back in focus.
* Outlook: As long as price holds above the 182.24 (MA7) and 176.09 (MA25) support band, the immediate trajectory favors further upside retests. A pull back below 176.09 would weaken the short-term momentum toward 165.20.#VietnamPlansFirstCryptoLicensesIn2026
8
·
--
Alcista
Ver traducción
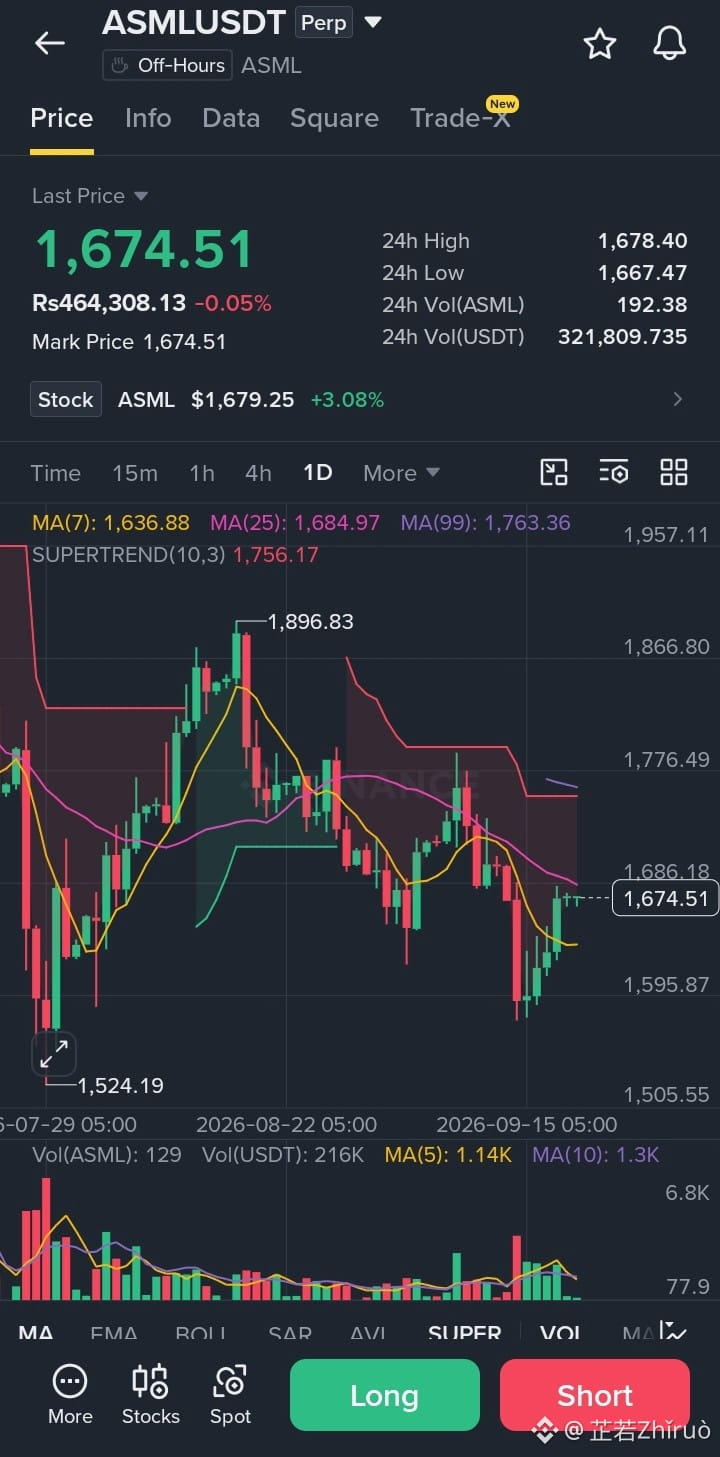
Based on the $ASML
{future}(ASMLUSDT)
USDT 1-Day chart:
Current Price & Moving Averages
* Last / Mark Price: 1,674.51 USDT
* MA(7) [Yellow]: 1,636.88 USDT
* MA(25) [Pink]: 1,684.97 USDT
* MA(99) [Purple]: 1,763.36 USDT
Price action is currently rebounding above the short-term MA(7) (1,636.88) after bouncing from recent lows, but it faces overhead resistance from the MA(25) (1,684.97) and MA(99) (1,763.36).
Technical Indicators & Key Levels
* Supertrend (10, 3): Positioned at 1,756.17 (Red line). Since the indicator line sits above current price levels, the Supertrend signals a bearish state on the daily timeframe.
* Immediate Support Levels:
* 1,636.88 (MA7 dynamic support)
* 1,595.87 (Recent local low boundary)
* 1,524.19 (Major swing low support)
* Resistance Levels & Targets:
* 1,684.97 (MA25 dynamic resistance)
* 1,756.17 – 1,763.36 (Supertrend resistance and MA99 cluster)
* 1,896.83 (Major peak high)
Trend Assessment
* Current Trend: The overall daily structure remains in a downtrend/pullback mode under the bearish Supertrend, though a short-term bounce is active off the 1,595 area.
* Key Battle Zone: The area around 1,685 to 1,760 forms a heavy resistance band where the 25-day MA, 99-day MA, and Supertrend converge.
* Outlook: Reclaiming 1,685 on a daily close would signal further recovery toward 1,756+, whereas failure to break through may lead to a retest of support near 1,636 or lower.#BOJRaisesRatesTo31YearHigh #BitcoinMarketCapTopsTesla
Based on the $ASML
USDT 1-Day chart:
Current Price & Moving Averages
* Last / Mark Price: 1,674.51 USDT
* MA(7) [Yellow]: 1,636.88 USDT
* MA(25) [Pink]: 1,684.97 USDT
* MA(99) [Purple]: 1,763.36 USDT
Price action is currently rebounding above the short-term MA(7) (1,636.88) after bouncing from recent lows, but it faces overhead resistance from the MA(25) (1,684.97) and MA(99) (1,763.36).
Technical Indicators & Key Levels
* Supertrend (10, 3): Positioned at 1,756.17 (Red line). Since the indicator line sits above current price levels, the Supertrend signals a bearish state on the daily timeframe.
* Immediate Support Levels:
* 1,636.88 (MA7 dynamic support)
* 1,595.87 (Recent local low boundary)
* 1,524.19 (Major swing low support)
* Resistance Levels & Targets:
* 1,684.97 (MA25 dynamic resistance)
* 1,756.17 – 1,763.36 (Supertrend resistance and MA99 cluster)
* 1,896.83 (Major peak high)
Trend Assessment
* Current Trend: The overall daily structure remains in a downtrend/pullback mode under the bearish Supertrend, though a short-term bounce is active off the 1,595 area.
* Key Battle Zone: The area around 1,685 to 1,760 forms a heavy resistance band where the 25-day MA, 99-day MA, and Supertrend converge.
* Outlook: Reclaiming 1,685 on a daily close would signal further recovery toward 1,756+, whereas failure to break through may lead to a retest of support near 1,636 or lower.#BOJRaisesRatesTo31YearHigh #BitcoinMarketCapTopsTesla
USDT 1-Day chart:
Current Price & Moving Averages
* Last / Mark Price: 1,674.51 USDT
* MA(7) [Yellow]: 1,636.88 USDT
* MA(25) [Pink]: 1,684.97 USDT
* MA(99) [Purple]: 1,763.36 USDT
Price action is currently rebounding above the short-term MA(7) (1,636.88) after bouncing from recent lows, but it faces overhead resistance from the MA(25) (1,684.97) and MA(99) (1,763.36).
Technical Indicators & Key Levels
* Supertrend (10, 3): Positioned at 1,756.17 (Red line). Since the indicator line sits above current price levels, the Supertrend signals a bearish state on the daily timeframe.
* Immediate Support Levels:
* 1,636.88 (MA7 dynamic support)
* 1,595.87 (Recent local low boundary)
* 1,524.19 (Major swing low support)
* Resistance Levels & Targets:
* 1,684.97 (MA25 dynamic resistance)
* 1,756.17 – 1,763.36 (Supertrend resistance and MA99 cluster)
* 1,896.83 (Major peak high)
Trend Assessment
* Current Trend: The overall daily structure remains in a downtrend/pullback mode under the bearish Supertrend, though a short-term bounce is active off the 1,595 area.
* Key Battle Zone: The area around 1,685 to 1,760 forms a heavy resistance band where the 25-day MA, 99-day MA, and Supertrend converge.
* Outlook: Reclaiming 1,685 on a daily close would signal further recovery toward 1,756+, whereas failure to break through may lead to a retest of support near 1,636 or lower.#BOJRaisesRatesTo31YearHigh #BitcoinMarketCapTopsTesla
7
·
--
Bajista
Ver traducción
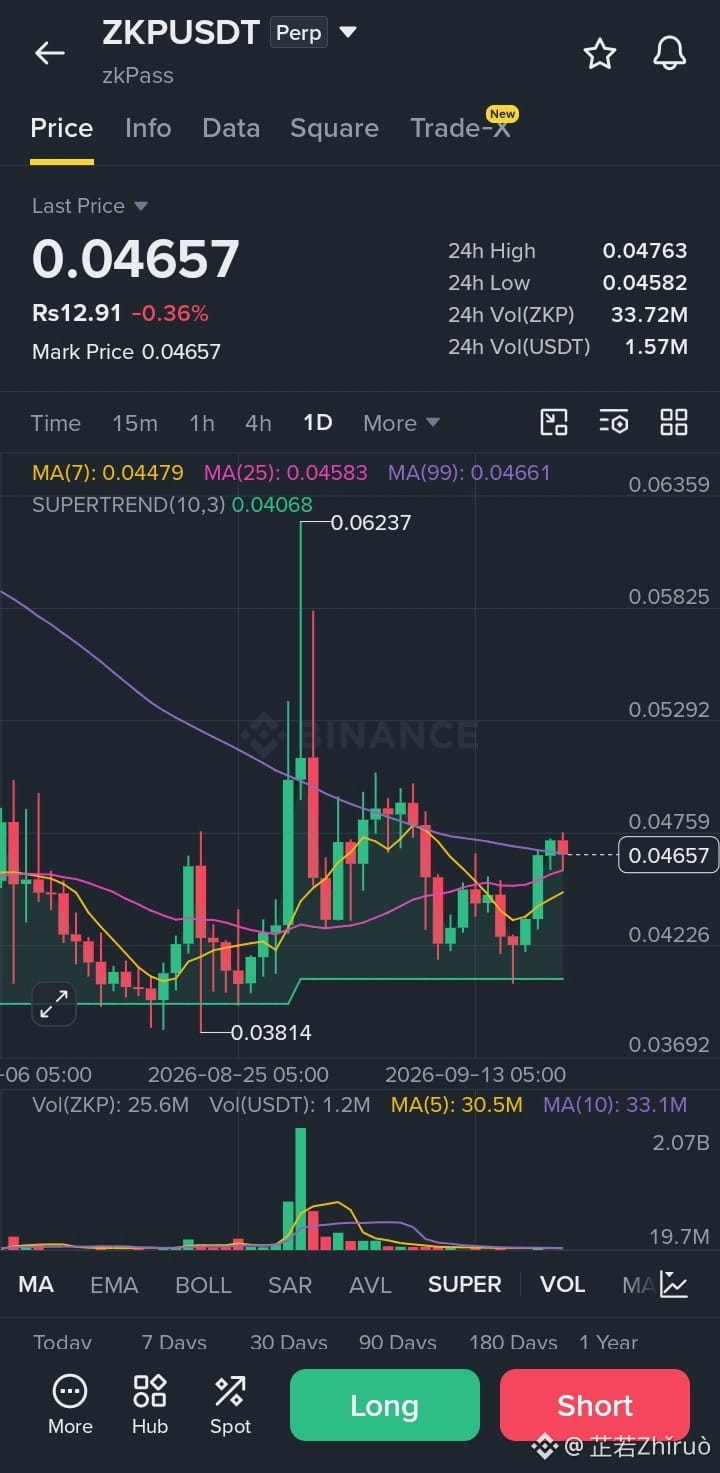
Based on the $ZKP
{future}(ZKPUSDT)
USDT (zkPass) 1-Day chart:
Current Price & Moving Averages
* Last / Mark Price: 0.04657 USDT
* MA(7) [Yellow]: 0.04479 USDT
* MA(25) [Pink]: 0.04583 USDT
* MA(99) [Purple]: 0.04661 USDT
The price is currently trading just above both the MA(7) and MA(25), indicating short-term bullish momentum. However, it is hitting immediate resistance at the MA(99) (0.04661).
Technical Indicators & Key Levels
* Supertrend (10, 3): Sitting at 0.04068 (Green line). Since the price is above this level, the Supertrend indicator signals an overall bullish/buy state on the 1D timeframe.
* Immediate Resistance:
* 0.04661 (MA99)
* 0.04759 (Recent local peak)
* Key Resistance / Targets: 0.05292 – 0.06237 (Previous major spike high)
* Support Levels:
* 0.04583 (MA25 dynamic support)
* 0.04479 (MA7 dynamic support)
* 0.04068 (Supertrend lower boundary / key support)
* 0.03814 (Major local swing low)
Summary & Trend Assessment
* Short-Term Outlook: Bullish recovery off the ~0.04226 level, attempting a breakout above the 99-day moving average.
* Volume: Lower volume relative to the major volume spike seen in late August. A sustained move above 0.04760 would ideally require higher buying volume.
* Key Trigger: A daily close above 0.04661–0.04760 opens up room toward the 0.052+ zone. Conversely, losing 0.0448 could push the price back down toward 0.0407.#HKCompletesFirstHKDStablecoinUseCase #SaylorHintsStrategyBitcoinBuy
Based on the $ZKP
USDT (zkPass) 1-Day chart:
Current Price & Moving Averages
* Last / Mark Price: 0.04657 USDT
* MA(7) [Yellow]: 0.04479 USDT
* MA(25) [Pink]: 0.04583 USDT
* MA(99) [Purple]: 0.04661 USDT
The price is currently trading just above both the MA(7) and MA(25), indicating short-term bullish momentum. However, it is hitting immediate resistance at the MA(99) (0.04661).
Technical Indicators & Key Levels
* Supertrend (10, 3): Sitting at 0.04068 (Green line). Since the price is above this level, the Supertrend indicator signals an overall bullish/buy state on the 1D timeframe.
* Immediate Resistance:
* 0.04661 (MA99)
* 0.04759 (Recent local peak)
* Key Resistance / Targets: 0.05292 – 0.06237 (Previous major spike high)
* Support Levels:
* 0.04583 (MA25 dynamic support)
* 0.04479 (MA7 dynamic support)
* 0.04068 (Supertrend lower boundary / key support)
* 0.03814 (Major local swing low)
Summary & Trend Assessment
* Short-Term Outlook: Bullish recovery off the ~0.04226 level, attempting a breakout above the 99-day moving average.
* Volume: Lower volume relative to the major volume spike seen in late August. A sustained move above 0.04760 would ideally require higher buying volume.
* Key Trigger: A daily close above 0.04661–0.04760 opens up room toward the 0.052+ zone. Conversely, losing 0.0448 could push the price back down toward 0.0407.#HKCompletesFirstHKDStablecoinUseCase #SaylorHintsStrategyBitcoinBuy
USDT (zkPass) 1-Day chart:
Current Price & Moving Averages
* Last / Mark Price: 0.04657 USDT
* MA(7) [Yellow]: 0.04479 USDT
* MA(25) [Pink]: 0.04583 USDT
* MA(99) [Purple]: 0.04661 USDT
The price is currently trading just above both the MA(7) and MA(25), indicating short-term bullish momentum. However, it is hitting immediate resistance at the MA(99) (0.04661).
Technical Indicators & Key Levels
* Supertrend (10, 3): Sitting at 0.04068 (Green line). Since the price is above this level, the Supertrend indicator signals an overall bullish/buy state on the 1D timeframe.
* Immediate Resistance:
* 0.04661 (MA99)
* 0.04759 (Recent local peak)
* Key Resistance / Targets: 0.05292 – 0.06237 (Previous major spike high)
* Support Levels:
* 0.04583 (MA25 dynamic support)
* 0.04479 (MA7 dynamic support)
* 0.04068 (Supertrend lower boundary / key support)
* 0.03814 (Major local swing low)
Summary & Trend Assessment
* Short-Term Outlook: Bullish recovery off the ~0.04226 level, attempting a breakout above the 99-day moving average.
* Volume: Lower volume relative to the major volume spike seen in late August. A sustained move above 0.04760 would ideally require higher buying volume.
* Key Trigger: A daily close above 0.04661–0.04760 opens up room toward the 0.052+ zone. Conversely, losing 0.0448 could push the price back down toward 0.0407.#HKCompletesFirstHKDStablecoinUseCase #SaylorHintsStrategyBitcoinBuy
10
·
--
Bajista
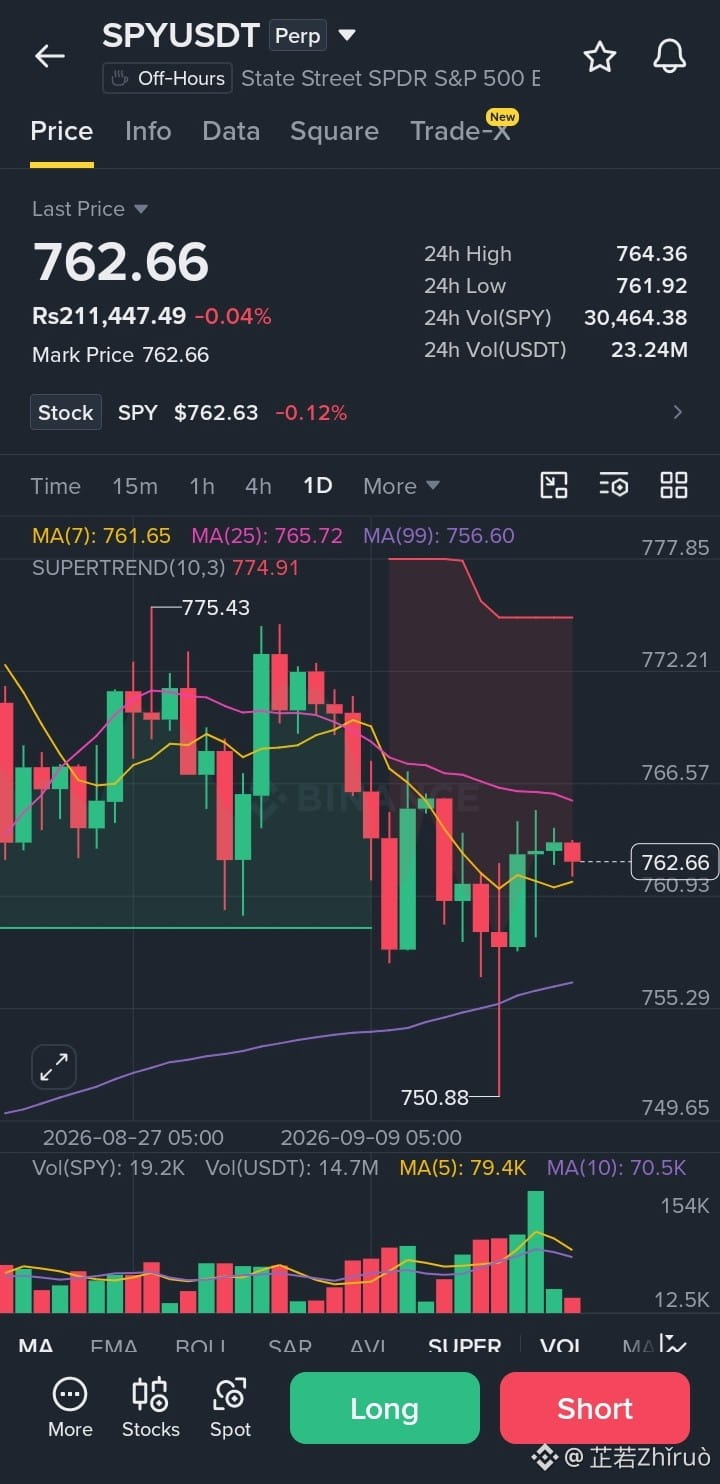
El gráfico muestra el marco temporal diario (1D) para $SPY
{future}(SPYUSDT)
USDT Perp (contrato perpetuo del USDT Perp del ETF Trust del S&P 500 de State Street SPDR) cotizando a 762.66.
1. Observaciones Técnicas Clave
* Movimiento y Estructura del Precio: El precio experimentó una corrección desde su máximo local de 775.43 hasta una mecha inferior en 750.88. Desde entonces, ha presentado un rebote moderado y actualmente se está consolidando entre las medias móviles de 7 y 25 días.
* Medias Móviles (MA):
* MA(7): En 761.65 (línea amarilla), manteniéndose como soporte dinámico a corto plazo directamente por debajo del precio actual.
* MA(25): En 765.72 (línea morada), actuando como resistencia dinámica inmediata por encima.
* MA(99): En 756.60, aportando un fuerte soporte de tendencia a largo plazo por debajo.
* Indicador Supertrend: La línea Supertrend(10,3) se encuentra por encima en 774.91 (zona sombreada en rojo), lo que indica que el momentum a medio plazo sigue inclinado hacia el lado bajista hasta que se recupere.
* Volumen: Hubo un volumen alto acompañado del mínimo del swing en 750.88, seguido por un volumen de compra moderado en el rebote inicial.
2. Niveles Técnicos Clave
* Resistencia Inmediata: 765.72 (MA(25)) y 774.91 – 775.43 (nivel del Supertrend y máximo previo del swing).
* Soporte Inmediato: 761.65 (MA(7)), 756.60 (MA(99)) y 750.88 (mínimo reciente del swing).
3. Escenarios Potenciales de Operación
A. Continuación Alcista (Long por Ruptura)
* Idea de entrada: Buscar un cierre de vela diaria por encima de 766.00 (recuperando la MA(25)) para apuntar a una revalidación de los máximos locales.
* Objetivos: 774.90 (línea del Supertrend) y 775.43 (máximo del swing).
* Stop Loss: Por debajo de 760.00 (debajo de la MA(7)).
B. Rechazo Bajista (Short por Reversión de Tendencia)
* Idea de entrada: Si el precio es rechazado en la zona de resistencia 765.70 – 766.00 o si vuelve a romper por debajo de 761.65.
* Objetivos: 756.60 (MA(99)) y 750.88 (mínimo del swing).
* Stop Loss: Por encima de 767.50.
Aviso legal: Los futuros perpetuos sobre índices bursátiles conllevan un riesgo sustancial de apalancamiento. Asegúrate de aplicar una gestión estricta del riesgo y un tamaño de posición adecuado.#BTCBreaks80K
El gráfico muestra el marco temporal diario (1D) para $SPY
USDT Perp (contrato perpetuo del USDT Perp del ETF Trust del S&P 500 de State Street SPDR) cotizando a 762.66.
1. Observaciones Técnicas Clave
* Movimiento y Estructura del Precio: El precio experimentó una corrección desde su máximo local de 775.43 hasta una mecha inferior en 750.88. Desde entonces, ha presentado un rebote moderado y actualmente se está consolidando entre las medias móviles de 7 y 25 días.
* Medias Móviles (MA):
* MA(7): En 761.65 (línea amarilla), manteniéndose como soporte dinámico a corto plazo directamente por debajo del precio actual.
* MA(25): En 765.72 (línea morada), actuando como resistencia dinámica inmediata por encima.
* MA(99): En 756.60, aportando un fuerte soporte de tendencia a largo plazo por debajo.
* Indicador Supertrend: La línea Supertrend(10,3) se encuentra por encima en 774.91 (zona sombreada en rojo), lo que indica que el momentum a medio plazo sigue inclinado hacia el lado bajista hasta que se recupere.
* Volumen: Hubo un volumen alto acompañado del mínimo del swing en 750.88, seguido por un volumen de compra moderado en el rebote inicial.
2. Niveles Técnicos Clave
* Resistencia Inmediata: 765.72 (MA(25)) y 774.91 – 775.43 (nivel del Supertrend y máximo previo del swing).
* Soporte Inmediato: 761.65 (MA(7)), 756.60 (MA(99)) y 750.88 (mínimo reciente del swing).
3. Escenarios Potenciales de Operación
A. Continuación Alcista (Long por Ruptura)
* Idea de entrada: Buscar un cierre de vela diaria por encima de 766.00 (recuperando la MA(25)) para apuntar a una revalidación de los máximos locales.
* Objetivos: 774.90 (línea del Supertrend) y 775.43 (máximo del swing).
* Stop Loss: Por debajo de 760.00 (debajo de la MA(7)).
B. Rechazo Bajista (Short por Reversión de Tendencia)
* Idea de entrada: Si el precio es rechazado en la zona de resistencia 765.70 – 766.00 o si vuelve a romper por debajo de 761.65.
* Objetivos: 756.60 (MA(99)) y 750.88 (mínimo del swing).
* Stop Loss: Por encima de 767.50.
Aviso legal: Los futuros perpetuos sobre índices bursátiles conllevan un riesgo sustancial de apalancamiento. Asegúrate de aplicar una gestión estricta del riesgo y un tamaño de posición adecuado.#BTCBreaks80K
USDT Perp (contrato perpetuo del USDT Perp del ETF Trust del S&P 500 de State Street SPDR) cotizando a 762.66.
1. Observaciones Técnicas Clave
* Movimiento y Estructura del Precio: El precio experimentó una corrección desde su máximo local de 775.43 hasta una mecha inferior en 750.88. Desde entonces, ha presentado un rebote moderado y actualmente se está consolidando entre las medias móviles de 7 y 25 días.
* Medias Móviles (MA):
* MA(7): En 761.65 (línea amarilla), manteniéndose como soporte dinámico a corto plazo directamente por debajo del precio actual.
* MA(25): En 765.72 (línea morada), actuando como resistencia dinámica inmediata por encima.
* MA(99): En 756.60, aportando un fuerte soporte de tendencia a largo plazo por debajo.
* Indicador Supertrend: La línea Supertrend(10,3) se encuentra por encima en 774.91 (zona sombreada en rojo), lo que indica que el momentum a medio plazo sigue inclinado hacia el lado bajista hasta que se recupere.
* Volumen: Hubo un volumen alto acompañado del mínimo del swing en 750.88, seguido por un volumen de compra moderado en el rebote inicial.
2. Niveles Técnicos Clave
* Resistencia Inmediata: 765.72 (MA(25)) y 774.91 – 775.43 (nivel del Supertrend y máximo previo del swing).
* Soporte Inmediato: 761.65 (MA(7)), 756.60 (MA(99)) y 750.88 (mínimo reciente del swing).
3. Escenarios Potenciales de Operación
A. Continuación Alcista (Long por Ruptura)
* Idea de entrada: Buscar un cierre de vela diaria por encima de 766.00 (recuperando la MA(25)) para apuntar a una revalidación de los máximos locales.
* Objetivos: 774.90 (línea del Supertrend) y 775.43 (máximo del swing).
* Stop Loss: Por debajo de 760.00 (debajo de la MA(7)).
B. Rechazo Bajista (Short por Reversión de Tendencia)
* Idea de entrada: Si el precio es rechazado en la zona de resistencia 765.70 – 766.00 o si vuelve a romper por debajo de 761.65.
* Objetivos: 756.60 (MA(99)) y 750.88 (mínimo del swing).
* Stop Loss: Por encima de 767.50.
Aviso legal: Los futuros perpetuos sobre índices bursátiles conllevan un riesgo sustancial de apalancamiento. Asegúrate de aplicar una gestión estricta del riesgo y un tamaño de posición adecuado.#BTCBreaks80K
7
·
--
Bajista
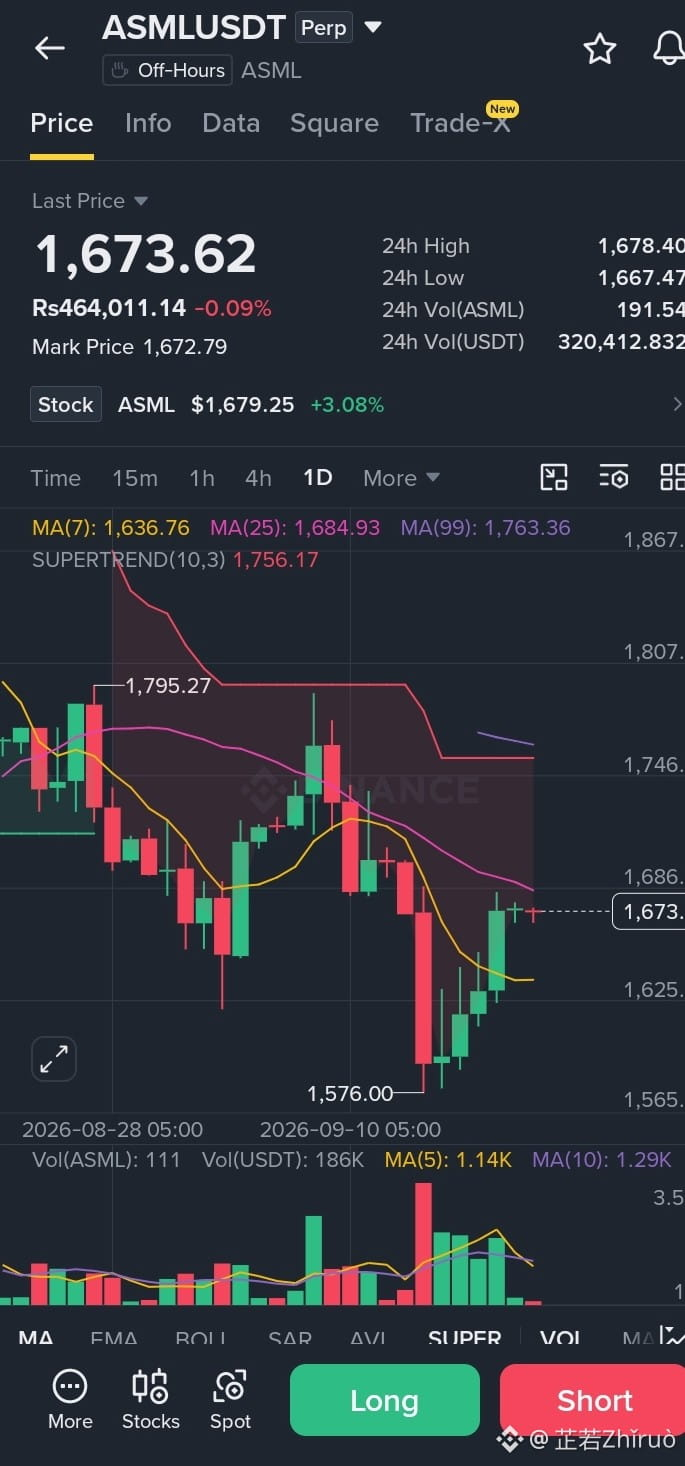
El gráfico muestra el marco temporal diario (1D) para la operativa Perp de $ASML
{future}(ASMLUSDT)
USDT a 1,673.62.
1. Observaciones Técnicas Clave
* Movimiento de Precio y Recuperación: Después de caer con fuerza hasta un mínimo local de 1,576.00, el precio realizó un fuerte rebote en las sesiones recientes, acercándose a la línea de la MA(25).
* Medias Móviles (MA):
* MA(7): Situada en 1,636.76 (por debajo del precio), proporcionando soporte dinámico a corto plazo durante las correcciones.
* MA(25): Ubicada en 1,684.93 (justo por encima del precio actual), actuando como resistencia inmediata en la parte superior.
* MA(99): Posicionada más arriba en 1,763.36, reforzando la tendencia bajista más amplia en marcos temporales superiores.
* Indicador Supertrend: La línea Supertrend(10,3) se encuentra por encima en 1,756.17 (zona sombreada roja), confirmando que la tendencia macro sigue siendo bajista pese al reciente repunte de alivio.
* Perfil de Volumen: El volumen de negociación alcanzó su punto máximo durante la venta masiva alrededor de 1,576.00 y desde entonces se ha normalizado.
2. Niveles Clave a Vigilar
* Resistencia Inmediata: 1,684.93 (MA(25)) y 1,756.17 – 1,795.27 (Supertrend / zona del máximo anterior del swing).
* Soporte Inmediato: 1,636.76 (MA(7)) y 1,576.00 (mínimo reciente del swing).
3. Escenarios Potenciales de Operación
A. Continuación Alcista (Compra por Ruptura)
* Idea de Entrada: Buscar un cierre de vela diaria por encima de 1,685.00 (MA(25)) para señalar la continuación del movimiento de alivio hacia objetivos dinámicos más altos.
* Objetivos: 1,756.00 (Supertrend) y 1,795.00.
* Stop Loss: Por debajo de 1,635.00 (debajo de la MA(7)).
B. Rechazo Bajista (Short por Reversión de Tendencia)
* Idea de Entrada: Buscar señales de rechazo cerca de la zona de resistencia 1,685.00 – 1,700.00 o una ruptura por debajo de 1,636.00.
* Objetivos: 1,576.00 (retest del mínimo).
* Stop Loss: Por encima de 1,710.00.
Aviso Legal: La operativa perpetua con activos apalancados conlleva un riesgo financiero significativo. Gestiona siempre el tamaño de la posición con cuidado y utiliza órdenes de stop loss.#XRPExchangeReservesHitSevenYearLow #BOJRaisesRatesTo31YearHigh
El gráfico muestra el marco temporal diario (1D) para la operativa Perp de $ASML
USDT a 1,673.62.
1. Observaciones Técnicas Clave
* Movimiento de Precio y Recuperación: Después de caer con fuerza hasta un mínimo local de 1,576.00, el precio realizó un fuerte rebote en las sesiones recientes, acercándose a la línea de la MA(25).
* Medias Móviles (MA):
* MA(7): Situada en 1,636.76 (por debajo del precio), proporcionando soporte dinámico a corto plazo durante las correcciones.
* MA(25): Ubicada en 1,684.93 (justo por encima del precio actual), actuando como resistencia inmediata en la parte superior.
* MA(99): Posicionada más arriba en 1,763.36, reforzando la tendencia bajista más amplia en marcos temporales superiores.
* Indicador Supertrend: La línea Supertrend(10,3) se encuentra por encima en 1,756.17 (zona sombreada roja), confirmando que la tendencia macro sigue siendo bajista pese al reciente repunte de alivio.
* Perfil de Volumen: El volumen de negociación alcanzó su punto máximo durante la venta masiva alrededor de 1,576.00 y desde entonces se ha normalizado.
2. Niveles Clave a Vigilar
* Resistencia Inmediata: 1,684.93 (MA(25)) y 1,756.17 – 1,795.27 (Supertrend / zona del máximo anterior del swing).
* Soporte Inmediato: 1,636.76 (MA(7)) y 1,576.00 (mínimo reciente del swing).
3. Escenarios Potenciales de Operación
A. Continuación Alcista (Compra por Ruptura)
* Idea de Entrada: Buscar un cierre de vela diaria por encima de 1,685.00 (MA(25)) para señalar la continuación del movimiento de alivio hacia objetivos dinámicos más altos.
* Objetivos: 1,756.00 (Supertrend) y 1,795.00.
* Stop Loss: Por debajo de 1,635.00 (debajo de la MA(7)).
B. Rechazo Bajista (Short por Reversión de Tendencia)
* Idea de Entrada: Buscar señales de rechazo cerca de la zona de resistencia 1,685.00 – 1,700.00 o una ruptura por debajo de 1,636.00.
* Objetivos: 1,576.00 (retest del mínimo).
* Stop Loss: Por encima de 1,710.00.
Aviso Legal: La operativa perpetua con activos apalancados conlleva un riesgo financiero significativo. Gestiona siempre el tamaño de la posición con cuidado y utiliza órdenes de stop loss.#XRPExchangeReservesHitSevenYearLow #BOJRaisesRatesTo31YearHigh
USDT a 1,673.62.
1. Observaciones Técnicas Clave
* Movimiento de Precio y Recuperación: Después de caer con fuerza hasta un mínimo local de 1,576.00, el precio realizó un fuerte rebote en las sesiones recientes, acercándose a la línea de la MA(25).
* Medias Móviles (MA):
* MA(7): Situada en 1,636.76 (por debajo del precio), proporcionando soporte dinámico a corto plazo durante las correcciones.
* MA(25): Ubicada en 1,684.93 (justo por encima del precio actual), actuando como resistencia inmediata en la parte superior.
* MA(99): Posicionada más arriba en 1,763.36, reforzando la tendencia bajista más amplia en marcos temporales superiores.
* Indicador Supertrend: La línea Supertrend(10,3) se encuentra por encima en 1,756.17 (zona sombreada roja), confirmando que la tendencia macro sigue siendo bajista pese al reciente repunte de alivio.
* Perfil de Volumen: El volumen de negociación alcanzó su punto máximo durante la venta masiva alrededor de 1,576.00 y desde entonces se ha normalizado.
2. Niveles Clave a Vigilar
* Resistencia Inmediata: 1,684.93 (MA(25)) y 1,756.17 – 1,795.27 (Supertrend / zona del máximo anterior del swing).
* Soporte Inmediato: 1,636.76 (MA(7)) y 1,576.00 (mínimo reciente del swing).
3. Escenarios Potenciales de Operación
A. Continuación Alcista (Compra por Ruptura)
* Idea de Entrada: Buscar un cierre de vela diaria por encima de 1,685.00 (MA(25)) para señalar la continuación del movimiento de alivio hacia objetivos dinámicos más altos.
* Objetivos: 1,756.00 (Supertrend) y 1,795.00.
* Stop Loss: Por debajo de 1,635.00 (debajo de la MA(7)).
B. Rechazo Bajista (Short por Reversión de Tendencia)
* Idea de Entrada: Buscar señales de rechazo cerca de la zona de resistencia 1,685.00 – 1,700.00 o una ruptura por debajo de 1,636.00.
* Objetivos: 1,576.00 (retest del mínimo).
* Stop Loss: Por encima de 1,710.00.
Aviso Legal: La operativa perpetua con activos apalancados conlleva un riesgo financiero significativo. Gestiona siempre el tamaño de la posición con cuidado y utiliza órdenes de stop loss.#XRPExchangeReservesHitSevenYearLow #BOJRaisesRatesTo31YearHigh
4
·
--
Alcista
Ver traducción
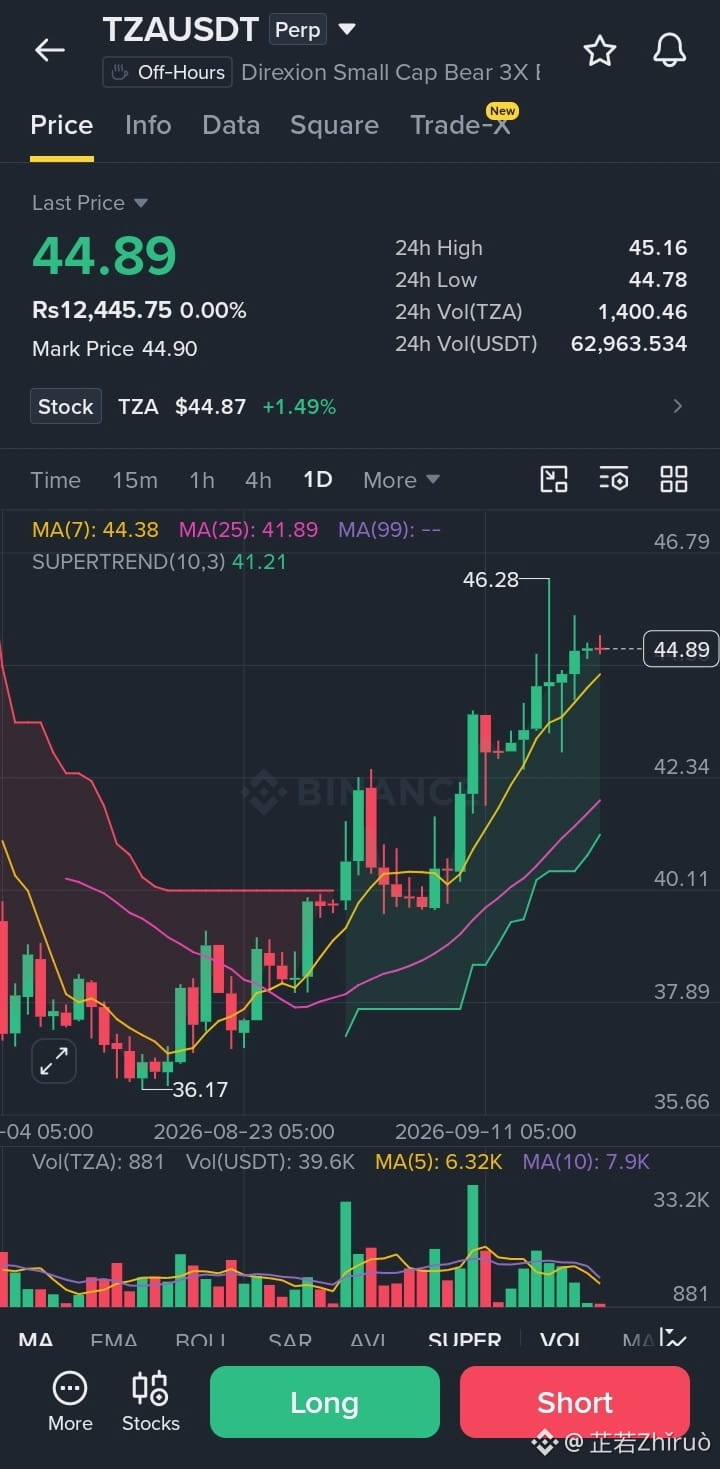
Based on the daily chart for $TZA
{future}(TZAUSDT)
USDT Perp (Direxion Daily Small Cap Bear 3X Shares perpetual contract) shown in your screenshot:
1. Key Market Observations
* Current Price & Momentum: Trading at 44.89, the price is in a strong recent uptrend after forming a bottom around 36.17.
* Moving Averages (MA):
* The price is trading well above the MA(7) at 44.38 and the MA(25) at 41.89.
* The short-term moving average (yellow line) is sloping upwards, indicating solid bullish short-term momentum.
* Supertrend Indicator: The Supertrend(10,3) line is at 41.21 (green line below the candles), confirming an active Bullish/Long trend signal.
* Resistance & Support:
* Immediate Resistance: 46.28 (recent peak). A breakout above this level could push prices higher toward the 46.79+ range.
* Key Support Levels: 44.38 (7-day MA), 41.89 (25-day MA), and 41.21 (Supertrend level).
2. Potential Trade Strategies
A. Bullish Setup (Trend Following / Breakout)
* Entry Concept: Look for a continuation move toward the recent high, or wait for a slight pull-back to enter closer to dynamic support.
* Target / Resistance: 46.28 (Primary target).
* Stop Loss: Below 44.00 (for tight short-term trades) or below 41.21 (Supertrend level for broader trend trades).
B. Bearish Setup (Mean Reversion / Short)
* Entry Concept: If the price gets rejected near the 46.28 resistance level or drops back below the MA(7) at 44.38, a short position aiming for a mean-reversion move toward the MA(25) could be considered.
* Target: 41.89 (25-day MA).
* Stop Loss: Above 46.30.
Disclaimer: Leverage perpetual trading carries significant financial risk due to volatility. Ensure appropriate risk management and position sizing based on your personal risk tolerance.#BuffettStepsDownAsBerkshireChairman
Based on the daily chart for $TZA
USDT Perp (Direxion Daily Small Cap Bear 3X Shares perpetual contract) shown in your screenshot:
1. Key Market Observations
* Current Price & Momentum: Trading at 44.89, the price is in a strong recent uptrend after forming a bottom around 36.17.
* Moving Averages (MA):
* The price is trading well above the MA(7) at 44.38 and the MA(25) at 41.89.
* The short-term moving average (yellow line) is sloping upwards, indicating solid bullish short-term momentum.
* Supertrend Indicator: The Supertrend(10,3) line is at 41.21 (green line below the candles), confirming an active Bullish/Long trend signal.
* Resistance & Support:
* Immediate Resistance: 46.28 (recent peak). A breakout above this level could push prices higher toward the 46.79+ range.
* Key Support Levels: 44.38 (7-day MA), 41.89 (25-day MA), and 41.21 (Supertrend level).
2. Potential Trade Strategies
A. Bullish Setup (Trend Following / Breakout)
* Entry Concept: Look for a continuation move toward the recent high, or wait for a slight pull-back to enter closer to dynamic support.
* Target / Resistance: 46.28 (Primary target).
* Stop Loss: Below 44.00 (for tight short-term trades) or below 41.21 (Supertrend level for broader trend trades).
B. Bearish Setup (Mean Reversion / Short)
* Entry Concept: If the price gets rejected near the 46.28 resistance level or drops back below the MA(7) at 44.38, a short position aiming for a mean-reversion move toward the MA(25) could be considered.
* Target: 41.89 (25-day MA).
* Stop Loss: Above 46.30.
Disclaimer: Leverage perpetual trading carries significant financial risk due to volatility. Ensure appropriate risk management and position sizing based on your personal risk tolerance.#BuffettStepsDownAsBerkshireChairman
USDT Perp (Direxion Daily Small Cap Bear 3X Shares perpetual contract) shown in your screenshot:
1. Key Market Observations
* Current Price & Momentum: Trading at 44.89, the price is in a strong recent uptrend after forming a bottom around 36.17.
* Moving Averages (MA):
* The price is trading well above the MA(7) at 44.38 and the MA(25) at 41.89.
* The short-term moving average (yellow line) is sloping upwards, indicating solid bullish short-term momentum.
* Supertrend Indicator: The Supertrend(10,3) line is at 41.21 (green line below the candles), confirming an active Bullish/Long trend signal.
* Resistance & Support:
* Immediate Resistance: 46.28 (recent peak). A breakout above this level could push prices higher toward the 46.79+ range.
* Key Support Levels: 44.38 (7-day MA), 41.89 (25-day MA), and 41.21 (Supertrend level).
2. Potential Trade Strategies
A. Bullish Setup (Trend Following / Breakout)
* Entry Concept: Look for a continuation move toward the recent high, or wait for a slight pull-back to enter closer to dynamic support.
* Target / Resistance: 46.28 (Primary target).
* Stop Loss: Below 44.00 (for tight short-term trades) or below 41.21 (Supertrend level for broader trend trades).
B. Bearish Setup (Mean Reversion / Short)
* Entry Concept: If the price gets rejected near the 46.28 resistance level or drops back below the MA(7) at 44.38, a short position aiming for a mean-reversion move toward the MA(25) could be considered.
* Target: 41.89 (25-day MA).
* Stop Loss: Above 46.30.
Disclaimer: Leverage perpetual trading carries significant financial risk due to volatility. Ensure appropriate risk management and position sizing based on your personal risk tolerance.#BuffettStepsDownAsBerkshireChairman
9
·
--
Alcista
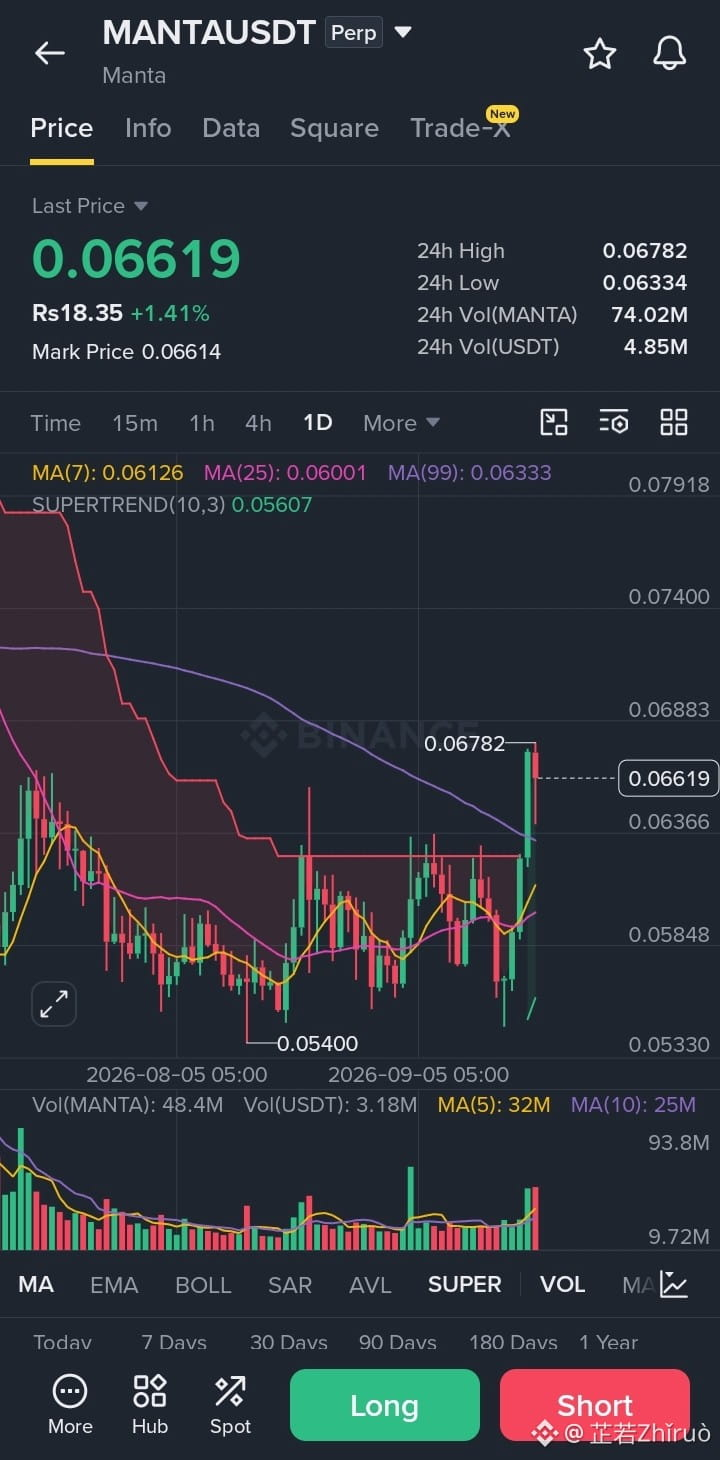
Los indicadores técnicos de este gráfico diario $MANTA
{future}(MANTAUSDT)
/USDT muestran un fuerte patrón de ruptura alcista, saliendo de una consolidación:
1. Medias Móviles Clave (Alineación Alcista)
* MA(7): 0.06126
* MA(25): 0.06001
* MA(99): 0.06333
El precio actual de 0.06619 cotiza por encima de todas las principales medias móviles (MA7, MA25, MA99). Crucialmente, el último impulso diario ha empujado el precio con claridad por encima de la resistencia de la MA(99) a largo plazo en 0.06333, señalando un cambio importante de tendencia tras la fase de suelo.
2. Indicador Supertrend (Señal Alcista)
* Supertrend (10,3): 0.05607
* Estado de la Tendencia Actual: Alcista / Línea Verde
La línea de Supertrend se mantiene verde muy por debajo del precio en 0.05607, confirmando la estructura alcista general en el marco temporal diario.
3. Acción del Precio y Dinámica de Volumen
* Precio Actual: 0.06619 (+1.41%)
* Máximo 24h: 0.06782
* Mínimo 24h: 0.06334
* Suelo Local: 0.05400
* Volumen: el volumen de MA(5) se sitúa en 32M MANTA, con barras verdes que se están expandiendo de forma notable y respaldan el movimiento.
Conclusiones clave
* Perspectiva a Corto Plazo: Ruptura alcista fuerte. Recuperar la línea de la MA(99) a largo plazo (~0.06333) invalida la tendencia bajista macro y abre espacio para una expansión.
* Resistencia Inmediata: el Máximo de 24h en 0.06782, seguido de objetivos estructurales más altos alrededor de 0.07400.
* Niveles de Soporte Clave:
* 0.06333 (MA99): soporte inmediato crucial; la resistencia dinámica previa se volvió soporte.
* 0.06126 (MA7): línea secundaria de soporte dinámico a corto plazo.
* 0.05607: nivel de seguridad de la base del Supertrend.
* Nota de Operativa: Mientras el precio cierre las velas diarias por encima del nivel de la MA(99) (0.06333), el impulso favorece fuertemente a los compradores. Un retroceso para volver a probar 0.06330–0.06350 serviría como confirmación estándar de la ruptura.#BTCBreaks80K #LineraShutsDownAfterFundraisingFallsShort
Los indicadores técnicos de este gráfico diario $MANTA
/USDT muestran un fuerte patrón de ruptura alcista, saliendo de una consolidación:
1. Medias Móviles Clave (Alineación Alcista)
* MA(7): 0.06126
* MA(25): 0.06001
* MA(99): 0.06333
El precio actual de 0.06619 cotiza por encima de todas las principales medias móviles (MA7, MA25, MA99). Crucialmente, el último impulso diario ha empujado el precio con claridad por encima de la resistencia de la MA(99) a largo plazo en 0.06333, señalando un cambio importante de tendencia tras la fase de suelo.
2. Indicador Supertrend (Señal Alcista)
* Supertrend (10,3): 0.05607
* Estado de la Tendencia Actual: Alcista / Línea Verde
La línea de Supertrend se mantiene verde muy por debajo del precio en 0.05607, confirmando la estructura alcista general en el marco temporal diario.
3. Acción del Precio y Dinámica de Volumen
* Precio Actual: 0.06619 (+1.41%)
* Máximo 24h: 0.06782
* Mínimo 24h: 0.06334
* Suelo Local: 0.05400
* Volumen: el volumen de MA(5) se sitúa en 32M MANTA, con barras verdes que se están expandiendo de forma notable y respaldan el movimiento.
Conclusiones clave
* Perspectiva a Corto Plazo: Ruptura alcista fuerte. Recuperar la línea de la MA(99) a largo plazo (~0.06333) invalida la tendencia bajista macro y abre espacio para una expansión.
* Resistencia Inmediata: el Máximo de 24h en 0.06782, seguido de objetivos estructurales más altos alrededor de 0.07400.
* Niveles de Soporte Clave:
* 0.06333 (MA99): soporte inmediato crucial; la resistencia dinámica previa se volvió soporte.
* 0.06126 (MA7): línea secundaria de soporte dinámico a corto plazo.
* 0.05607: nivel de seguridad de la base del Supertrend.
* Nota de Operativa: Mientras el precio cierre las velas diarias por encima del nivel de la MA(99) (0.06333), el impulso favorece fuertemente a los compradores. Un retroceso para volver a probar 0.06330–0.06350 serviría como confirmación estándar de la ruptura.#BTCBreaks80K #LineraShutsDownAfterFundraisingFallsShort
/USDT muestran un fuerte patrón de ruptura alcista, saliendo de una consolidación:
1. Medias Móviles Clave (Alineación Alcista)
* MA(7): 0.06126
* MA(25): 0.06001
* MA(99): 0.06333
El precio actual de 0.06619 cotiza por encima de todas las principales medias móviles (MA7, MA25, MA99). Crucialmente, el último impulso diario ha empujado el precio con claridad por encima de la resistencia de la MA(99) a largo plazo en 0.06333, señalando un cambio importante de tendencia tras la fase de suelo.
2. Indicador Supertrend (Señal Alcista)
* Supertrend (10,3): 0.05607
* Estado de la Tendencia Actual: Alcista / Línea Verde
La línea de Supertrend se mantiene verde muy por debajo del precio en 0.05607, confirmando la estructura alcista general en el marco temporal diario.
3. Acción del Precio y Dinámica de Volumen
* Precio Actual: 0.06619 (+1.41%)
* Máximo 24h: 0.06782
* Mínimo 24h: 0.06334
* Suelo Local: 0.05400
* Volumen: el volumen de MA(5) se sitúa en 32M MANTA, con barras verdes que se están expandiendo de forma notable y respaldan el movimiento.
Conclusiones clave
* Perspectiva a Corto Plazo: Ruptura alcista fuerte. Recuperar la línea de la MA(99) a largo plazo (~0.06333) invalida la tendencia bajista macro y abre espacio para una expansión.
* Resistencia Inmediata: el Máximo de 24h en 0.06782, seguido de objetivos estructurales más altos alrededor de 0.07400.
* Niveles de Soporte Clave:
* 0.06333 (MA99): soporte inmediato crucial; la resistencia dinámica previa se volvió soporte.
* 0.06126 (MA7): línea secundaria de soporte dinámico a corto plazo.
* 0.05607: nivel de seguridad de la base del Supertrend.
* Nota de Operativa: Mientras el precio cierre las velas diarias por encima del nivel de la MA(99) (0.06333), el impulso favorece fuertemente a los compradores. Un retroceso para volver a probar 0.06330–0.06350 serviría como confirmación estándar de la ruptura.#BTCBreaks80K #LineraShutsDownAfterFundraisingFallsShort
1
53
·
--
Alcista
Los indicadores técnicos de este gráfico diario $MIRA
{future}(MIRAUSDT)
/USDT reflejan una estructura de recuperación gradual con una alineación alcista a corto plazo:
1. Medias Móviles Clave (Alineación Alcista)
* MA(7): 0.04735
* MA(25): 0.04637
* MA(99): 0.04426
El precio actual de 0.05001 cotiza por encima de todas las medias móviles clave. La MA a corto plazo (7) se sitúa por encima tanto de la MA(25) como de la MA(99), mientras que la acción del precio recientemente ha recuperado la MA(99) de largo plazo, señalando un cambio de tendencia desde el mínimo de 0.03682.
2. Indicador Supertrend (Soporte Alcista)
* Supertrend (10,3): 0.04110
* Estado de la Tendencia Actual: Alcista / Línea Verde
El indicador Supertrend está en verde y va quedando por debajo de la acción del precio en 0.04110, estableciendo una base macro alcista en el marco temporal diario.
3. Acción del Precio y Perfil de Volumen
* Precio Actual: 0.05001 (+1.89%)
* Máximo / Mínimo 24h: 0.05445 / 0.04784
* Resistencia Local Pico: 0.05968
* Volumen: El volumen de MA(5) se sitúa en 59.2M MIRA con una actividad de trading moderada.
Conclusiones clave
* Perspectiva a Corto Plazo: Estructura de recuperación alcista. Recuperar la línea de la MA(99) (~0.04426) aporta una base sólida para el impulso alcista.
* Niveles Clave de Soporte:
* 0.04735 (MA7): Nivel de soporte dinámico inmediato.
* 0.04637 (MA25) / 0.04426 (MA99): Conjunto de soportes fuertes de medias móviles.
* 0.04110: Soporte base del Supertrend.
* Niveles Clave de Resistencia:
* 0.05445: Máximo de 24h.
* 0.05968: Resistencia mayor de swing local.
* Nota de Trading: El precio se acerca a la zona de resistencia 0.05445–0.05968, que ha generado mechas superiores largas en intentos anteriores. Mantenerse por encima de la MA(7) mantiene el impulso a favor de los compradores para un posible retest de esos niveles altos.#BTCBreaks80K #BOJRaisesRatesTo31YearHigh
Los indicadores técnicos de este gráfico diario $MIRA
/USDT reflejan una estructura de recuperación gradual con una alineación alcista a corto plazo:
1. Medias Móviles Clave (Alineación Alcista)
* MA(7): 0.04735
* MA(25): 0.04637
* MA(99): 0.04426
El precio actual de 0.05001 cotiza por encima de todas las medias móviles clave. La MA a corto plazo (7) se sitúa por encima tanto de la MA(25) como de la MA(99), mientras que la acción del precio recientemente ha recuperado la MA(99) de largo plazo, señalando un cambio de tendencia desde el mínimo de 0.03682.
2. Indicador Supertrend (Soporte Alcista)
* Supertrend (10,3): 0.04110
* Estado de la Tendencia Actual: Alcista / Línea Verde
El indicador Supertrend está en verde y va quedando por debajo de la acción del precio en 0.04110, estableciendo una base macro alcista en el marco temporal diario.
3. Acción del Precio y Perfil de Volumen
* Precio Actual: 0.05001 (+1.89%)
* Máximo / Mínimo 24h: 0.05445 / 0.04784
* Resistencia Local Pico: 0.05968
* Volumen: El volumen de MA(5) se sitúa en 59.2M MIRA con una actividad de trading moderada.
Conclusiones clave
* Perspectiva a Corto Plazo: Estructura de recuperación alcista. Recuperar la línea de la MA(99) (~0.04426) aporta una base sólida para el impulso alcista.
* Niveles Clave de Soporte:
* 0.04735 (MA7): Nivel de soporte dinámico inmediato.
* 0.04637 (MA25) / 0.04426 (MA99): Conjunto de soportes fuertes de medias móviles.
* 0.04110: Soporte base del Supertrend.
* Niveles Clave de Resistencia:
* 0.05445: Máximo de 24h.
* 0.05968: Resistencia mayor de swing local.
* Nota de Trading: El precio se acerca a la zona de resistencia 0.05445–0.05968, que ha generado mechas superiores largas en intentos anteriores. Mantenerse por encima de la MA(7) mantiene el impulso a favor de los compradores para un posible retest de esos niveles altos.#BTCBreaks80K #BOJRaisesRatesTo31YearHigh
/USDT reflejan una estructura de recuperación gradual con una alineación alcista a corto plazo:
1. Medias Móviles Clave (Alineación Alcista)
* MA(7): 0.04735
* MA(25): 0.04637
* MA(99): 0.04426
El precio actual de 0.05001 cotiza por encima de todas las medias móviles clave. La MA a corto plazo (7) se sitúa por encima tanto de la MA(25) como de la MA(99), mientras que la acción del precio recientemente ha recuperado la MA(99) de largo plazo, señalando un cambio de tendencia desde el mínimo de 0.03682.
2. Indicador Supertrend (Soporte Alcista)
* Supertrend (10,3): 0.04110
* Estado de la Tendencia Actual: Alcista / Línea Verde
El indicador Supertrend está en verde y va quedando por debajo de la acción del precio en 0.04110, estableciendo una base macro alcista en el marco temporal diario.
3. Acción del Precio y Perfil de Volumen
* Precio Actual: 0.05001 (+1.89%)
* Máximo / Mínimo 24h: 0.05445 / 0.04784
* Resistencia Local Pico: 0.05968
* Volumen: El volumen de MA(5) se sitúa en 59.2M MIRA con una actividad de trading moderada.
Conclusiones clave
* Perspectiva a Corto Plazo: Estructura de recuperación alcista. Recuperar la línea de la MA(99) (~0.04426) aporta una base sólida para el impulso alcista.
* Niveles Clave de Soporte:
* 0.04735 (MA7): Nivel de soporte dinámico inmediato.
* 0.04637 (MA25) / 0.04426 (MA99): Conjunto de soportes fuertes de medias móviles.
* 0.04110: Soporte base del Supertrend.
* Niveles Clave de Resistencia:
* 0.05445: Máximo de 24h.
* 0.05968: Resistencia mayor de swing local.
* Nota de Trading: El precio se acerca a la zona de resistencia 0.05445–0.05968, que ha generado mechas superiores largas en intentos anteriores. Mantenerse por encima de la MA(7) mantiene el impulso a favor de los compradores para un posible retest de esos niveles altos.#BTCBreaks80K #BOJRaisesRatesTo31YearHigh
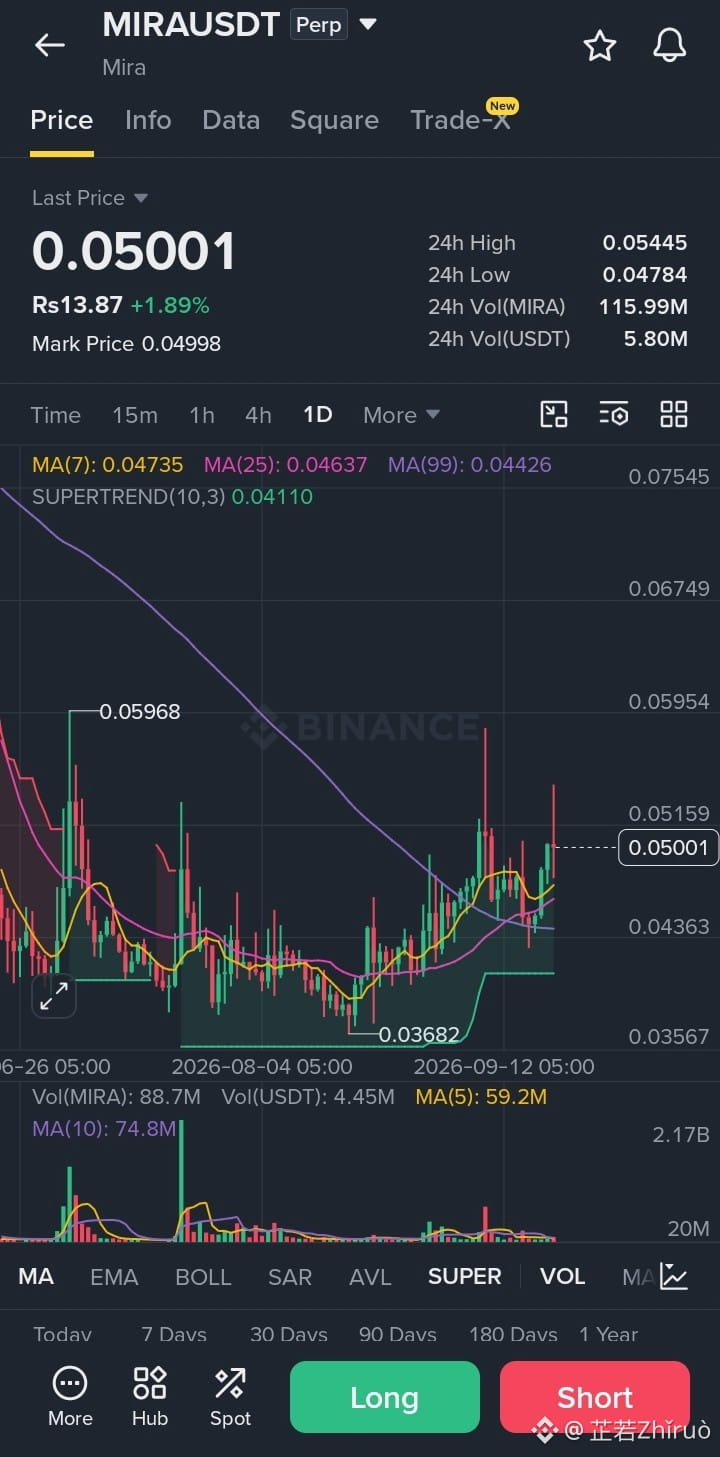
1
23
·
--
Alcista
Ver traducción
The technical indicators on this $CTSI
{future}(CTSIUSDT)
/USDT daily chart show a strong volatility spike with bullish momentum:
1. Key Moving Averages (Bullish Alignment)
* MA(7): 0.02620
* MA(25): 0.02536
* MA(99): 0.02403
The current price of 0.02921 is trading above all major moving averages. The MA(7) sits above both the MA(25) and MA(99), indicating short-to-medium-term bullish alignment following a prolonged base building phase near the 0.02029 low.
2. Supertrend Indicator (Bullish Signal)
* Supertrend (10,3): 0.02414
* Current Trend Status: Bullish / Green Line
The Supertrend indicator is green and sitting well below the current price at 0.02414, confirming that the overall technical trend has shifted to bullish.
3. Price Action & Volatility
* Current Price: 0.02921 (+10.90%)
* 24h High: 0.03554
* 24h Low: 0.02615
* Historical Spikes: 0.03945
* Volume: MA(5) volume stands at 203M CTSI alongside a noticeable expansion in volume bars.
Key Takeaways
* Short-Term Outlook: High-volatility upward breakout attempt.
* Rejection / Resistance: The daily candle shows a very long upper wick reaching near the 24h High (0.03554) before retracing to 0.02921. This signals strong selling pressure or profit-taking on initial pumps near ~0.0350–0.0394.
* Key Support Levels:
* 0.02620 (MA7): Dynamic immediate support.
* 0.02536 (MA25): Secondary support line.
* 0.02414: Supertrend support level.
* Trading Note: Long wicks indicate fast moves that quickly exhaust buyers. Chasing high spikes on CTSI carries retrace risk; waiting for stabilization near support levels (MA7 around ~0.0262) generally offers better risk-reward entries.#LineraShutsDownAfterFundraisingFallsShort
The technical indicators on this $CTSI
/USDT daily chart show a strong volatility spike with bullish momentum:
1. Key Moving Averages (Bullish Alignment)
* MA(7): 0.02620
* MA(25): 0.02536
* MA(99): 0.02403
The current price of 0.02921 is trading above all major moving averages. The MA(7) sits above both the MA(25) and MA(99), indicating short-to-medium-term bullish alignment following a prolonged base building phase near the 0.02029 low.
2. Supertrend Indicator (Bullish Signal)
* Supertrend (10,3): 0.02414
* Current Trend Status: Bullish / Green Line
The Supertrend indicator is green and sitting well below the current price at 0.02414, confirming that the overall technical trend has shifted to bullish.
3. Price Action & Volatility
* Current Price: 0.02921 (+10.90%)
* 24h High: 0.03554
* 24h Low: 0.02615
* Historical Spikes: 0.03945
* Volume: MA(5) volume stands at 203M CTSI alongside a noticeable expansion in volume bars.
Key Takeaways
* Short-Term Outlook: High-volatility upward breakout attempt.
* Rejection / Resistance: The daily candle shows a very long upper wick reaching near the 24h High (0.03554) before retracing to 0.02921. This signals strong selling pressure or profit-taking on initial pumps near ~0.0350–0.0394.
* Key Support Levels:
* 0.02620 (MA7): Dynamic immediate support.
* 0.02536 (MA25): Secondary support line.
* 0.02414: Supertrend support level.
* Trading Note: Long wicks indicate fast moves that quickly exhaust buyers. Chasing high spikes on CTSI carries retrace risk; waiting for stabilization near support levels (MA7 around ~0.0262) generally offers better risk-reward entries.#LineraShutsDownAfterFundraisingFallsShort
/USDT daily chart show a strong volatility spike with bullish momentum:
1. Key Moving Averages (Bullish Alignment)
* MA(7): 0.02620
* MA(25): 0.02536
* MA(99): 0.02403
The current price of 0.02921 is trading above all major moving averages. The MA(7) sits above both the MA(25) and MA(99), indicating short-to-medium-term bullish alignment following a prolonged base building phase near the 0.02029 low.
2. Supertrend Indicator (Bullish Signal)
* Supertrend (10,3): 0.02414
* Current Trend Status: Bullish / Green Line
The Supertrend indicator is green and sitting well below the current price at 0.02414, confirming that the overall technical trend has shifted to bullish.
3. Price Action & Volatility
* Current Price: 0.02921 (+10.90%)
* 24h High: 0.03554
* 24h Low: 0.02615
* Historical Spikes: 0.03945
* Volume: MA(5) volume stands at 203M CTSI alongside a noticeable expansion in volume bars.
Key Takeaways
* Short-Term Outlook: High-volatility upward breakout attempt.
* Rejection / Resistance: The daily candle shows a very long upper wick reaching near the 24h High (0.03554) before retracing to 0.02921. This signals strong selling pressure or profit-taking on initial pumps near ~0.0350–0.0394.
* Key Support Levels:
* 0.02620 (MA7): Dynamic immediate support.
* 0.02536 (MA25): Secondary support line.
* 0.02414: Supertrend support level.
* Trading Note: Long wicks indicate fast moves that quickly exhaust buyers. Chasing high spikes on CTSI carries retrace risk; waiting for stabilization near support levels (MA7 around ~0.0262) generally offers better risk-reward entries.#LineraShutsDownAfterFundraisingFallsShort
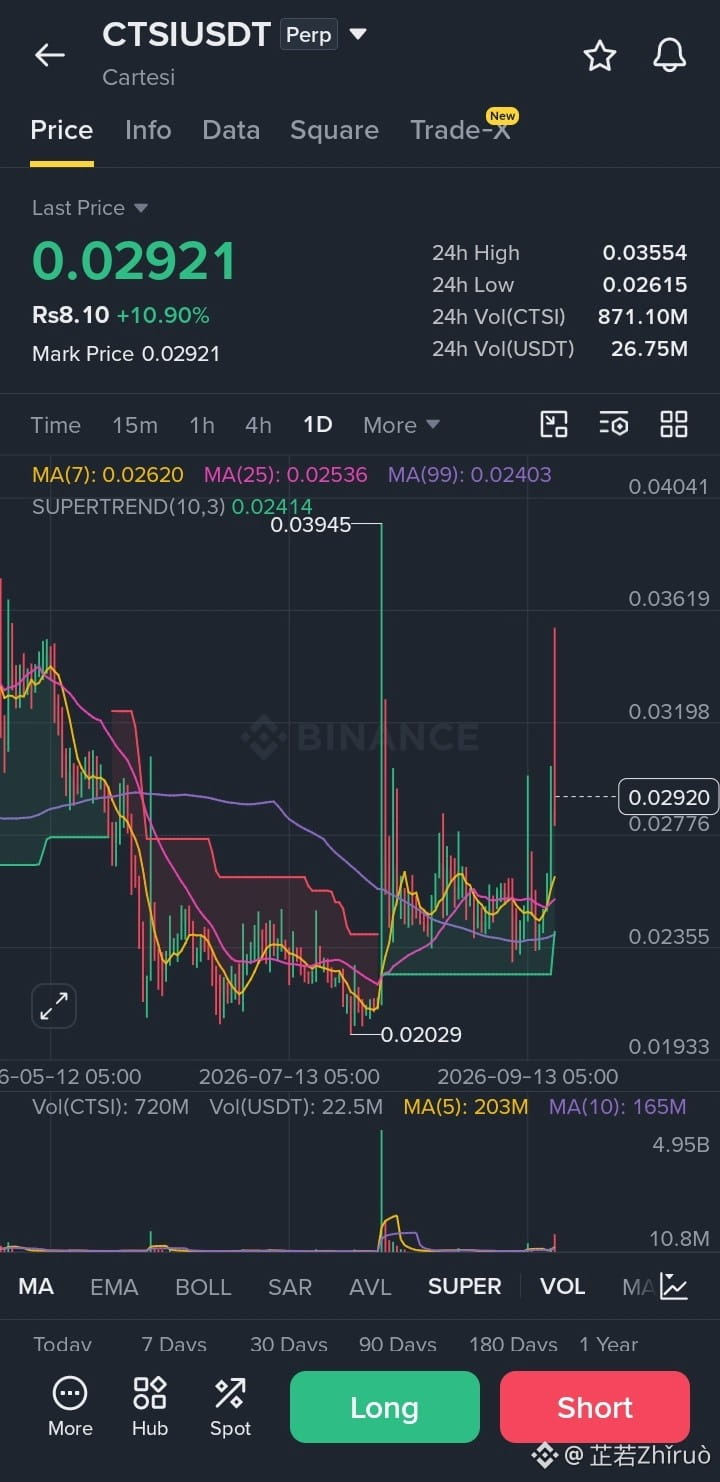
63
·
--
Alcista
Ver traducción
The technical indicators on this $ZIL
{future}(ZILUSDT)
/USDT daily chart show a strong short-term bullish momentum:
1. Key Moving Averages (Strong Bullish Crossover)
* MA(7): 0.003114
* MA(25): 0.002839
* MA(99): 0.002777
The current price of 0.003643 is trading well above all major moving averages (MA7, MA25, MA99). The MA(7) has steeply crossed above both the MA(25) and MA(99), signaling a powerful short-term momentum shift.
2. Supertrend Indicator (Bullish Flip)
* Supertrend (10,3): 0.002906
* Current Trend Status: Bullish / Green Line
The Supertrend indicator has flipped to green below the price at 0.002906, confirming a bullish regime shift and acting as a primary trend support level.
3. Price Action & Volume Dynamics
* 24h High: 0.004379
* Current Price: 0.003643 (+12.61%)
* Local Bottom / Low: 0.002177
* Volume Spike: A noticeable surge in volume is visible at the bottom right, with MA(5) volume reaching 5.23B ZIL, confirming strong buyer participation behind the sudden price expansion.
Key Takeaways
* Short-Term Outlook: Strongly bullish momentum driven by a massive vertical green daily candle and heavy volume expansion.
* Immediate Resistance: The 24h high at 0.004379 and the previous local high around 0.004690.
* Key Support Levels:
* 0.003114 (MA7): First dynamic support in case of a pull-back.
* 0.002906: Supertrend support line.
* Risk Factor: The long upper wick on the latest daily candle indicates profit-taking near 0.004379. Expect potential volatility or consolidation around current levels before another attempt at high resistance.#LineraShutsDownAfterFundraisingFallsShort
The technical indicators on this $ZIL
/USDT daily chart show a strong short-term bullish momentum:
1. Key Moving Averages (Strong Bullish Crossover)
* MA(7): 0.003114
* MA(25): 0.002839
* MA(99): 0.002777
The current price of 0.003643 is trading well above all major moving averages (MA7, MA25, MA99). The MA(7) has steeply crossed above both the MA(25) and MA(99), signaling a powerful short-term momentum shift.
2. Supertrend Indicator (Bullish Flip)
* Supertrend (10,3): 0.002906
* Current Trend Status: Bullish / Green Line
The Supertrend indicator has flipped to green below the price at 0.002906, confirming a bullish regime shift and acting as a primary trend support level.
3. Price Action & Volume Dynamics
* 24h High: 0.004379
* Current Price: 0.003643 (+12.61%)
* Local Bottom / Low: 0.002177
* Volume Spike: A noticeable surge in volume is visible at the bottom right, with MA(5) volume reaching 5.23B ZIL, confirming strong buyer participation behind the sudden price expansion.
Key Takeaways
* Short-Term Outlook: Strongly bullish momentum driven by a massive vertical green daily candle and heavy volume expansion.
* Immediate Resistance: The 24h high at 0.004379 and the previous local high around 0.004690.
* Key Support Levels:
* 0.003114 (MA7): First dynamic support in case of a pull-back.
* 0.002906: Supertrend support line.
* Risk Factor: The long upper wick on the latest daily candle indicates profit-taking near 0.004379. Expect potential volatility or consolidation around current levels before another attempt at high resistance.#LineraShutsDownAfterFundraisingFallsShort
/USDT daily chart show a strong short-term bullish momentum:
1. Key Moving Averages (Strong Bullish Crossover)
* MA(7): 0.003114
* MA(25): 0.002839
* MA(99): 0.002777
The current price of 0.003643 is trading well above all major moving averages (MA7, MA25, MA99). The MA(7) has steeply crossed above both the MA(25) and MA(99), signaling a powerful short-term momentum shift.
2. Supertrend Indicator (Bullish Flip)
* Supertrend (10,3): 0.002906
* Current Trend Status: Bullish / Green Line
The Supertrend indicator has flipped to green below the price at 0.002906, confirming a bullish regime shift and acting as a primary trend support level.
3. Price Action & Volume Dynamics
* 24h High: 0.004379
* Current Price: 0.003643 (+12.61%)
* Local Bottom / Low: 0.002177
* Volume Spike: A noticeable surge in volume is visible at the bottom right, with MA(5) volume reaching 5.23B ZIL, confirming strong buyer participation behind the sudden price expansion.
Key Takeaways
* Short-Term Outlook: Strongly bullish momentum driven by a massive vertical green daily candle and heavy volume expansion.
* Immediate Resistance: The 24h high at 0.004379 and the previous local high around 0.004690.
* Key Support Levels:
* 0.003114 (MA7): First dynamic support in case of a pull-back.
* 0.002906: Supertrend support line.
* Risk Factor: The long upper wick on the latest daily candle indicates profit-taking near 0.004379. Expect potential volatility or consolidation around current levels before another attempt at high resistance.#LineraShutsDownAfterFundraisingFallsShort
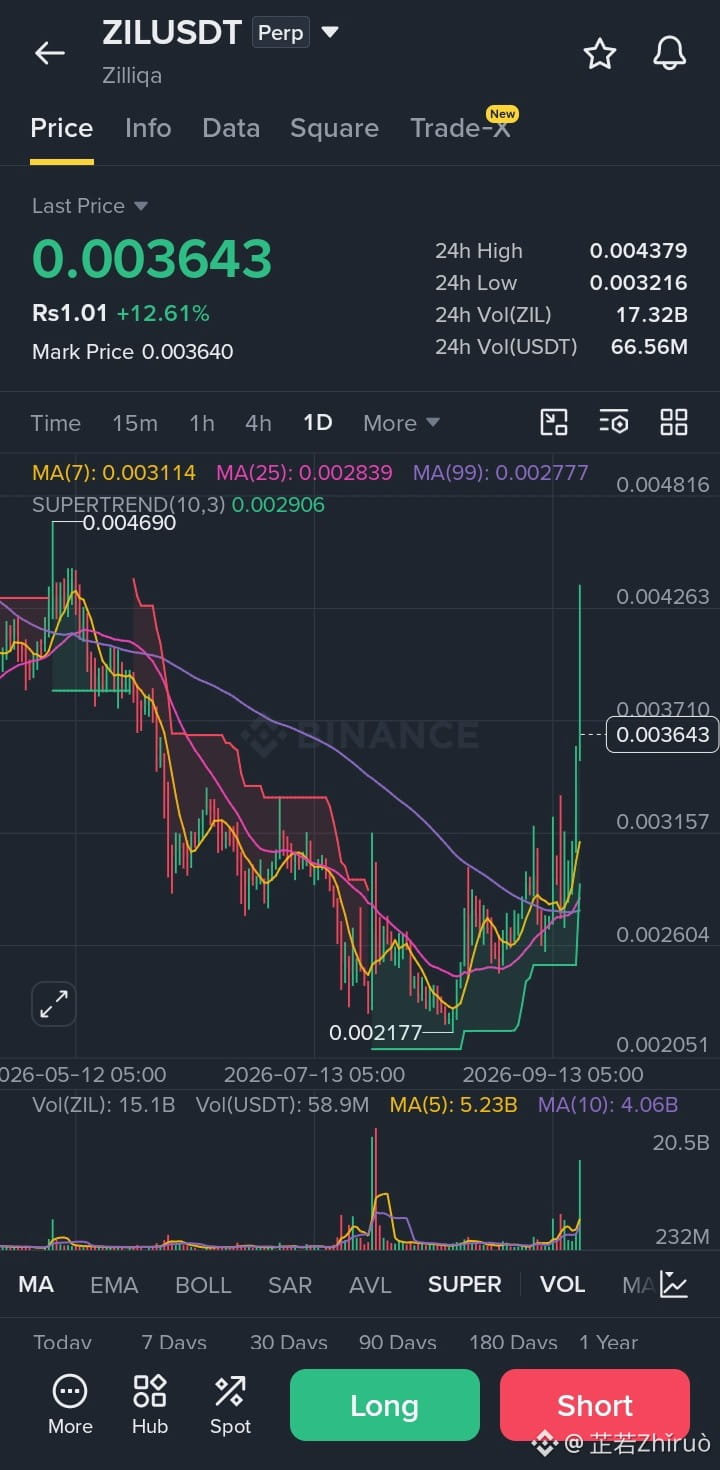
70
·
--
Alcista
Ver traducción
The technical indicators visible on this $FLOW
{future}(FLOWUSDT)
/USDT daily chart show a mixed short-term outlook:
1. Key Moving Averages (Bullish Alignment)
* MA(7): 0.02881
* MA(25): 0.02824
* MA(99): 0.02805
The current price of 0.03031 is trading above all three moving averages. Additionally, the short-term MA(7) has crossed above the longer-term MAs (MA25 & MA99), forming a classic golden-cross alignment that signals short-term upward momentum.
2. Supertrend Indicator (Resistance Ahead)
* Supertrend (10,3): 0.03137
* Current Trend Status: Bearish / Red Line
Even though price action is moving upward, the Supertrend line sits above the current price at 0.03137, acting as immediate overhead resistance.
* Key Level to Watch: A daily candle close above 0.03137 is required to flip the Supertrend to bullish (green) and confirm a trend reversal.
3. Price Action & Resistance Levels
* Local High Resistance: 0.03412 (seen on the far left)
* 24h High: 0.03090
* Local Low Support: 0.02525
The recent green daily candles show a decent recovery from the 0.02525 trough. However, price is approaching a heavy resistance zone between the current high of ~0.03090 and the Supertrend level at 0.03137.
Key Takeaways
* Short-Term Trend: Bullish recovery (price above MAs).
* Crucial Rejection/Breakout Zone: 0.03090 – 0.03137.
* If price gets rejected around 0.03137, it may pull back to retest the 0.02881 (MA7) support region.
* If price cleanly breaks and closes above 0.03137, the technical bias turns fully bullish toward the next major resistance at 0.03412.#XRPExchangeReservesHitSevenYearLow
The technical indicators visible on this $FLOW
/USDT daily chart show a mixed short-term outlook:
1. Key Moving Averages (Bullish Alignment)
* MA(7): 0.02881
* MA(25): 0.02824
* MA(99): 0.02805
The current price of 0.03031 is trading above all three moving averages. Additionally, the short-term MA(7) has crossed above the longer-term MAs (MA25 & MA99), forming a classic golden-cross alignment that signals short-term upward momentum.
2. Supertrend Indicator (Resistance Ahead)
* Supertrend (10,3): 0.03137
* Current Trend Status: Bearish / Red Line
Even though price action is moving upward, the Supertrend line sits above the current price at 0.03137, acting as immediate overhead resistance.
* Key Level to Watch: A daily candle close above 0.03137 is required to flip the Supertrend to bullish (green) and confirm a trend reversal.
3. Price Action & Resistance Levels
* Local High Resistance: 0.03412 (seen on the far left)
* 24h High: 0.03090
* Local Low Support: 0.02525
The recent green daily candles show a decent recovery from the 0.02525 trough. However, price is approaching a heavy resistance zone between the current high of ~0.03090 and the Supertrend level at 0.03137.
Key Takeaways
* Short-Term Trend: Bullish recovery (price above MAs).
* Crucial Rejection/Breakout Zone: 0.03090 – 0.03137.
* If price gets rejected around 0.03137, it may pull back to retest the 0.02881 (MA7) support region.
* If price cleanly breaks and closes above 0.03137, the technical bias turns fully bullish toward the next major resistance at 0.03412.#XRPExchangeReservesHitSevenYearLow
/USDT daily chart show a mixed short-term outlook:
1. Key Moving Averages (Bullish Alignment)
* MA(7): 0.02881
* MA(25): 0.02824
* MA(99): 0.02805
The current price of 0.03031 is trading above all three moving averages. Additionally, the short-term MA(7) has crossed above the longer-term MAs (MA25 & MA99), forming a classic golden-cross alignment that signals short-term upward momentum.
2. Supertrend Indicator (Resistance Ahead)
* Supertrend (10,3): 0.03137
* Current Trend Status: Bearish / Red Line
Even though price action is moving upward, the Supertrend line sits above the current price at 0.03137, acting as immediate overhead resistance.
* Key Level to Watch: A daily candle close above 0.03137 is required to flip the Supertrend to bullish (green) and confirm a trend reversal.
3. Price Action & Resistance Levels
* Local High Resistance: 0.03412 (seen on the far left)
* 24h High: 0.03090
* Local Low Support: 0.02525
The recent green daily candles show a decent recovery from the 0.02525 trough. However, price is approaching a heavy resistance zone between the current high of ~0.03090 and the Supertrend level at 0.03137.
Key Takeaways
* Short-Term Trend: Bullish recovery (price above MAs).
* Crucial Rejection/Breakout Zone: 0.03090 – 0.03137.
* If price gets rejected around 0.03137, it may pull back to retest the 0.02881 (MA7) support region.
* If price cleanly breaks and closes above 0.03137, the technical bias turns fully bullish toward the next major resistance at 0.03412.#XRPExchangeReservesHitSevenYearLow
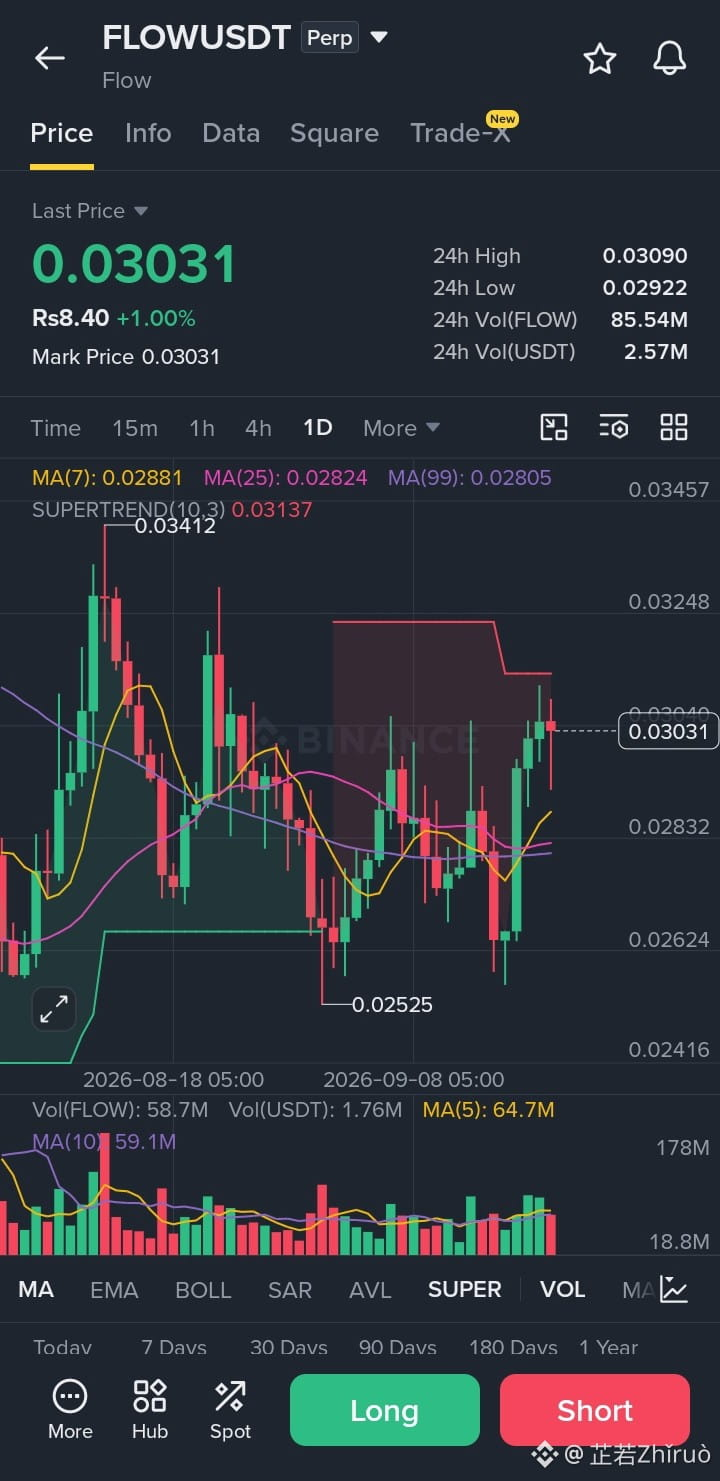
61
·
--
Alcista
Basado en el gráfico diario para $PIEVERSE
{future}(PIEVERSEUSDT)
USDT Perp (Pieverse):
Indicadores y datos técnicos clave
* Precio actual: 1.8301 USDT (+12.30%)
* Medias móviles (MAs):
* MA(7): 1.4043
* MA(25): 1.2030
* MA(99): 0.8593
* Observación: El precio está en una expansión vertical agresiva muy por encima de todas las medias móviles de corto, medio y largo plazo.
* Indicador Supertrend (10,3):
* Nivel de Supertrend: 1.1556 (Verde)
* Observación: El Supertrend está en verde y subiendo, confirmando un fuerte impulso alcista a nivel macro.
* Niveles de soporte y resistencia:
* Soporte inmediato: ~1.7164 – 1.8000 (zona de consolidación local).
* Soporte clave: ~1.5101 (mínimo de 24h).
* Soporte dinámico mayor: 1.4043 (línea dinámica de soporte MA7).
* Resistencia inmediata: ~1.9357 (máximo de 24h y pico local).
* Objetivo psicológico: 2.0000.
Análisis del gráfico
* Fuerte carrera parabólica: PIEVERSE se ha salido de un patrón de consolidación de mínimo más alto cerca de ~1.1500 y ha subido hasta el nivel 1.9357.
* Estiramiento de MAs: El precio está estirado significativamente por encima de la tendencia dinámica de 1.4043 (MA7), lo que señala un impulso fuerte pero también posible volatilidad o retrocesos menores para enfriar condiciones de sobrecompra.
* Confirmación por volumen: La ruptura está respaldada por una expansión constante del volumen (20.99M PIEVERSE / 35.48M USDT volumen 24h).
Posibles configuraciones de trading
Opción A: Entrada por retroceso (Long)
* Rango de entrada: 1.5100 – 1.6500 (cerca del mínimo de 24h y de la zona de soporte intermedia).
* Objetivo 1: 1.8300
* Objetivo 2: 1.9350 (retest del máximo de 24h)
* Stop-Loss: Por debajo de 1.3800 (debajo del soporte MA7).
Opción B: Continuación por ruptura de resistencia
* Disparador: Cierre de la vela diaria por encima de 1.9400 (superando el pico de 1.9357).
* Objetivo 1: 2.1500
* Objetivo 2: 2.4000
* Stop-Loss: Por debajo de 1.7200.#VietnamPlansFirstCryptoLicensesIn2026 #BOJRaisesRatesTo31YearHigh
Basado en el gráfico diario para $PIEVERSE
USDT Perp (Pieverse):
Indicadores y datos técnicos clave
* Precio actual: 1.8301 USDT (+12.30%)
* Medias móviles (MAs):
* MA(7): 1.4043
* MA(25): 1.2030
* MA(99): 0.8593
* Observación: El precio está en una expansión vertical agresiva muy por encima de todas las medias móviles de corto, medio y largo plazo.
* Indicador Supertrend (10,3):
* Nivel de Supertrend: 1.1556 (Verde)
* Observación: El Supertrend está en verde y subiendo, confirmando un fuerte impulso alcista a nivel macro.
* Niveles de soporte y resistencia:
* Soporte inmediato: ~1.7164 – 1.8000 (zona de consolidación local).
* Soporte clave: ~1.5101 (mínimo de 24h).
* Soporte dinámico mayor: 1.4043 (línea dinámica de soporte MA7).
* Resistencia inmediata: ~1.9357 (máximo de 24h y pico local).
* Objetivo psicológico: 2.0000.
Análisis del gráfico
* Fuerte carrera parabólica: PIEVERSE se ha salido de un patrón de consolidación de mínimo más alto cerca de ~1.1500 y ha subido hasta el nivel 1.9357.
* Estiramiento de MAs: El precio está estirado significativamente por encima de la tendencia dinámica de 1.4043 (MA7), lo que señala un impulso fuerte pero también posible volatilidad o retrocesos menores para enfriar condiciones de sobrecompra.
* Confirmación por volumen: La ruptura está respaldada por una expansión constante del volumen (20.99M PIEVERSE / 35.48M USDT volumen 24h).
Posibles configuraciones de trading
Opción A: Entrada por retroceso (Long)
* Rango de entrada: 1.5100 – 1.6500 (cerca del mínimo de 24h y de la zona de soporte intermedia).
* Objetivo 1: 1.8300
* Objetivo 2: 1.9350 (retest del máximo de 24h)
* Stop-Loss: Por debajo de 1.3800 (debajo del soporte MA7).
Opción B: Continuación por ruptura de resistencia
* Disparador: Cierre de la vela diaria por encima de 1.9400 (superando el pico de 1.9357).
* Objetivo 1: 2.1500
* Objetivo 2: 2.4000
* Stop-Loss: Por debajo de 1.7200.#VietnamPlansFirstCryptoLicensesIn2026 #BOJRaisesRatesTo31YearHigh
USDT Perp (Pieverse):
Indicadores y datos técnicos clave
* Precio actual: 1.8301 USDT (+12.30%)
* Medias móviles (MAs):
* MA(7): 1.4043
* MA(25): 1.2030
* MA(99): 0.8593
* Observación: El precio está en una expansión vertical agresiva muy por encima de todas las medias móviles de corto, medio y largo plazo.
* Indicador Supertrend (10,3):
* Nivel de Supertrend: 1.1556 (Verde)
* Observación: El Supertrend está en verde y subiendo, confirmando un fuerte impulso alcista a nivel macro.
* Niveles de soporte y resistencia:
* Soporte inmediato: ~1.7164 – 1.8000 (zona de consolidación local).
* Soporte clave: ~1.5101 (mínimo de 24h).
* Soporte dinámico mayor: 1.4043 (línea dinámica de soporte MA7).
* Resistencia inmediata: ~1.9357 (máximo de 24h y pico local).
* Objetivo psicológico: 2.0000.
Análisis del gráfico
* Fuerte carrera parabólica: PIEVERSE se ha salido de un patrón de consolidación de mínimo más alto cerca de ~1.1500 y ha subido hasta el nivel 1.9357.
* Estiramiento de MAs: El precio está estirado significativamente por encima de la tendencia dinámica de 1.4043 (MA7), lo que señala un impulso fuerte pero también posible volatilidad o retrocesos menores para enfriar condiciones de sobrecompra.
* Confirmación por volumen: La ruptura está respaldada por una expansión constante del volumen (20.99M PIEVERSE / 35.48M USDT volumen 24h).
Posibles configuraciones de trading
Opción A: Entrada por retroceso (Long)
* Rango de entrada: 1.5100 – 1.6500 (cerca del mínimo de 24h y de la zona de soporte intermedia).
* Objetivo 1: 1.8300
* Objetivo 2: 1.9350 (retest del máximo de 24h)
* Stop-Loss: Por debajo de 1.3800 (debajo del soporte MA7).
Opción B: Continuación por ruptura de resistencia
* Disparador: Cierre de la vela diaria por encima de 1.9400 (superando el pico de 1.9357).
* Objetivo 1: 2.1500
* Objetivo 2: 2.4000
* Stop-Loss: Por debajo de 1.7200.#VietnamPlansFirstCryptoLicensesIn2026 #BOJRaisesRatesTo31YearHigh
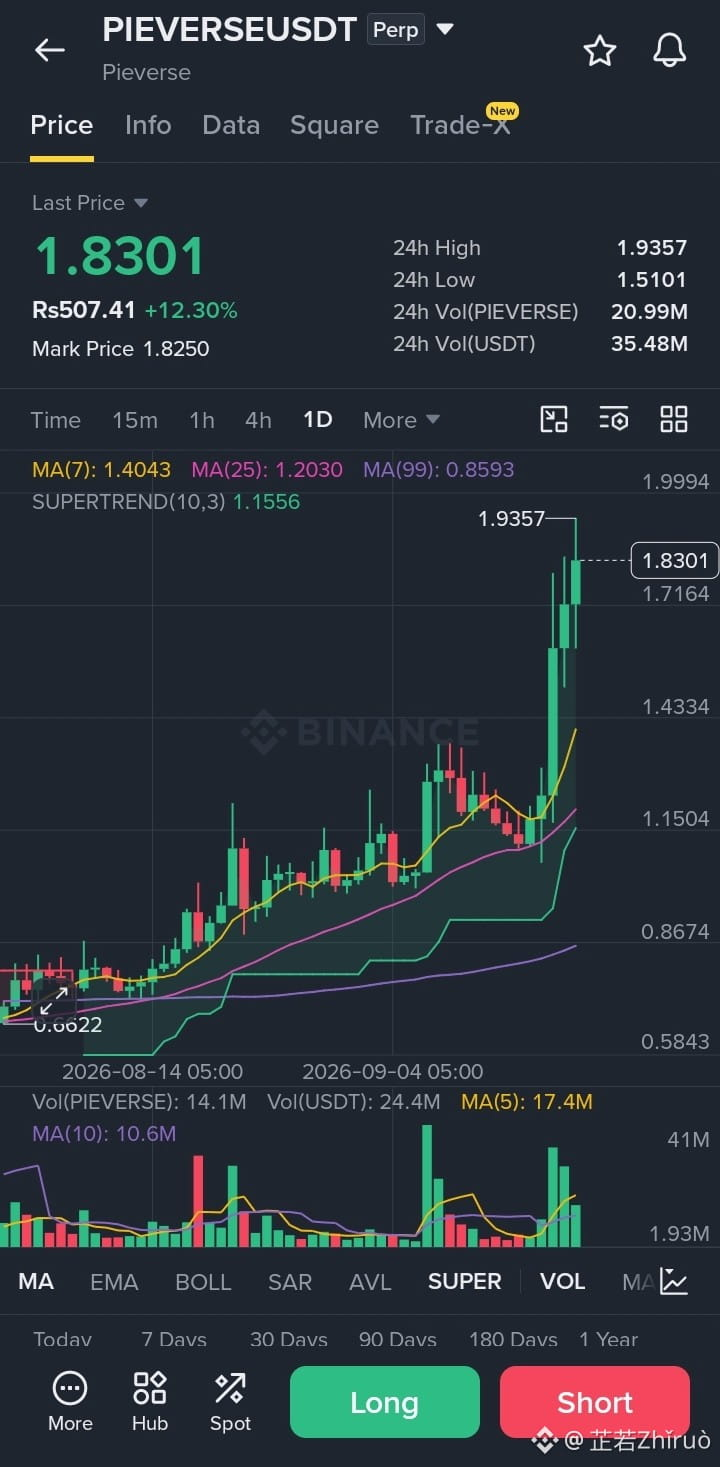
111
·
--
Alcista
Ver traducción
Based on the daily chart for $龙虾
{future}(龙虾USDT)
USDT Perp (Lobster / Longxia):
Key Technical Indicators & Data
* Current Price: 0.23985 USDT (+7.35%)
* Moving Averages (MAs):
* MA(7): 0.212644
* MA(25): 0.112903
* MA(99): 0.041209
* Observation: Price is in an aggressive upward parabolic trend, maintaining structural support above the steep MA(7) dynamic trendline.
* Supertrend Indicator (10,3):
* Supertrend Level: 0.130674 (Green)
* Observation: Supertrend is green and rising sharply, signaling strong long-term momentum.
* Support & Resistance Levels:
* Immediate Support: ~0.21264 – 0.21317 (24h Low and MA7 dynamic support zone).
* Key Support: ~0.18214 (Mid-candle structural support).
* Major Floor Support: ~0.11290 (MA25 baseline).
* Immediate Resistance: ~0.26666 (24h High).
* Major Resistance: 0.28736 (All-time high peak).
Chart Analysis
* Parabolic Momentum: The asset has surged multi-fold from its base low near 0.01757, making higher highs and higher lows in a rapid vertical trend.
* MA(7) Dynamic Support: Following a peak at 0.28736, price pulled back to retest short-term dynamic support at the 0.21264 (MA7) line, where buyers stepped in to print a green recovery candle.
* Volume Profile: Trading volume remains robust (254.94M 龙虾 / 59.50M USDT 24h volume), indicating continued trader engagement, though volume has slightly normalized compared to the initial breakout surge.
Potential Trade Setups
Option A: Dynamic Support Pullback (Long Entry)
* Entry Range: 0.21300 – 0.22500 (Near MA7 dynamic support and 24h Low).
* Target 1: 0.26600 (24h High retest)
* Target 2: 0.28700 (Re-testing ATH peak)
* Stop-Loss: Below 0.19800 (Below MA7 and recent daily candle bodies).
Option B: ATH Breakout Continuation
* Trigger: Daily candle close above 0.26700 (Clearing 24h High resistance).
* Target 1: 0.28700
* Target 2: 0.32000
* Stop-Loss: Below 0.23000.#VietnamPlansFirstCryptoLicensesIn2026 #XRPExchangeReservesHitSevenYearLow
Based on the daily chart for $龙虾
USDT Perp (Lobster / Longxia):
Key Technical Indicators & Data
* Current Price: 0.23985 USDT (+7.35%)
* Moving Averages (MAs):
* MA(7): 0.212644
* MA(25): 0.112903
* MA(99): 0.041209
* Observation: Price is in an aggressive upward parabolic trend, maintaining structural support above the steep MA(7) dynamic trendline.
* Supertrend Indicator (10,3):
* Supertrend Level: 0.130674 (Green)
* Observation: Supertrend is green and rising sharply, signaling strong long-term momentum.
* Support & Resistance Levels:
* Immediate Support: ~0.21264 – 0.21317 (24h Low and MA7 dynamic support zone).
* Key Support: ~0.18214 (Mid-candle structural support).
* Major Floor Support: ~0.11290 (MA25 baseline).
* Immediate Resistance: ~0.26666 (24h High).
* Major Resistance: 0.28736 (All-time high peak).
Chart Analysis
* Parabolic Momentum: The asset has surged multi-fold from its base low near 0.01757, making higher highs and higher lows in a rapid vertical trend.
* MA(7) Dynamic Support: Following a peak at 0.28736, price pulled back to retest short-term dynamic support at the 0.21264 (MA7) line, where buyers stepped in to print a green recovery candle.
* Volume Profile: Trading volume remains robust (254.94M 龙虾 / 59.50M USDT 24h volume), indicating continued trader engagement, though volume has slightly normalized compared to the initial breakout surge.
Potential Trade Setups
Option A: Dynamic Support Pullback (Long Entry)
* Entry Range: 0.21300 – 0.22500 (Near MA7 dynamic support and 24h Low).
* Target 1: 0.26600 (24h High retest)
* Target 2: 0.28700 (Re-testing ATH peak)
* Stop-Loss: Below 0.19800 (Below MA7 and recent daily candle bodies).
Option B: ATH Breakout Continuation
* Trigger: Daily candle close above 0.26700 (Clearing 24h High resistance).
* Target 1: 0.28700
* Target 2: 0.32000
* Stop-Loss: Below 0.23000.#VietnamPlansFirstCryptoLicensesIn2026 #XRPExchangeReservesHitSevenYearLow
USDT Perp (Lobster / Longxia):
Key Technical Indicators & Data
* Current Price: 0.23985 USDT (+7.35%)
* Moving Averages (MAs):
* MA(7): 0.212644
* MA(25): 0.112903
* MA(99): 0.041209
* Observation: Price is in an aggressive upward parabolic trend, maintaining structural support above the steep MA(7) dynamic trendline.
* Supertrend Indicator (10,3):
* Supertrend Level: 0.130674 (Green)
* Observation: Supertrend is green and rising sharply, signaling strong long-term momentum.
* Support & Resistance Levels:
* Immediate Support: ~0.21264 – 0.21317 (24h Low and MA7 dynamic support zone).
* Key Support: ~0.18214 (Mid-candle structural support).
* Major Floor Support: ~0.11290 (MA25 baseline).
* Immediate Resistance: ~0.26666 (24h High).
* Major Resistance: 0.28736 (All-time high peak).
Chart Analysis
* Parabolic Momentum: The asset has surged multi-fold from its base low near 0.01757, making higher highs and higher lows in a rapid vertical trend.
* MA(7) Dynamic Support: Following a peak at 0.28736, price pulled back to retest short-term dynamic support at the 0.21264 (MA7) line, where buyers stepped in to print a green recovery candle.
* Volume Profile: Trading volume remains robust (254.94M 龙虾 / 59.50M USDT 24h volume), indicating continued trader engagement, though volume has slightly normalized compared to the initial breakout surge.
Potential Trade Setups
Option A: Dynamic Support Pullback (Long Entry)
* Entry Range: 0.21300 – 0.22500 (Near MA7 dynamic support and 24h Low).
* Target 1: 0.26600 (24h High retest)
* Target 2: 0.28700 (Re-testing ATH peak)
* Stop-Loss: Below 0.19800 (Below MA7 and recent daily candle bodies).
Option B: ATH Breakout Continuation
* Trigger: Daily candle close above 0.26700 (Clearing 24h High resistance).
* Target 1: 0.28700
* Target 2: 0.32000
* Stop-Loss: Below 0.23000.#VietnamPlansFirstCryptoLicensesIn2026 #XRPExchangeReservesHitSevenYearLow
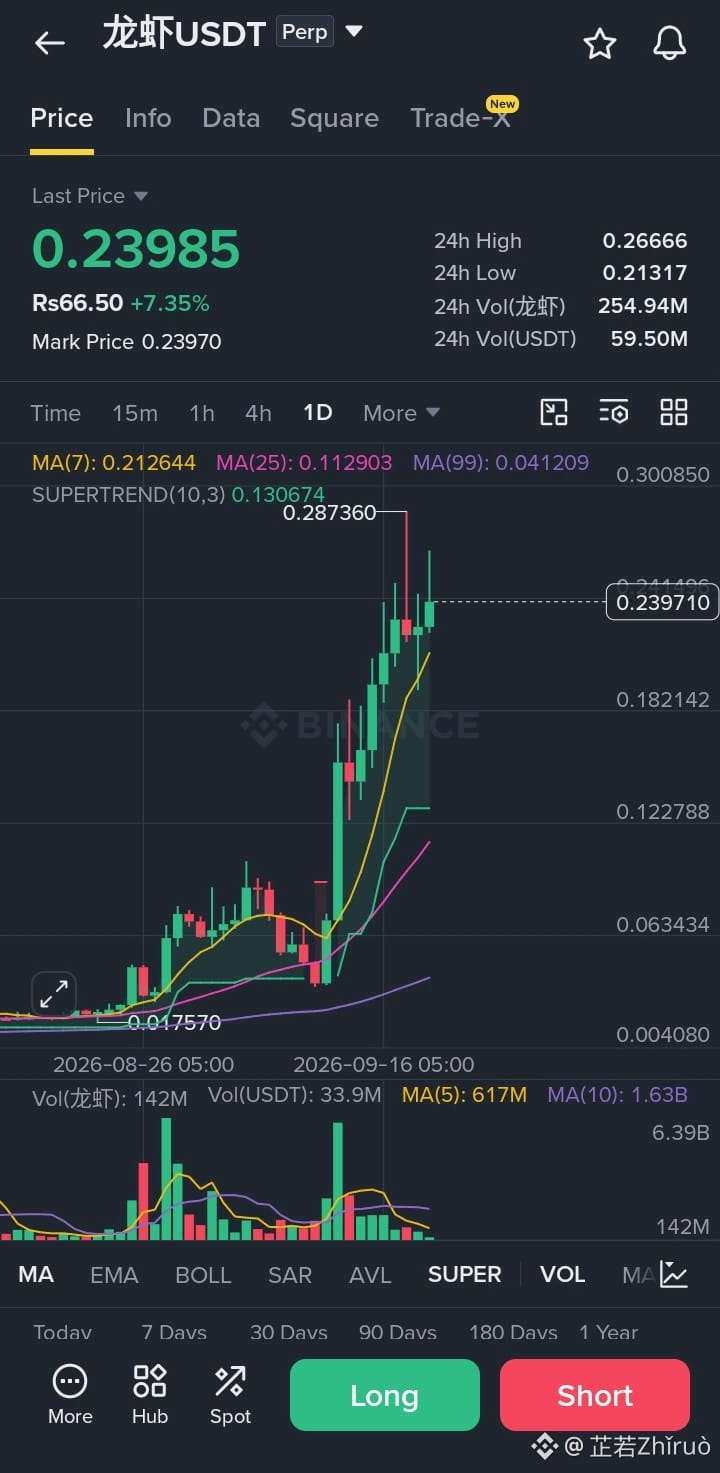
13
Inicia sesión para explorar más contenidos
Únete a usuarios globales de criptomonedas en Binance Square
⚡️ Obtén información útil y actualizada sobre criptos.
💬 Avalado por el mayor exchange de criptomonedas en el mundo.
👍 Descubre perspectivas reales de creadores verificados.
Email/número de teléfono
Temas populares
SaylorHintsStrategyBitcoinBuy
2.2M vistas
11,470 están debatiendo
#SaylorHintsStrategyBitcoinBuy
Michael Saylor vuelve a enviar una señal positiva sobre la estrategia Bitcoin.
Sin embargo, los datos más recientes muestran que la Strategy aún no ha comprado Bitcoin en las últimas semanas. Al 13 de septiembre de 2026, la empresa todavía mantiene 845.050 BTC y aproximadamente US$6,4 mil millones en activos basados en USD.
En lugar de comprar BTC, Strategy asignó alrededor de US$139 millones para recomprar acciones preferentes de STRC.
¿Qué significa esto para el mercado?
🔹 Strategy mantiene su confianza a largo plazo en Bitcoin
🔹 Las reservas en USD brindan margen para la próxima compra de BTC
🔹 Las nuevas compras pueden ser un catalizador alcista para el sentimiento institucional
🔹 Pero una pista no es lo mismo que una compra ya confirmada
Por ahora, el mercado debe diferenciar entre rumores de acumulación y documentos oficiales.
Espera la confirmación; no compres solo por el titular.
#Bitcoin #BTC #Strategy #MichaelSaylor
$BTC
XaliCoin
·1 me gusta
·120 vistas
BOJRaisesRatesTo31YearHigh
182,926 vistas
2,724 están debatiendo
BuffettStepsDownAsBerkshireChairman
88,672 vistas
1,407 están debatiendo