
Key Takeaways
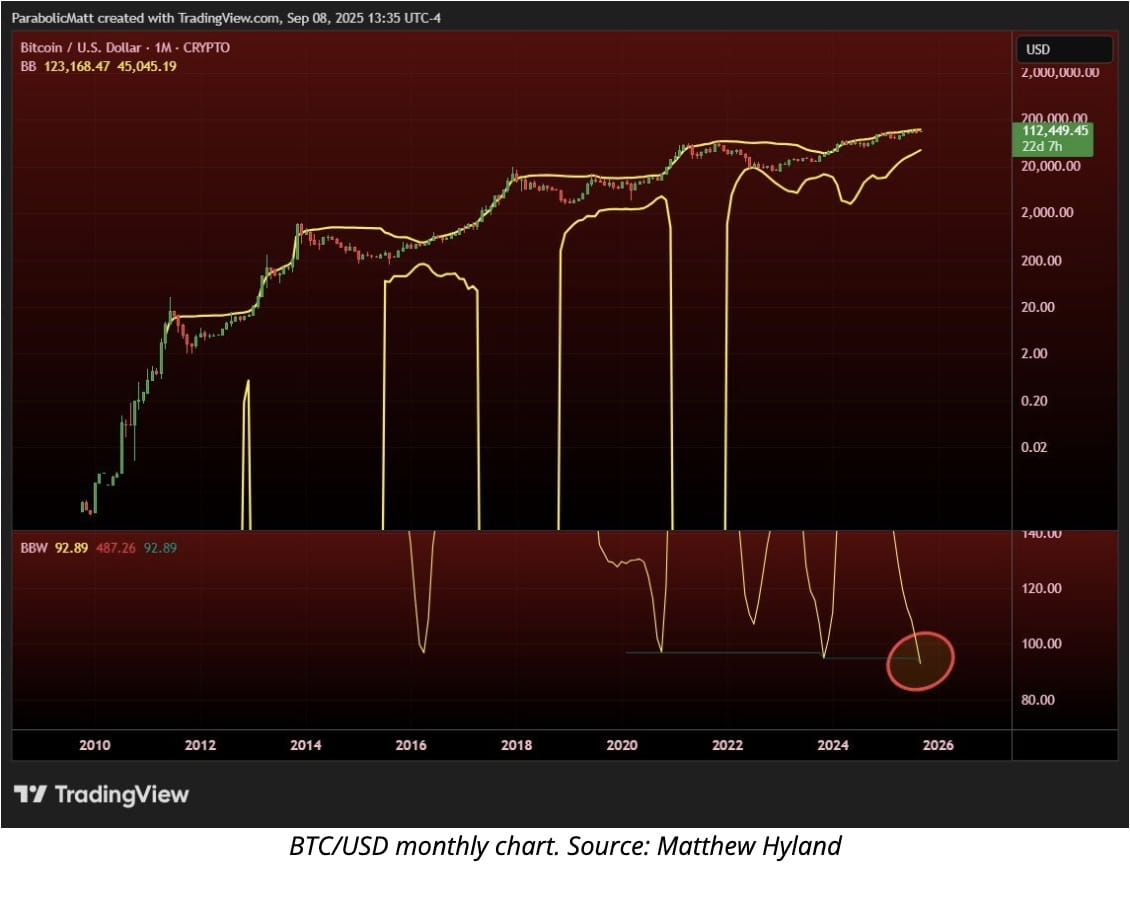
Bitcoin’s Bollinger Bands are at their tightest since 2009, signaling major volatility ahead.
Past squeezes in 2012, 2016, and 2020 all preceded explosive upside moves.
A confirmed cup-and-handle breakout targets $300K, though historical data shows only 61% of patterns reach full targets.
Bollinger Bands Enter Historic Contraction
Bitcoin (BTC $113,927) is flashing one of its strongest technical signals in history. On the monthly chart, Bollinger Bands have tightened to their “most extreme level” since inception, according to trader Matthew Hyland.
“This setup has previously led to massive volatility to the upside,” analyst Crypto Caesar said, noting that Q4 2025 could deliver “a spicy move” for Bitcoin.
Historical parallels strengthen the case: contractions in 2012, 2016, and 2020 each preceded explosive rallies, pushing BTC into new all-time highs. Investor Giannis Andreou argued that the current squeeze is even tighter, potentially setting up the largest move BTC has ever recorded.
Cup-and-Handle Pattern Points to $300K
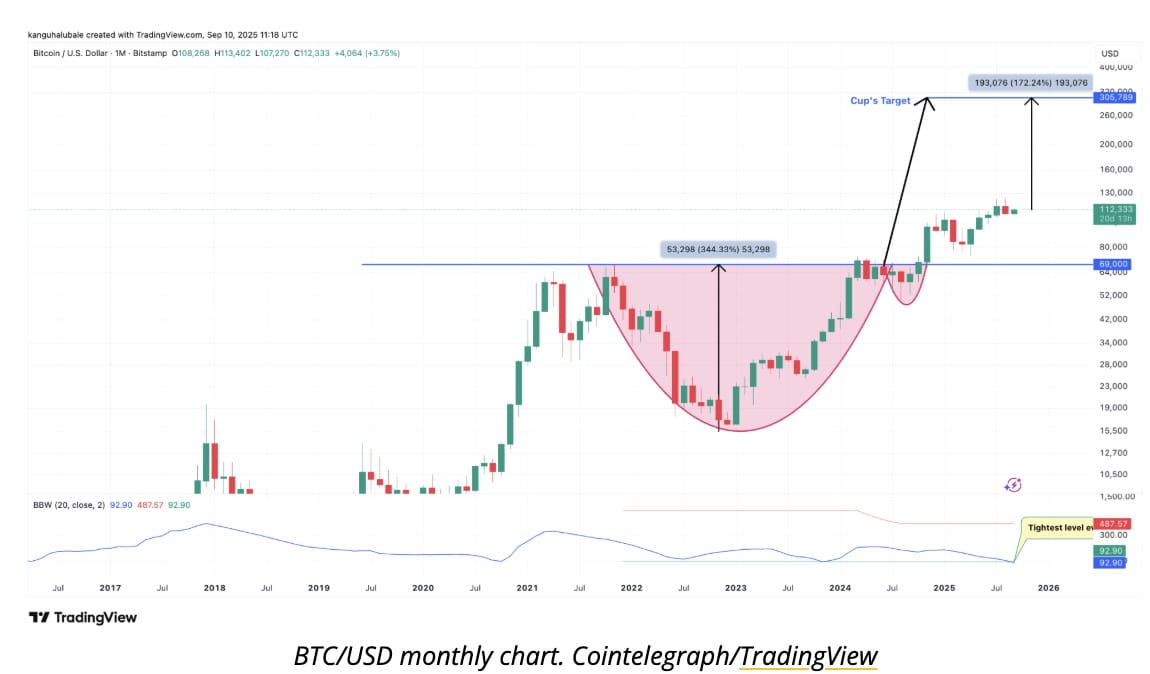
Beyond volatility signals, chart structures are aligning with bullish outcomes. Bitcoin’s cup-and-handle breakout, validated when BTC crossed $69K in Nov. 2024, carries a measured move target of $305,000 — representing a 170% gain from current levels.
Neckline breakout: $69K confirmed in late 2024.
Target zone: $300K–$305K by 2026 if the full pattern plays out.
Historical reliability: Only 61% of cup-and-handle setups reach their maximum projection, per research by analyst Thomas Bulkowski.
Macro and Institutional Tailwinds Support the Setup
Bitcoin’s bullish technical outlook is reinforced by broader factors:
Federal Reserve pivot: Rate cuts expected in September could reignite risk asset demand.
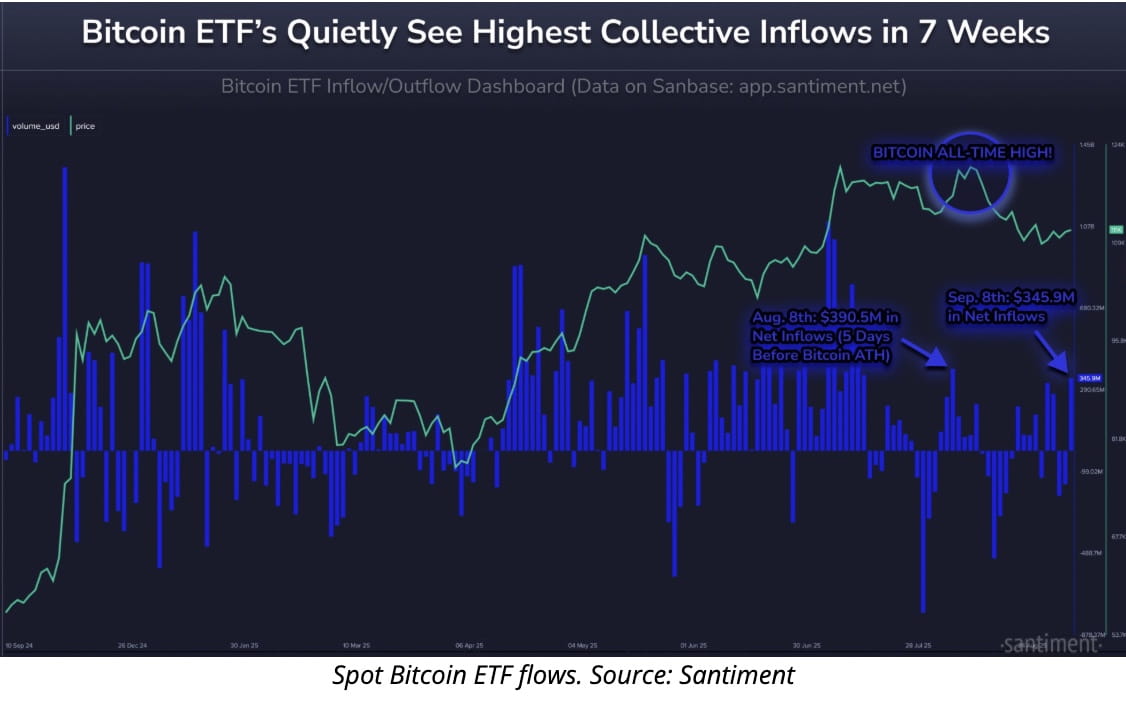
Institutional flows: Spot Bitcoin ETFs turned net positive inflows this week after months of outflows.
Treasury demand: Corporate treasuries continue to accumulate BTC, echoing dynamics from the 2020–2021 cycle.
On-chain resilience: Despite corrections, long-term holder conviction remains strong.
Santiment noted that “money is moving back into Bitcoin ETFs at a rapid rate as retailers impatiently drop out of crypto” — a setup that historically preceded major rallies.
Short-Term Path Still Volatile
While the long-term charts highlight a $300K roadmap, short-term dynamics remain fragile. Analysts warn that BTC may still revisit $104K — aligning with Glassnode’s “consolidation corridor” — before the next leg higher.
If volatility expands as the Bollinger Bands suggest, the breakout direction could define the 2025–2026 cycle trajectory.
