



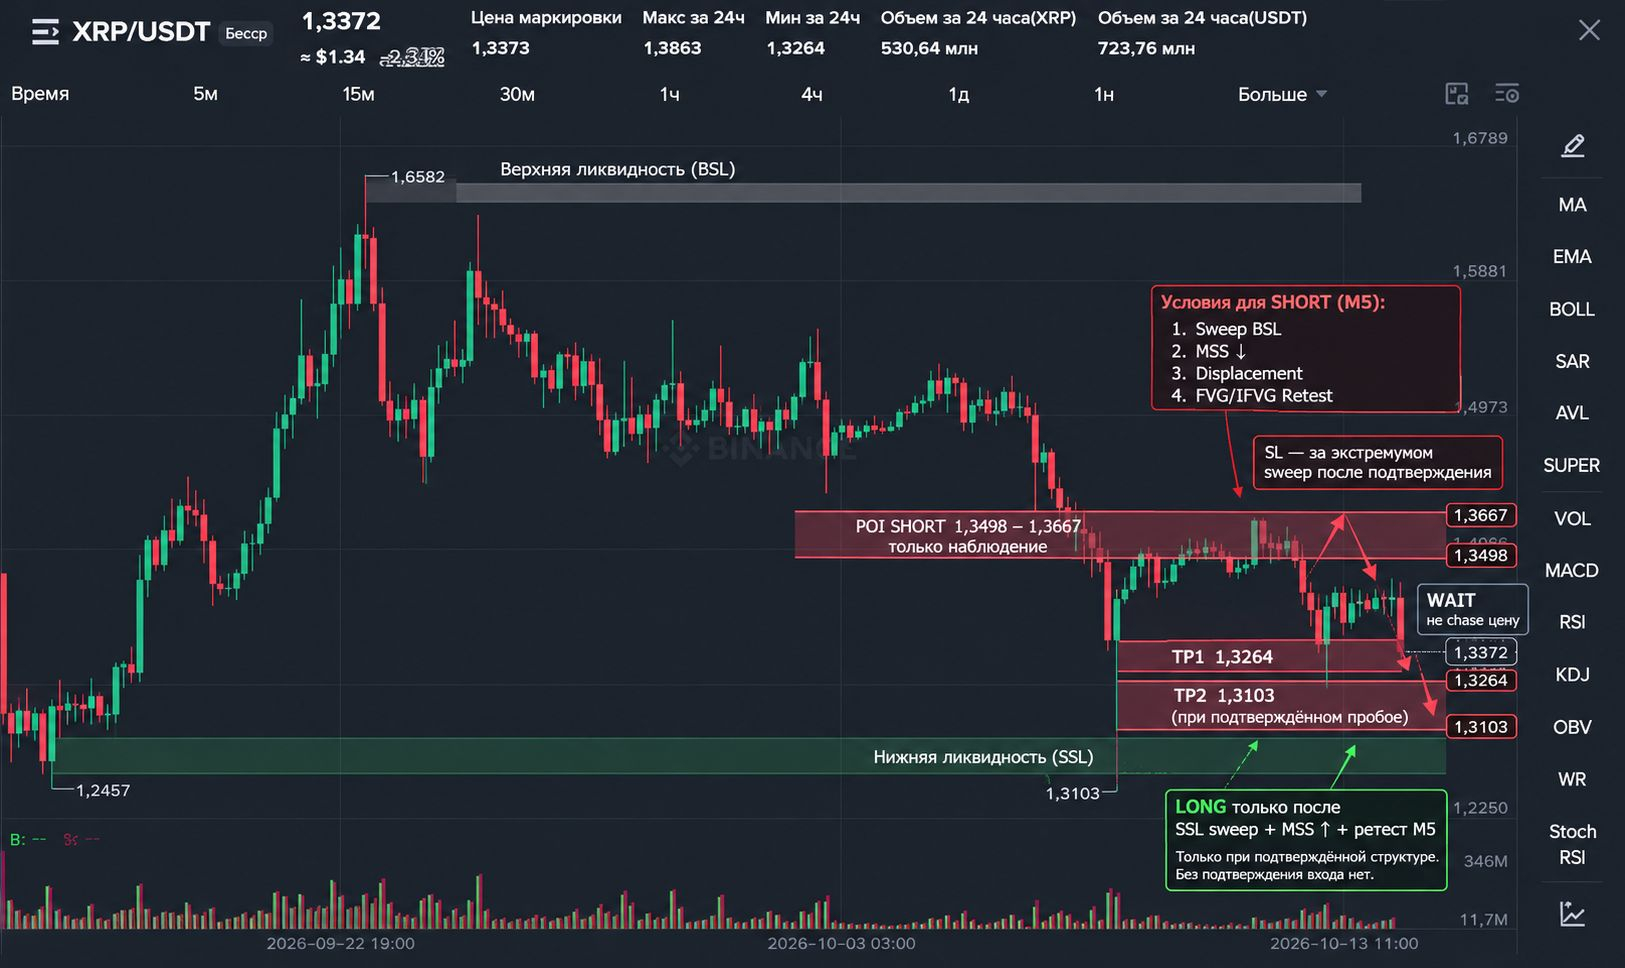
 #Xrp🔥🔥 🚨 $XRP/USDT — The price has lost its local support structure. The next target is $1.3103, but entering a SHORT after the move may already be too late.
With XRP, it’s important not to try to guess the bottom or chase the price right now. The market showed a strong bearish reaction from the upper liquidity, broke through local support levels, and reached the $1.3264 area. The key question now is: will sellers continue pushing the price toward the next SSL, or will buyers use the liquidity sweep to drive a recovery?
Let us analyze the structure from the higher timeframe to the lower one, identify key levels, and define the conditions for a well-grounded trading scenario.
1. D1 — HIGHER-TIMEFRAME CONTEXT
On the daily chart, XRP moved from a low around $0.9844 to a high of $1.7010, after which it entered a corrective move.
This is important context: the current decline is unfolding after a significant upward impulse. Therefore, we cannot automatically assume that the entire previous rally is over and a long-term bearish trend has begun.
However, the structure looks weaker for short-term trading: the price is around $1.337 and has pulled back significantly from recent highs.
D1 takeaway: the market is correcting after a strong rally. To determine the next trade, we need to consider the current bearish structure on lower timeframes while keeping the possibility of a recovery in mind.
2. H4 — BUYERS ARE LOSING THE INITIATIVE
On the four-hour chart, after rising toward the $1.65 area, the price failed to sustain its upward momentum.
The price action sequence shows:
weakness after a strong upward impulse;
formation of lower local highs;
a decline to the $1.33 area;
no confirmed recovery of the previous structure on the chart provided.
Important point: the decline on H4 supports the bearish scenario, but by itself does not prove a reversal of the entire higher-timeframe trend.
For sellers, the priority is to look for continued Delivery to the downside. For buyers, it is to wait for a sweep of lower liquidity and confirmation of a structural reversal.
3. H1 — WHERE DID THE MARKET SHOW WEAKNESS?
The hourly chart shows a high at $1.3863. After it formed, the price dropped sharply, broke through intermediate levels, and reached $1.3264.
This forms the main working hypothesis:
A — $1.3863 → B — $1.3264 → potentially $1.3103.
What we can see:
the price reacted downward after making a new local high;
bearish momentum broke through the $1.3567–1.3667 area;
sellers to have pushed the price down to the local low of $1.3264;
Further movement requires confirmation: a retest of the low does not guarantee a breakout.
The $1.3264 area now has a dual significance. It is both the local low that has been reached and a potential source of liquidity if the price declines again.
If the price holds below this level and shows continued momentum, the next target will be the $1.3103 area.
But if the market sweeps the low and quickly returns above it, we need to check whether a trap for sellers is forming.
4. M15 — WHY SHOULD YOU NOT SELL AT THE CURRENT PRICE?
On M15, we can see the decline accelerate from the $1.37–1.38 area toward $1.3264. After the impulse, the price began a local recovery.
This is not a confirmed bullish reversal. So far, we are seeing only a reaction after a sharp decline.
However, selling directly around $1.337 is risky for two reasons.
First: a significant part of the downward move has already taken place.
Second: the price is in the lower half of the working range of $1.3103–1.3863. From here, the market could continue lower or return to the broken levels.
It is therefore more sensible to wait for the price to return to a potential supply area and assess the sellers' reaction than to open a trade out of fear of missing the move.
5. M5 — THE KEY TIMEFRAME FOR ENTRY CONFIRMATION
On the five-minute chart, a sharp downward impulse is visible, accompanied by increased activity, after which the price bounced from a low around $1.3264.
But a single bounce is not enough to declare a confirmed reversal. The snapshot provided does not give us grounds to claim that a complete entry sequence has already formed.
For a SHORT, we wait for:
Price returns to the POI.
Sweep of local BSL.
Bearish MSS.
Clear Displacement to the downside.
Formation of an FVG/IFVG and a retest of this zone.
Only after the entire sequence has played out should an entry be considered.
For a LONG, the requirements are the reverse: first a sweep of SSL, then a bullish MSS, upward Displacement, and a retest of the FVG/IFVG.
POI is an area to watch, not a ready-made signal.
Without confirmation on M5, there is no trade entry.
6. LIQUIDITY — WHAT HAS THE MARKET ALREADY SWEPT?
Upper liquidity — BSL
The $1.3863 area marks a local high. After making a new high, the price reversed sharply to the downside.
This is consistent with the hypothesis of a liquidity sweep above the high followed by bearish Delivery. But without a detailed candle analysis, we cannot claim that this liquidity grab alone has definitively confirmed a reversal.
Lower liquidity — SSL
A local low has formed at $1.3264, where the downward impulse reached.
Some liquidity below the previous lows may have been swept. Now the market needs to show what happens next:
retests $1.3264 and continues lower;
or sweeps the low, quickly recovers, and forms conditions for a LONG.
Next potential target
If sellers remain in control, the main reference point is $1.3103, the previous low marked on H1.
This is the scenario's target, not a promise of further declines.

