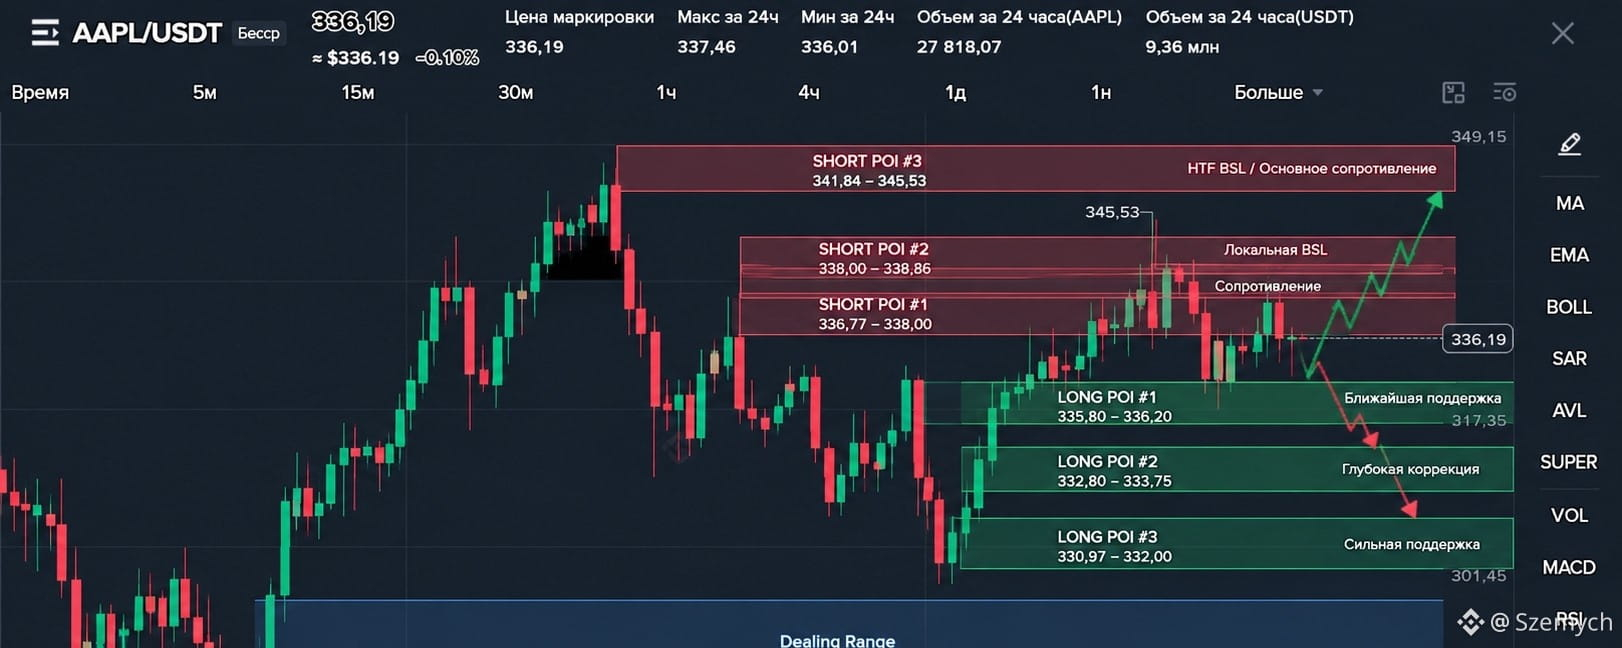

#AAPLUSDT $AAPL/USDT — Intraday Trading Plan
October 10, 2026 · Price on the charts: 336.19 USDT
Key takeaway: The D1/H4 uptrend context remains intact after the rise from 273.27 to 345.53, but momentum has weakened on the lower timeframes. Price was rejected from the 341.84 area and returned to 336.19. Local weakness is visible on M15/M5, so an immediate LONG is not confirmed.
Priority: LONG after a sweep of lower liquidity and buyer confirmation. SHORT on a resistance retest and confirmed bearish reversal. POI is an area to monitor, not an entry signal.
1. Narrative — price delivery logic
D1: the broad range shown in the screenshot is 273.27–345.53. After a strong recovery, price is near the upper part of the range.
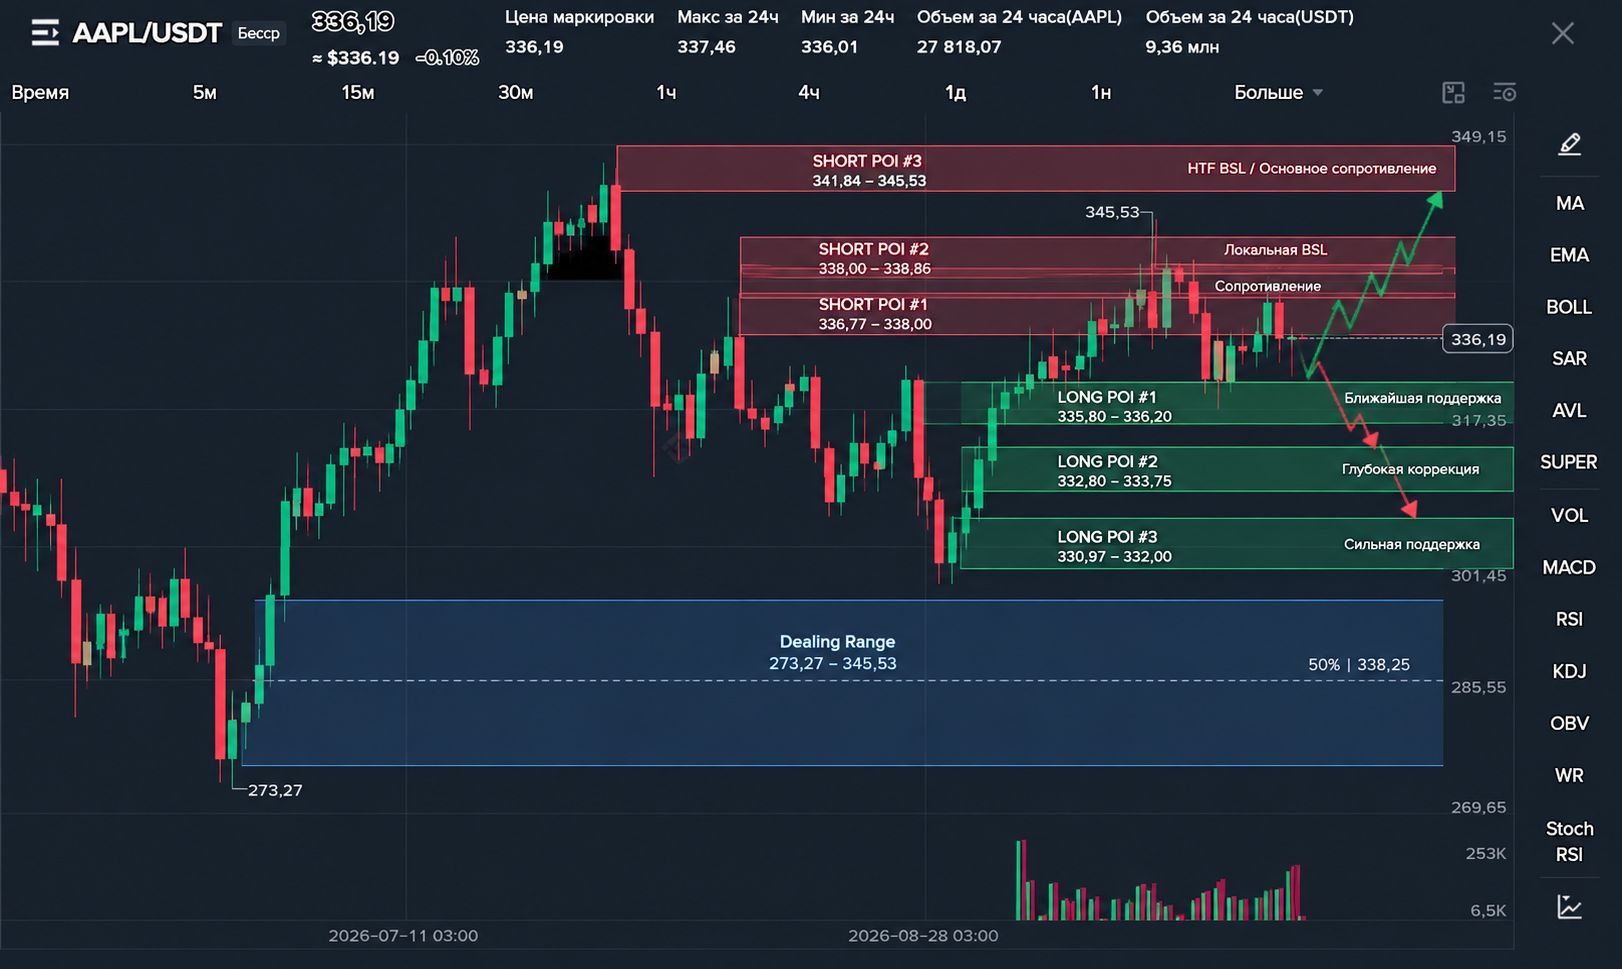
H4: the recovery structure remains significant, but the 345.53 high has not yet been broken. The 341.84–345.53 area acts as resistance.
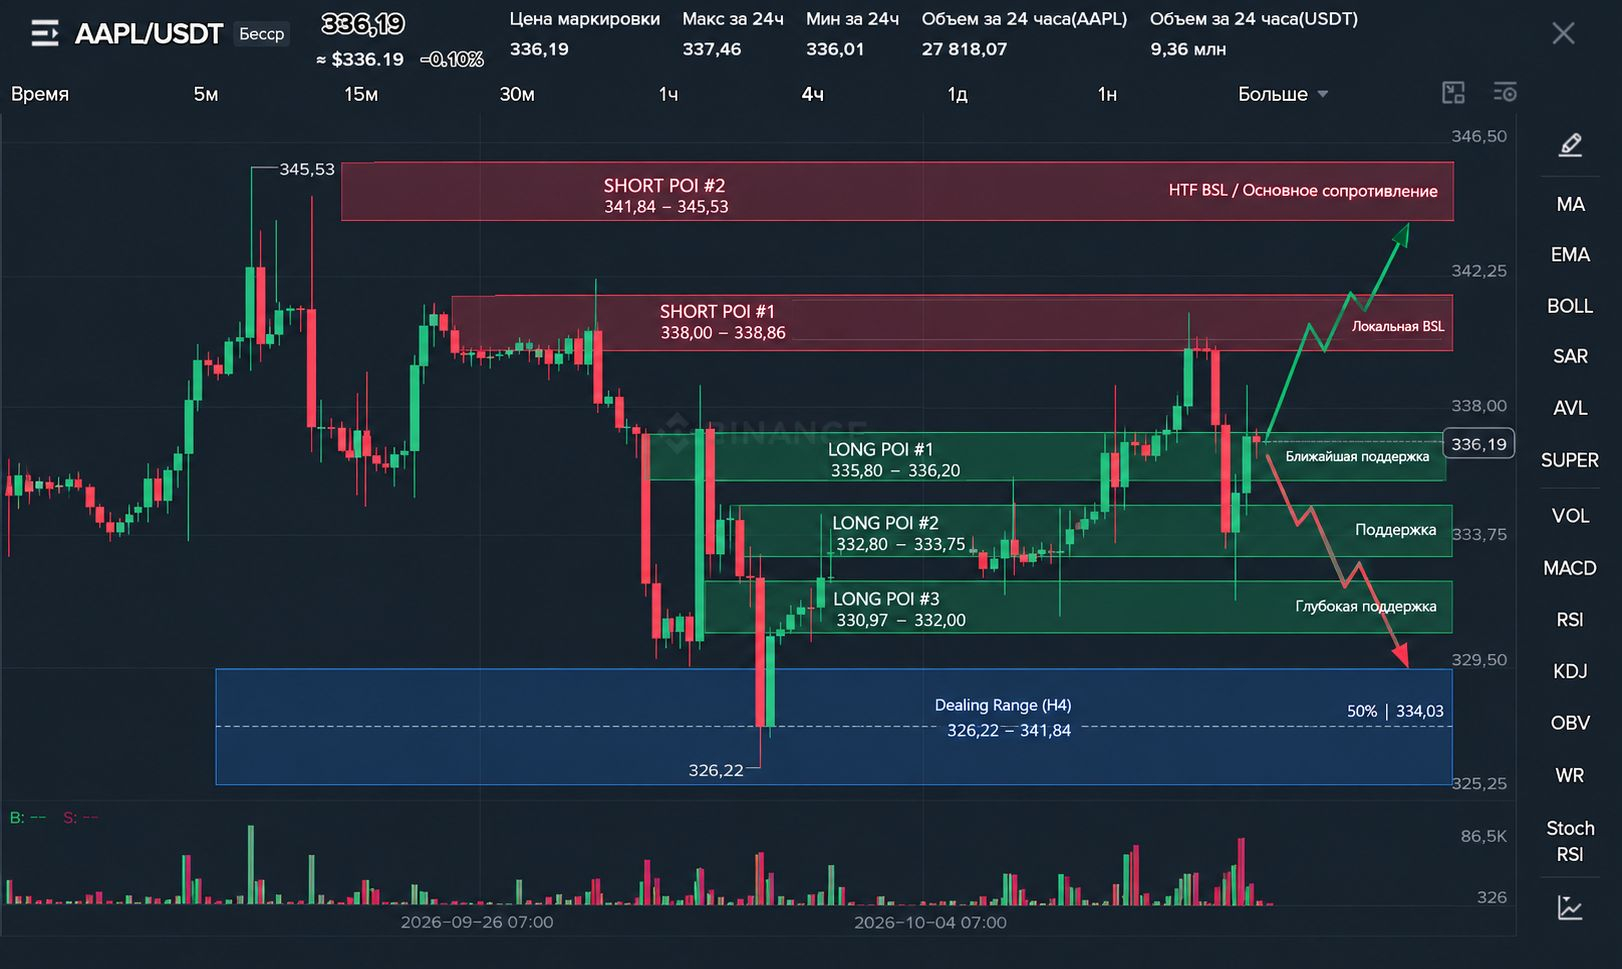
H1: price declined from 341.84, reacted from the 331–333 area, and recovered to 336–337. Further upside has not yet been confirmed.
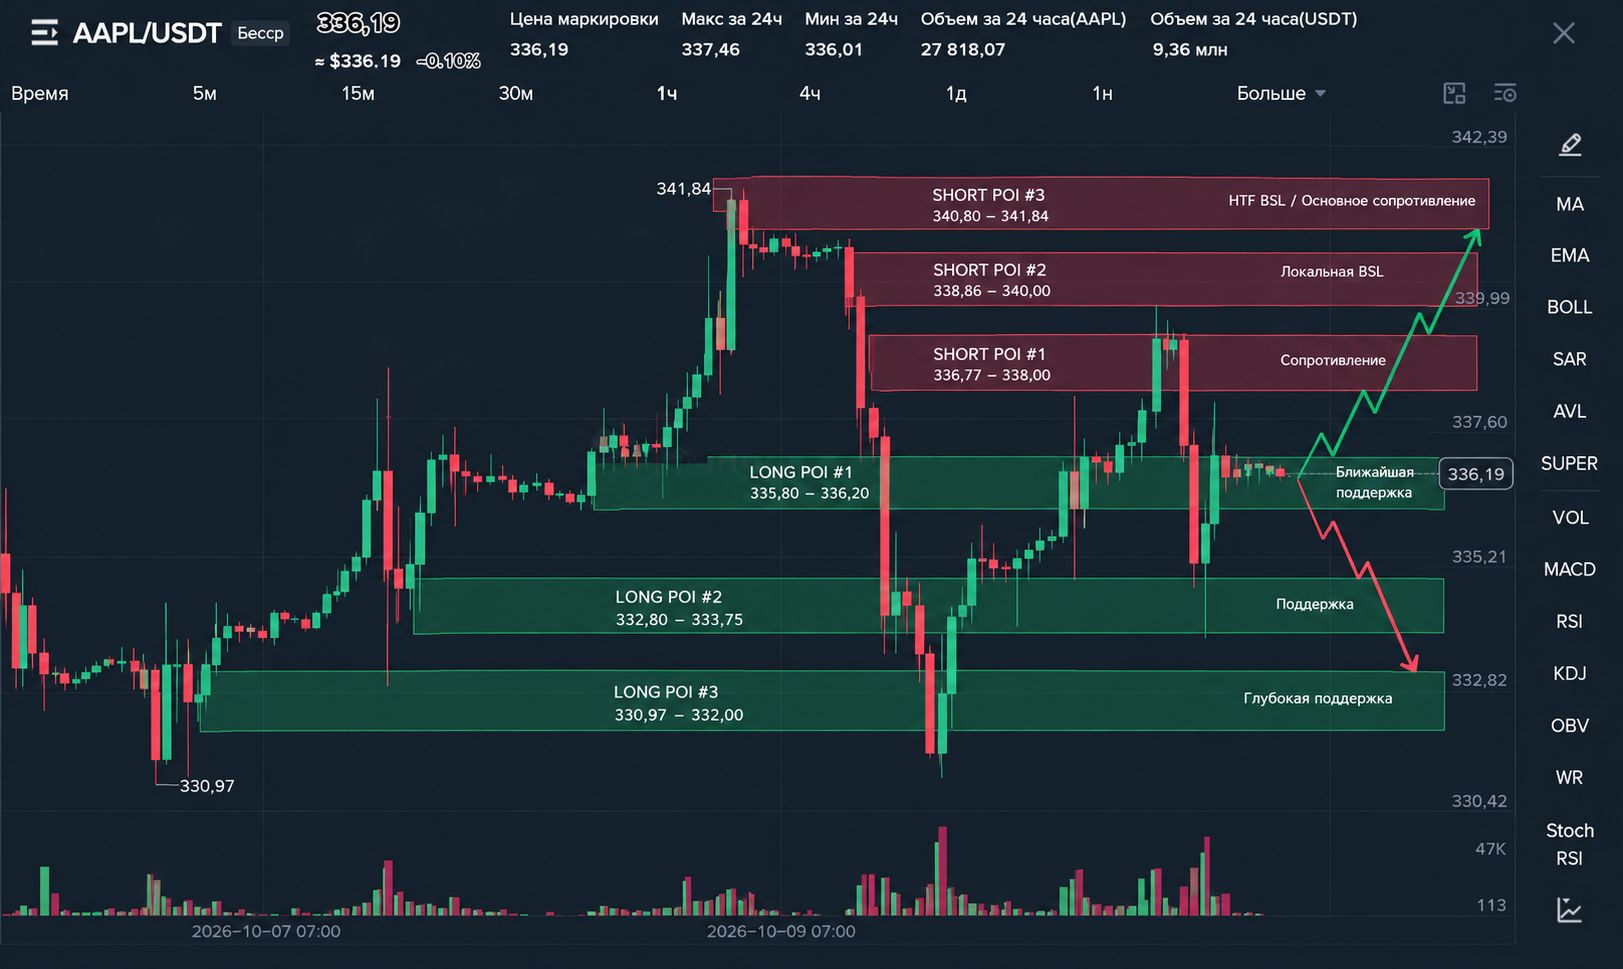
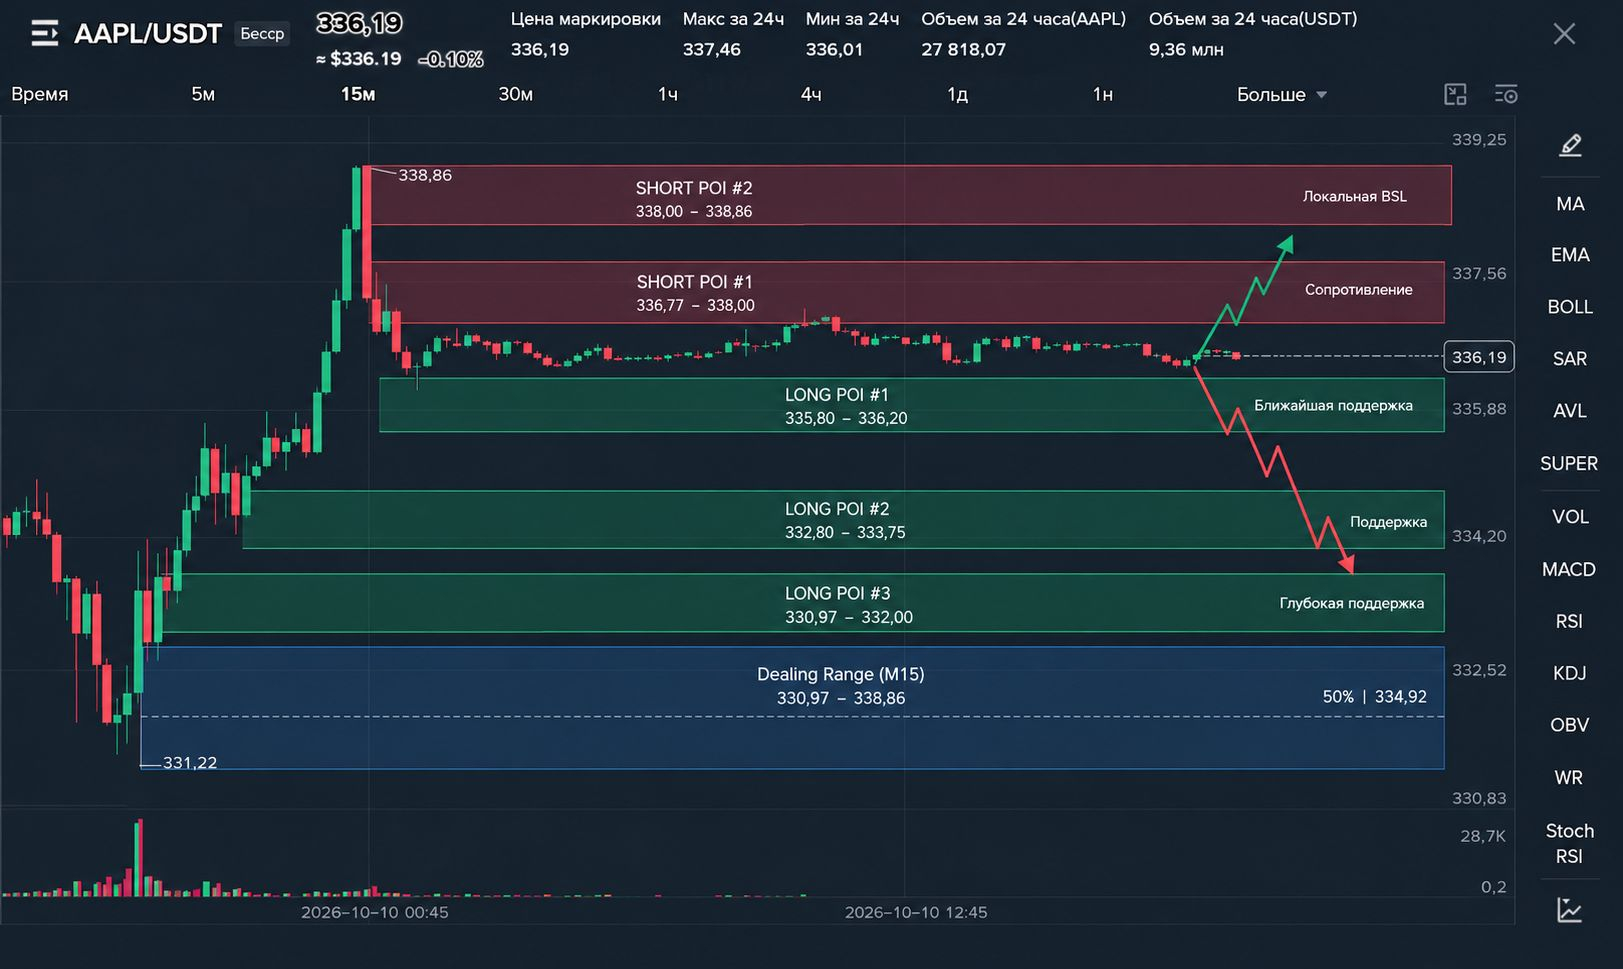
M15: after an upward impulse to 338.86, price entered a narrow consolidation and gradually weakened.
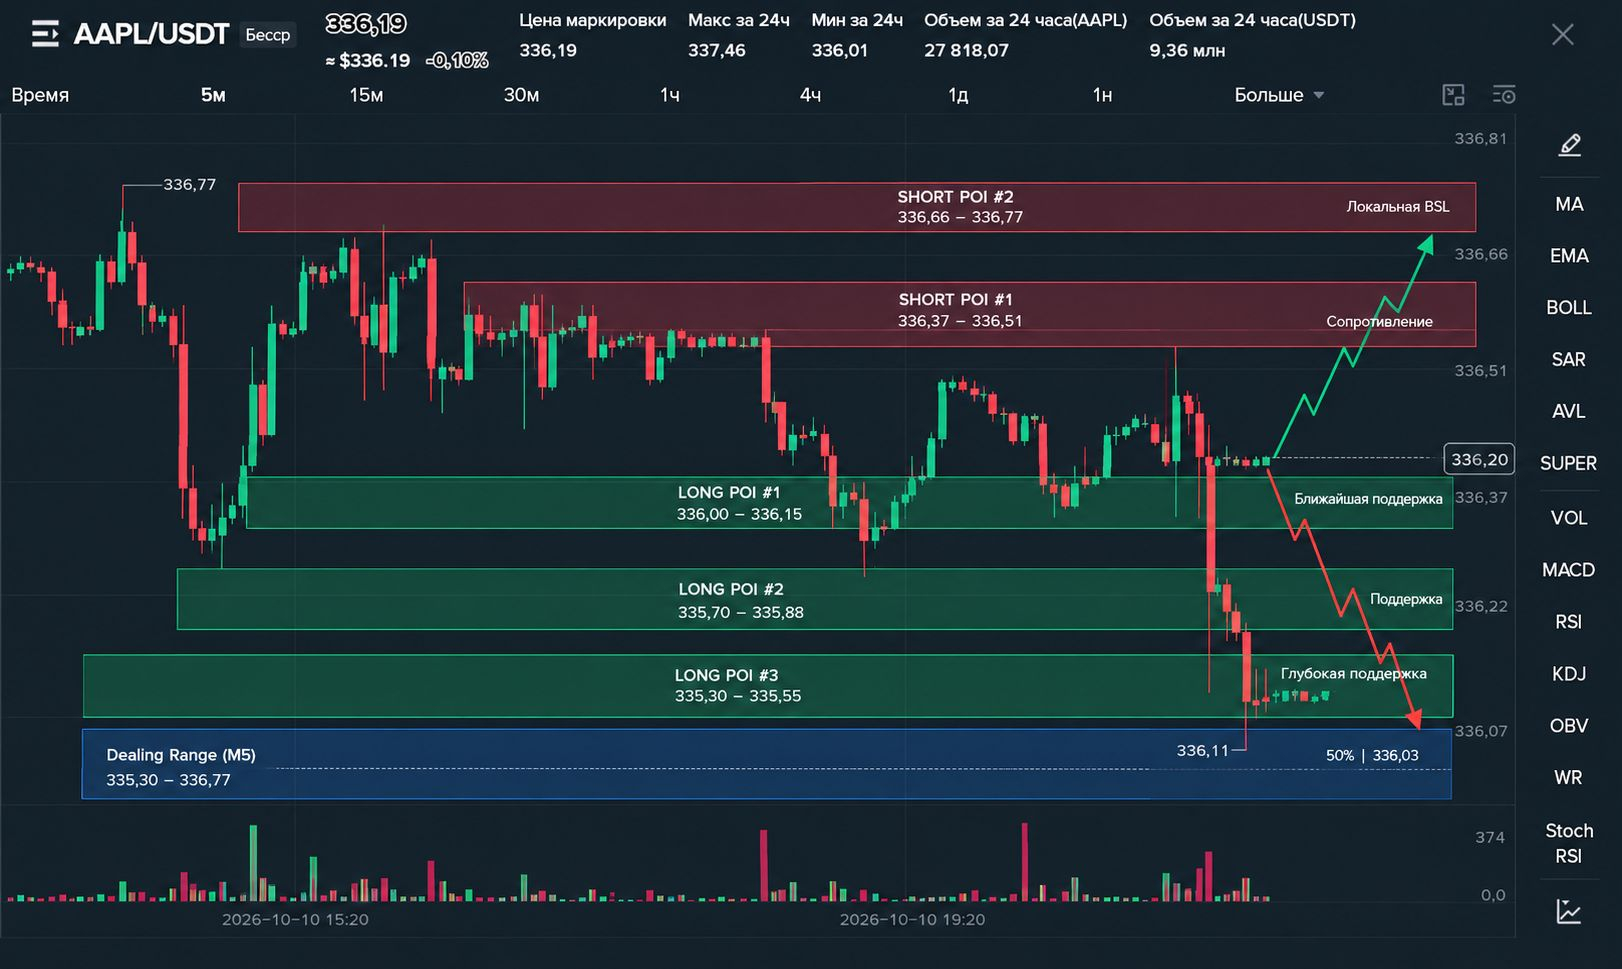
M5: liquidity below around 336.11 has already been tested. LONG requires bullish MSS and displacement; SHORT requires confirmed continuation lower.
What the market took: liquidity above the local highs of 338.86 and 341.84 was tested; price failed to hold at the upper levels. On the higher timeframe, the significant high is 345.53. Current Delivery: locally lower from 338.86 to 336.11, after which price moved into consolidation.
Next likely Delivery: holding 335.80–336.10 and returning above 336.77 could open the way to 338.00–338.86. Losing 336.11 and holding below it increases the likelihood of a move to 335.20, then 333.75–332.80.
Invalidation Narrative: sustained acceptance above 338.86 would weaken the local bearish scenario. Losing 330.97 would damage the H1 recovery structure.
Bias, Key Levels and Dealing Range
Parameter Levels / assessment
HTF Bias 🟢 Recovery, but near resistance
Intraday Bias 🔴 Neutral-to-bearish until LONG is confirmed
Key Level A 330.97 — H1 local low
Key Level B 341.84–345.53 — resistance
Dealing Range 330.97–345.53
Midpoint (50%) 338.25
Current price 336.19 — Discount of the broad range
Price is below the midpoint of the broad range, but this is not a buy signal on its own.
3. Liquidity — key levels
BSL: 336.77; 338.00–338.86; 341.84; 345.53.
SSL: 336.11; 335.80; 333.75–332.80; 330.97.
Equal Highs: local highs around 336.60–336.77 and 338.00–338.86.
Equal Lows: 336.10–336.20 area; below — 333.75 and 330.97.
Inducement: local lows before upward impulses. Sweeping them may provide a setup, but only after structure confirmation.
POI Zone Purpose
🟢 LONG #1 335.80–336.20 Nearest support
🟢 LONG #2 332.80–333.75 Deep correction
🟢 LONG #3 330.97–332.00 Lower recovery zone
🔴 SHORT #1 336.77–338.00 Local resistance
🔴 SHORT #2 338.00–338.86 Upper supply zone
🔴 SHORT #3 341.84–345.53 Higher-timeframe BSL and resistance
SNR: 335.80–336.20 — potential support; 338.00–338.86 — resistance.
RB/MB: look for the last opposing block before confirmed displacement. Exact boundaries require checking the candles.
FVG/IFVG: identify after an impulse on M15/M5 and wait for a retest. A touch of the zone does not confirm an entry.
5. FTA / TA — delivery targets
Scenario FTA TA
LONG 336.77 → 338.00 338.86 → 341.84
SHORT 335.80 → 335.20 333.75 → 332.80 → 330.97
FTA — first target and possible reaction. TA — subsequent targets if momentum holds.
Trigger: M5 SSL Sweep → Bullish MSS → Displacement → FVG/IFVG Retest.
Entry: only after a confirmed retest. If the sequence does not form — WAIT.
SL / Invalidation: below the sweep extreme. Holding below 335.20 weakens the first scenario; losing 330.97 breaks the recovery structure.
TP: 336.77 → 338.00 → 338.86 → 341.84.
Expected Delivery: toward local BSL, then higher if a breakout is confirmed.
🔴 ALTERNATIVE SCENARIO — SHORT
POI: 336.77–338.00; next zone — 338.00–338.86.
Reaction: BSL sweep, return below the level, and selling pressure emerging.
Trigger: M5 BSL Sweep → Bearish MSS → Displacement → FVG/IFVG Retest.
Entry: after a confirmed retest. Without the full Trigger — WAIT.
SL / Invalidation: beyond the sweep extreme. Sustained acceptance above 338.86 weakens the local SHORT scenario.
TP: 336.11 → 335.20 → 333.75 → 332.80.
Expected Delivery: toward local SSL and then lower if selling intensifies.
Final Trading Map
BIAS: HTF — recovery; Intraday — local weakness.
POI: LONG 335.80–336.20; deep LONG 332.80–333.75; SHORT 336.77–338.00.
What needs to happen in the POI: the relevant liquidity must be swept and a reaction confirmed.
M5 Trigger: Sweep → MSS → Displacement → FVG/IFVG Retest → Entry.
Invalidation: LONG weakens below 335.20; SHORT weakens if price holds above 338.86.
Expected Delivery: LONG — 338.00 → 338.86 → 341.84; SHORT — 335.20 → 333.75 → 332.80.
Current price 336.19 — WAIT. Do not chase the move or enter in the middle of the range. First confirm structure on M5, then enter.