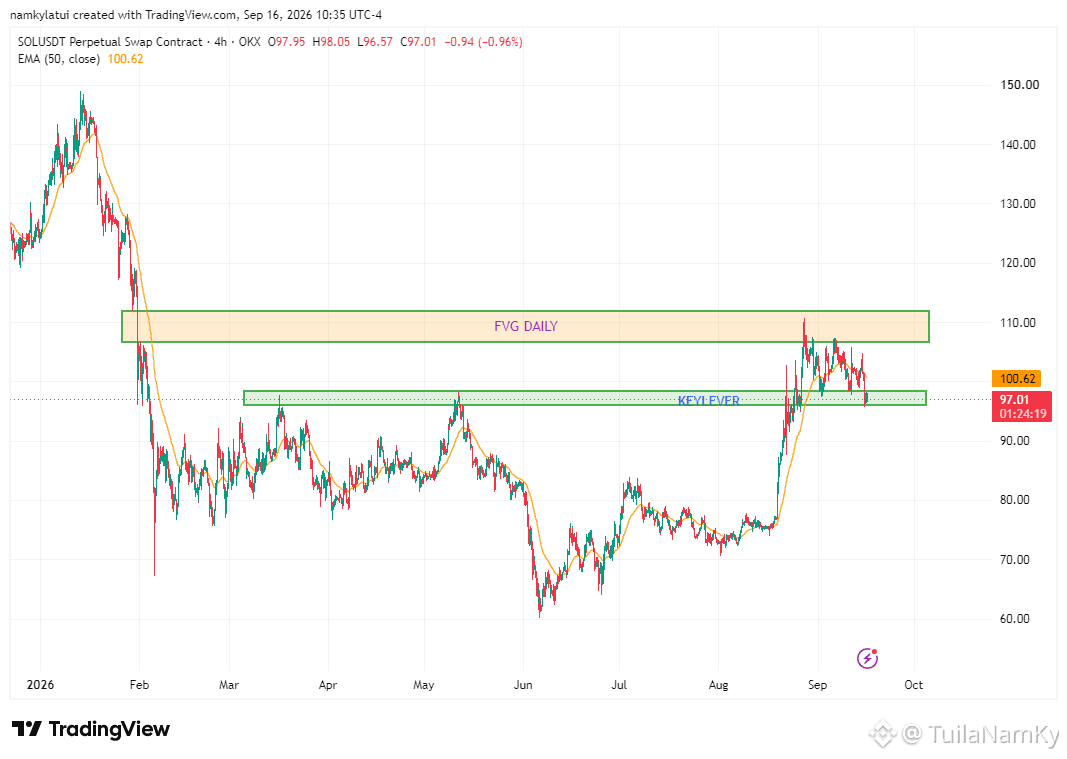
$SOL Multi-Timeframe Analysis — Key Level Retest After Structure Break
SOL/USDT has been in a clear downtrend since early this year, trading below its 50 EMA for months. In late August, price broke that structure decisively — a strong impulsive move pushed SOL above the 50 EMA and into a daily Fair Value Gap (FVG) zone around $105-110.
Price got rejected from the FVG and is now retesting a key level (~$96-98) that previously acted as resistance before the breakout. On the Daily chart, this level lines up closely with the rising 50 EMA (~$92.7), creating a potential confluence zone.
Zooming into H4 and H1, short-term momentum has weakened — price is trading below the 50 EMA on both timeframes, with a clear sequence of lower highs since the $104.9 high on Sep 14. There was also a liquidity sweep down to ~$95 before buyers stepped back in, a classic stop-hunt pattern before a reaction.
Two scenarios to watch:
🔹 Bulls hold the $96-98 zone + reclaim the H1/H4 50 EMA → structure stays bullish, key level flips back to support
🔹 Clean daily close below $96 → likely a false breakout, price could revisit the $85-92 range
Given the mixed signal (bullish daily structure vs. weak intraday momentum), scaling in with DCA across the $96-98 zone is safer than a single entry — let the market confirm direction before adding size.
Not financial advice — always manage your own risk.
#SOL #Solana #CryptoAnalysis
$SOL
SOL/USDT has been in a clear downtrend since early this year, trading below its 50 EMA for months. In late August, price broke that structure decisively — a strong impulsive move pushed SOL above the 50 EMA and into a daily Fair Value Gap (FVG) zone around $105-110.
Price got rejected from the FVG and is now retesting a key level (~$96-98) that previously acted as resistance before the breakout. On the Daily chart, this level lines up closely with the rising 50 EMA (~$92.7), creating a potential confluence zone.
Zooming into H4 and H1, short-term momentum has weakened — price is trading below the 50 EMA on both timeframes, with a clear sequence of lower highs since the $104.9 high on Sep 14. There was also a liquidity sweep down to ~$95 before buyers stepped back in, a classic stop-hunt pattern before a reaction.
Two scenarios to watch:
🔹 Bulls hold the $96-98 zone + reclaim the H1/H4 50 EMA → structure stays bullish, key level flips back to support
🔹 Clean daily close below $96 → likely a false breakout, price could revisit the $85-92 range
Given the mixed signal (bullish daily structure vs. weak intraday momentum), scaling in with DCA across the $96-98 zone is safer than a single entry — let the market confirm direction before adding size.
Not financial advice — always manage your own risk.
#SOL #Solana #CryptoAnalysis
$SOL