
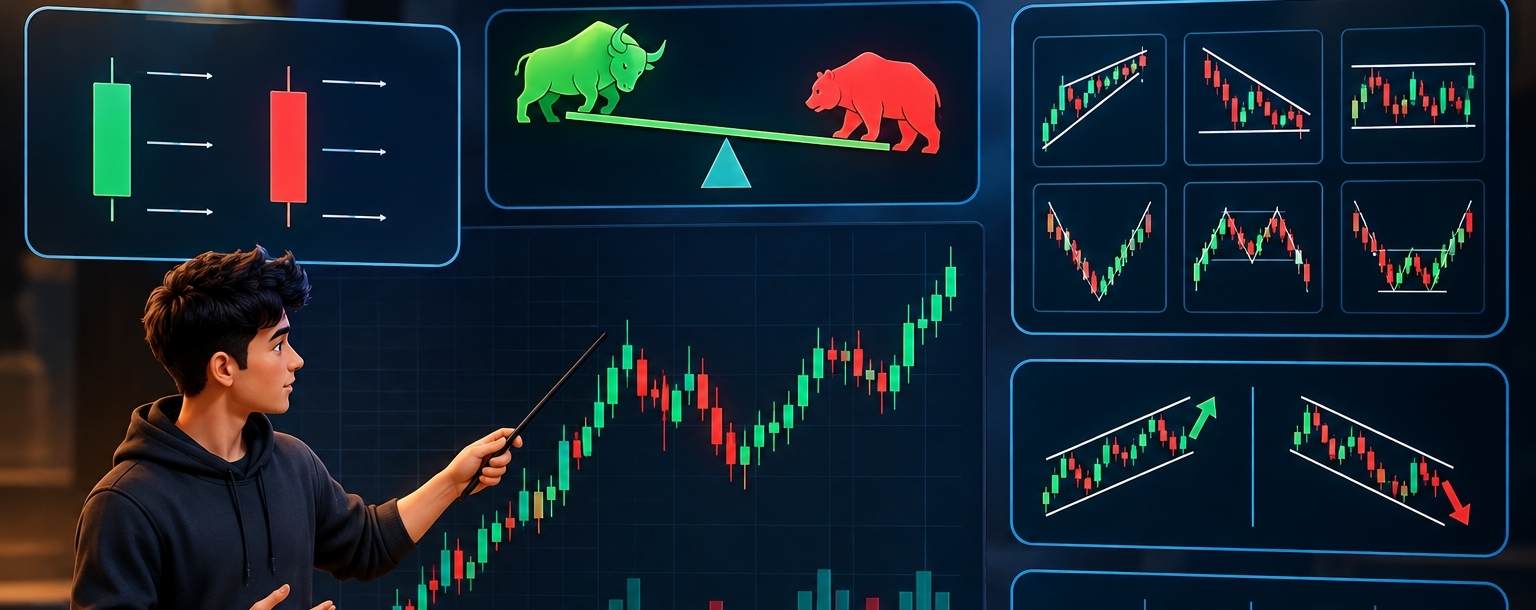

In the Crypto or Share Market, price movement never moves in a completely straight line. Sometimes the price goes up, and sometimes it drops quickly. We can see the entire history of this price movement through a chart.
Especially for Candlestick Chart traders, this is very important. Because within a single candle, you can get information about where the price opened at a specific time, how high it went, how low it went, and where it closed.
And when many candles form together, different patterns appear on the chart. Traders try to understand the probable future direction of price by combining these patterns with Support-Resistance, Trendline, Volume, and various Indicators.
⚠️ Keep in mind that no chart pattern guarantees future price movement. These only help you understand probabilities.
📊 What is a Candlestick Chart Pattern?
Simply put, when certain candles or price movements repeatedly form the same kind of shape, it is called a Candlestick Pattern.
The main thing behind this pattern is the struggle between Buyers and Sellers.
When demand for an asset is high and Buyers are stronger, they become willing to buy even at higher prices. As a result, the price starts moving upward.
On the other hand, when Supply becomes greater and Sellers become more active, selling pressure increases and the price may move downward.
This continuous battle between Buyers and Sellers is what creates different candles and patterns on the chart.
🔥 Why do chart patterns form?
Behind every price movement in the market, human decisions are at work.
If many traders at a certain price level believe the asset’s price is low and can be bought now, buying pressure may build there.
Again, at a certain price level, if many traders think the price has risen too much, they may start taking profit or selling.
It is the result of this collective buying and selling decision that creates certain structures or patterns on the chart.
And the interesting thing is—human psychology in the market often behaves in a similar way.
So some patterns formed in the past may appear again in the future.
That is why traders learn to recognize patterns by studying historical charts, and when a similar setup appears in the live market, they get an idea of the possible price movement.
📈 The two main types of chart patterns
In general, chart patterns can be divided into two major categories:
1️⃣ Continuation Pattern
A continuation pattern usually indicates that the previous trend is likely to continue again.
For example, if the market is already bullish and a continuation pattern forms, then after the pattern breaks out, the price may move upward again.
Similarly, a continuation pattern can also form within a bearish trend.
2️⃣ Reversal Pattern
A reversal pattern is a pattern that, once formed, may indicate the possibility of the previous trend changing.
For instance, if the price has been moving downward for a long time and a bullish reversal pattern forms, selling pressure may decrease and buyers may become stronger.
However, to confirm a reversal, looking at the pattern alone is not enough. You also need to observe the Breakout, Volume, Support-Resistance, and the overall market trend.
⏳ The bigger the pattern, the bigger the movement?
In many cases, the longer it takes for a pattern to form, and the larger the range the price moves within, the larger the post-breakout movement can be in comparison.
However, it should not be taken as a fixed rule.
The market never moves exactly according to the textbook. So instead of blindly trading just because you see a pattern, it is important to wait for confirmation.
👀 What should you look at while a pattern is forming?
In the middle of a pattern forming, it can be difficult to tell whether the market will continue the previous trend or reverse.
So traders should pay attention to a few things:
🔹 Main Trend
🔹 Support & Resistance
🔹 Trendline
🔹 Breakout direction
🔹 Trading Volume
🔹 Candlestick confirmation
🔹 Overall Market Sentiment
In particular, which direction the breakout is happening in and whether volume is increasing during the breakout—these can provide important confirmation.
💡 Final thoughts
Candlestick patterns are a useful tool for understanding the market. But they should not be seen as a magic signal.
A good trader usually does not rely on just one pattern. They consider Price Action + Volume + Support/Resistance + Trend + Risk Management—all together.
Because the most important thing in the market is probability, not certainty.
So read the chart, recognize patterns, but before taking a trade, always manage your own risk. 📊🧠
#Crypto #Trading #Candlestick #TechnicalAnalysis #PriceAction #Binance #BNB #CryptoTrading #TradingEducation #BinanceWriteToEarn