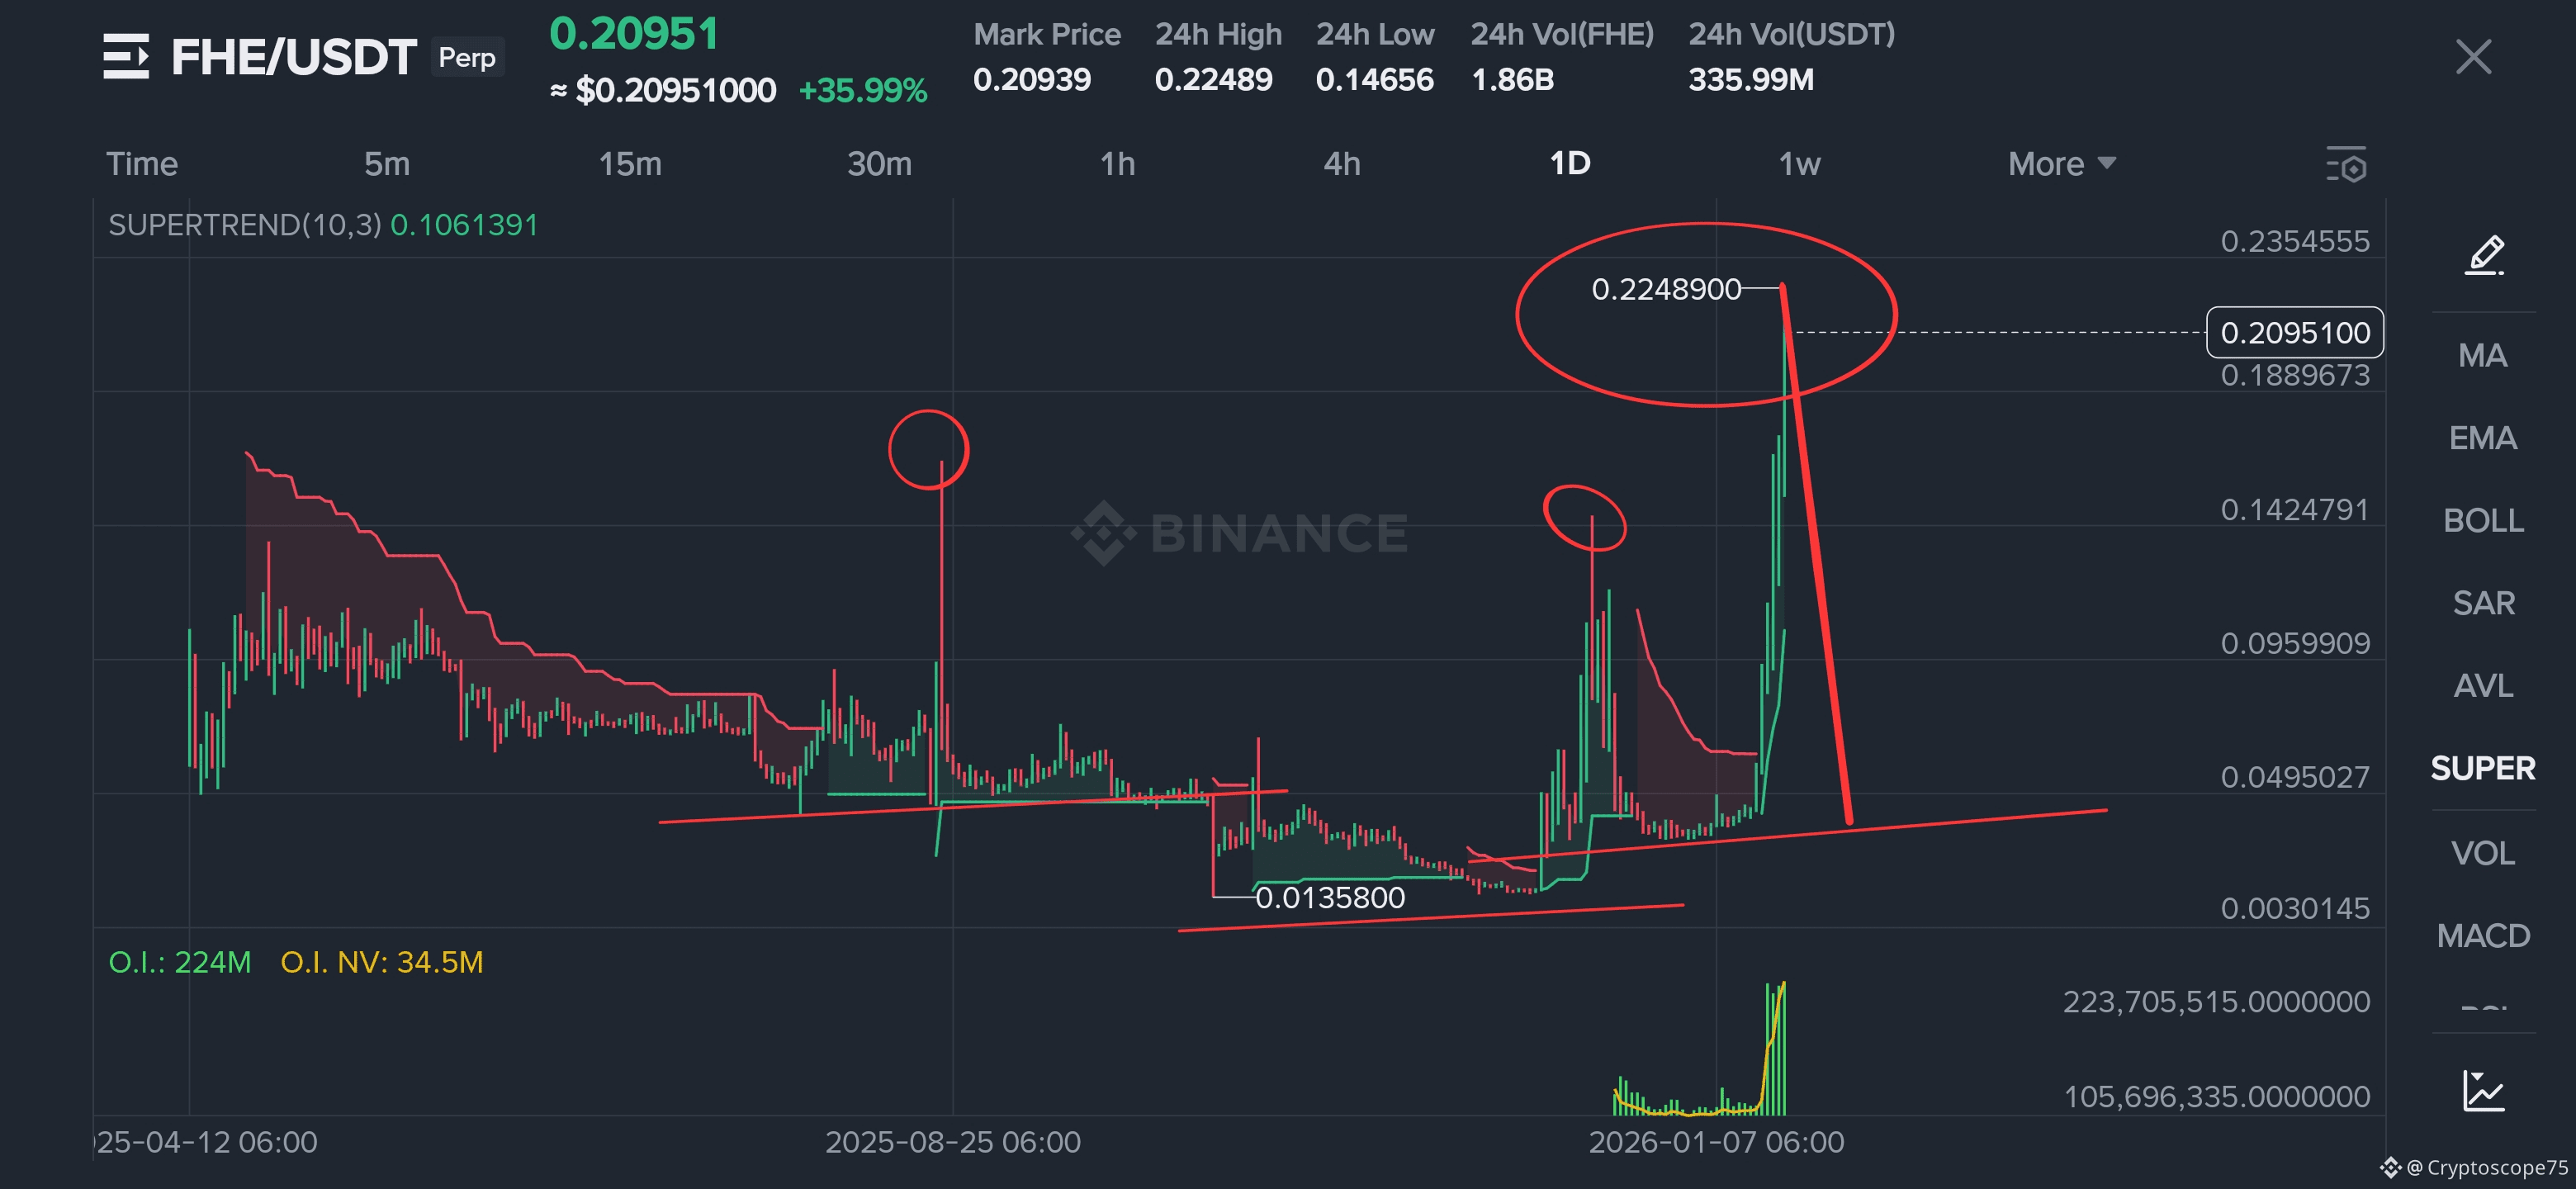
$FHE has delivered a sharp and aggressive upside expansion following an extended period of compression and accumulation. The current daily structure highlights a textbook volatility release, where price transitioned from prolonged consolidation into a near-vertical impulse, rapidly reaching the $0.2248 region before showing signs of exhaustion.
This move did not appear randomly. It is the direct outcome of a long base-building phase that was clearly visible on the previous chart structure 📉, where FHE spent months ranging, forming a stable floor, and repeatedly rejecting lower prices. That historical base created the liquidity and positioning required for the explosive move now observed 🚀.
🧠 Market Context and Historical Reminder
On the old chart, $FHE was locked in a prolonged downtrend and sideways accumulation zone, with price stabilizing near the $0.013 – $0.02 region. Multiple failed breakdown attempts and declining volatility signaled seller exhaustion — a classic environment where strong hands accumulate 🏦.
The recent chart confirms this narrative. Once price reclaimed structure and broke above resistance, FHE entered a full expansion phase, printing strong bullish candles with minimal pullbacks — a clear sign of breakout-driven momentum 📈.
📐 Current Technical Structure
Price has now pushed into the $0.22 – $0.23 zone, which represents the first major upside extension from the base. The sharp rejection from the highs and the sudden appearance of large bearish candles indicate that FHE has entered a high-risk reaction zone ⚠️.
Key technical observations:
Parabolic advance after long accumulation 🚀
First major test of higher-timeframe resistance 🧱
Volatility and volume expansion 🔥
Initial signs of short-term exhaustion ⏳
This phase often marks a transition from markup into consolidation or distribution, as early participants take profit and late buyers enter emotionally.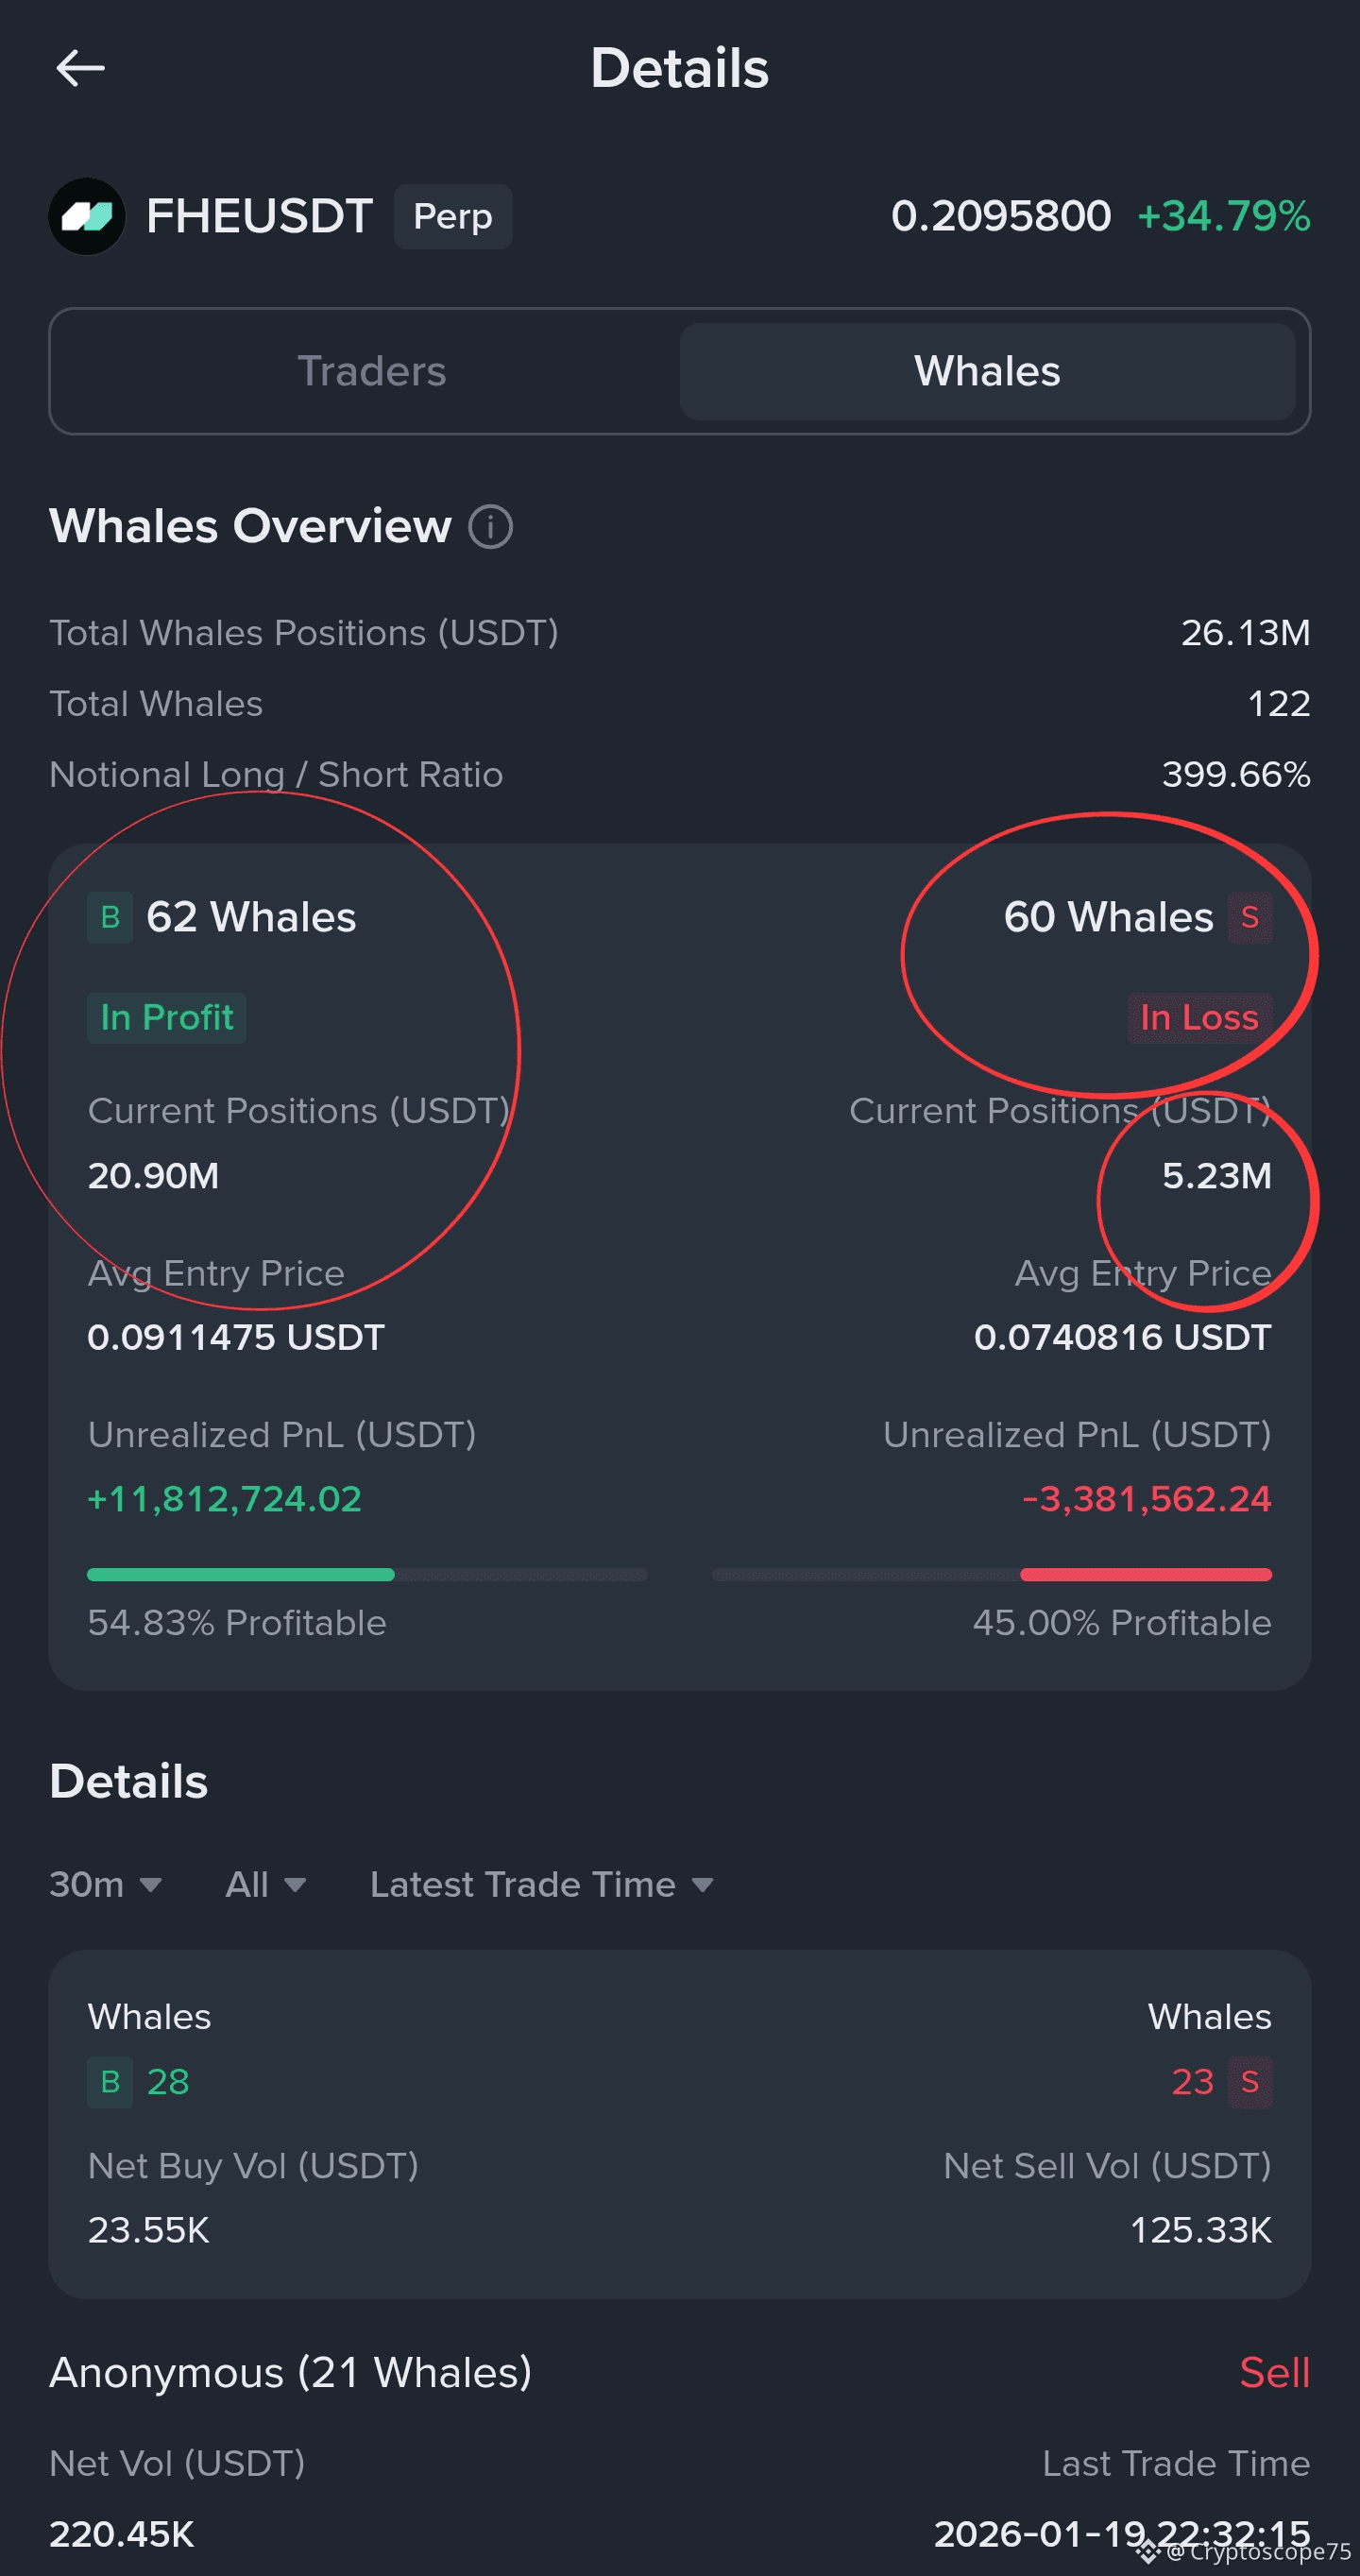
🔍 Behavioral Insight
Strong vertical moves rarely end immediately, but they almost never continue in a straight line. After such expansion, markets usually rotate into:
A corrective pullback 📉
A high-volatility range 🔄
Or a broader re-accumulation/distribution structure 🧩
The rejection from the highs suggests FHE is no longer in a low-risk breakout phase, but rather in a decision zone where structure will determine continuation or reset.
🧩 Conclusion
FHE’s current price action is the natural result of the long accumulation seen on the old chart. That base successfully fueled the recent explosive rally. However, after reaching higher-timeframe resistance and showing sharp rejection, FHE is now trading in a critical high-risk zone.
From a professional technical perspective, this is no longer an entry-on-strength environment. It is a zone for management, patience, and confirmation 🧠.
The old chart reminds us where this move started.
The current chart warns us that the easy phase is likely over.
A major move has already occurred.
What comes next will define the next trend. ⚖️
