
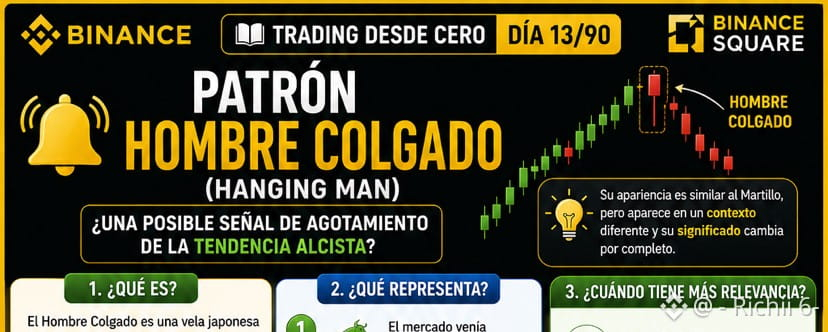
📘 Trading from Scratch – Day 13/90
🔔 Hanging Man Pattern: Could it be a possible sign of exhaustion of the uptrend?
In the previous lesson, we learned the Hammer Pattern, a candle that can appear after a downtrend and suggest a possible price recovery.
Today we’ll learn the Hanging Man Pattern. Although its appearance is very similar to the Hammer, its meaning changes completely because it appears in a different context.
Understanding this difference can help you interpret market behavior better and avoid decisions based solely on the shape of a candle.
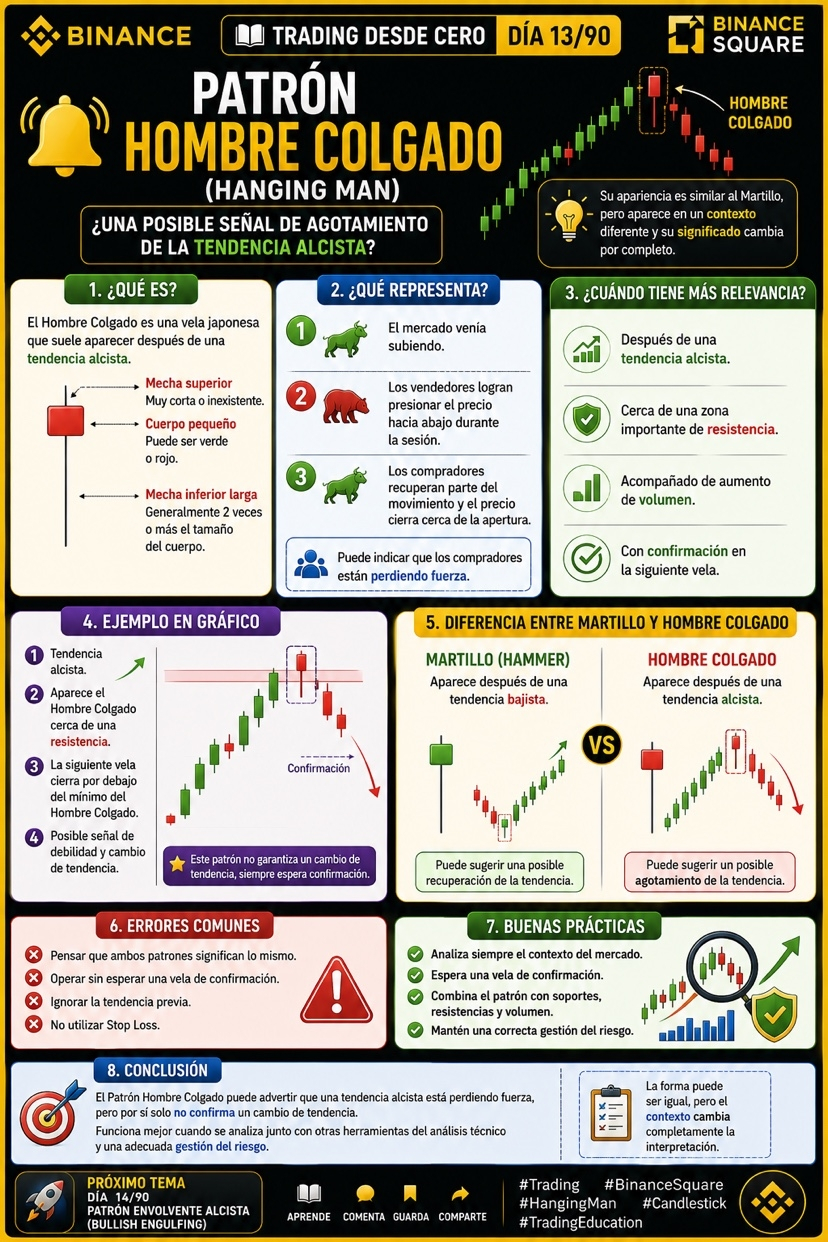
What is the Hanging Man Pattern?
The Hanging Man (Hanging Man) is a Japanese candlestick that usually appears after an uptrend.
It is characterized by showing:
🔹 A small body.
🔹 A long lower wick, generally at least twice the size of the body.
🔹 A very small or nonexistent upper wick.
Visually it’s almost the same as the Hammer, but the difference is in where it appears within the trend.
What does it represent?
During that candle, the following happens:
📈 The market had been rising.
📉 Sellers manage to push the price downward during the session.
📈 Finally, buyers recover part of the move and the price closes near the open.
This may indicate that buying pressure is starting to lose strength and that sellers are beginning to participate with greater intensity.
When is it most relevant?
The Hanging Man Pattern is usually more meaningful when:
✅ It appears after an uptrend.
✅ It forms near an important resistance zone.
✅ It is accompanied by an increase in volume.
✅ The next candle confirms the bearish move.
Simple example
Imagine that Ethereum has been rising for several days.
Near a resistance, a candle appears with a small body and a long lower wick.
If the next candle breaks below the Hanging Man’s low, some traders interpret it as a possible sign of weakness in the uptrend.
Difference between Hammer and Hanging Man
Although both candles have practically the same shape:
🔨 Hammer: appears after a downtrend and can suggest a possible recovery.
🔔 Hanging Man: appears after an uptrend and may suggest a possible exhaustion of the move.
The context is always more important than the candle shape.
Common mistakes
❌ Thinking that both patterns mean the same thing
❌ Trade without waiting for a confirmation candle.
❌ Ignore the previous trend.
❌ Do not use a Stop Loss.
Best practices
✅ Always analyze the market context.
✅ Wait for confirmation before opening a trade.
✅ Combine the pattern with support levels, resistance levels, and volume.
✅ Maintain proper risk management.
Conclusion
The Hanging Man Pattern can warn that an uptrend is losing strength, but by itself it does not confirm a trend reversal.
Like any candlestick pattern, it works best when analyzed together with other tools from technical analysis and proper risk management.
📘 On Day 14/90, we’ll learn the Bullish Engulfing Pattern and how to identify a possible signal of buying strength.
💬 Question:
🤔 If you saw a Hanging Man after a strong rally, would you expect a confirmation candle before making a decision, or would you act immediately? Why? 💬
#Trading #BinanceSquare #HangingMan #Candlestick #TradingEducation