
Today we analyze Solana in two dimensions. The weekend recovery was not a coincidence, but now we face the "Final Boss" on the daily chart.
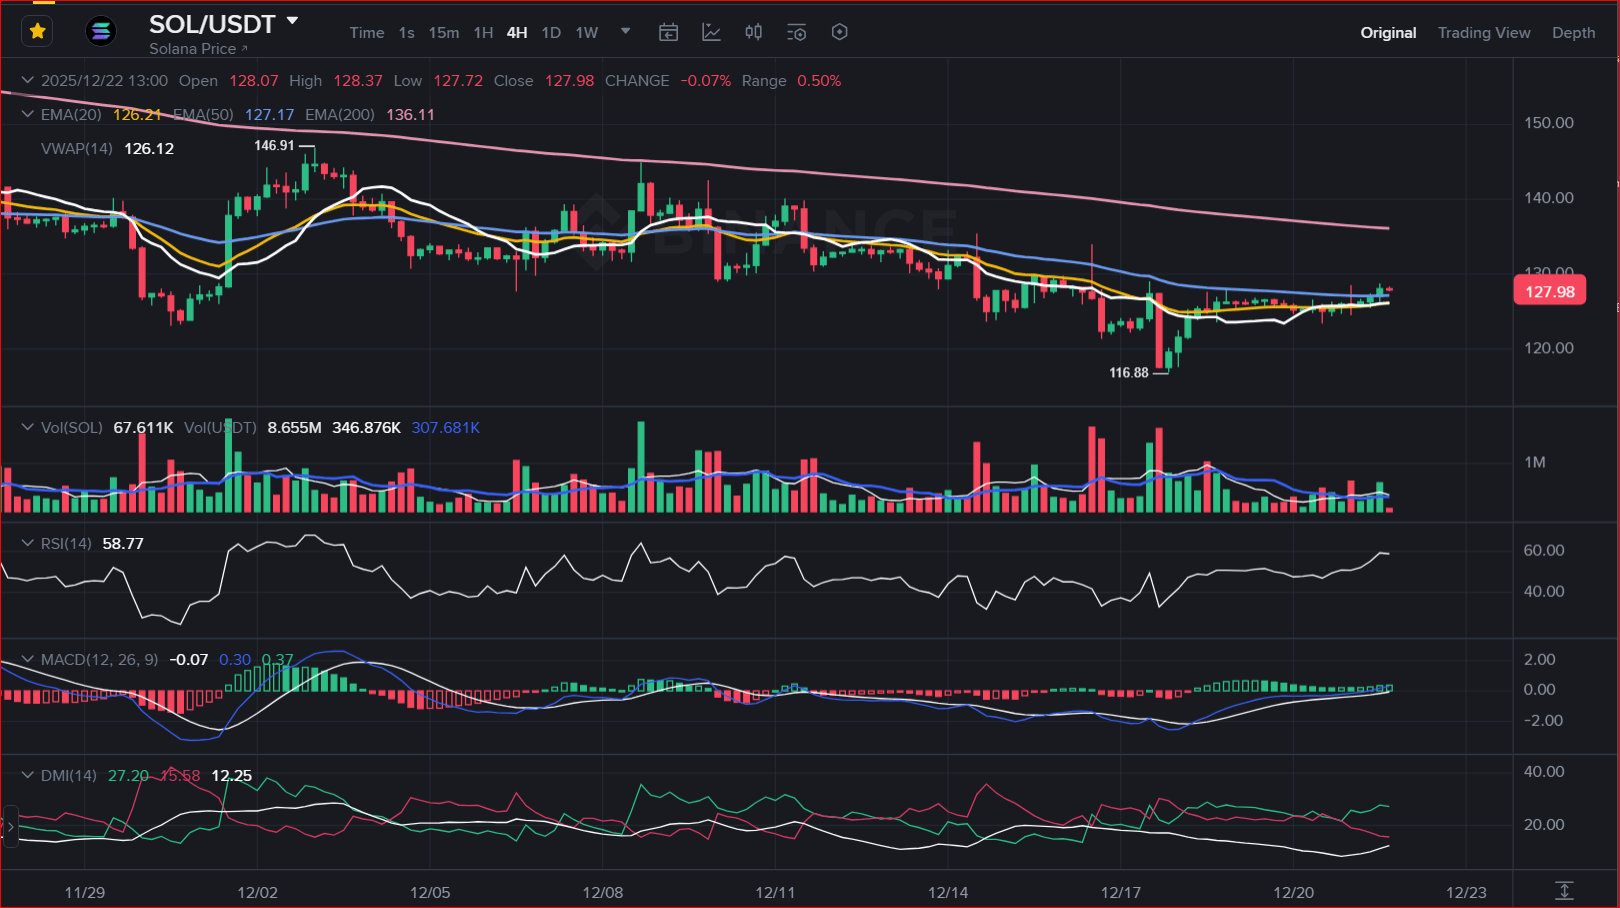
1️⃣ The Tactical Vision (4 Hour Chart): Bullish!
The "Bear Trap" at $116 worked perfectly.
Buy Signal: The price ($127.98) has strongly broken the EMA 50 (Blue Line) which was at $127.17.
Momentum: The RSI at 58.77 indicates that there is healthy buying strength, without being overbought yet. In the short term, the bulls are in control.
The Tactical Vision (4 Hour Chart): Bullish!
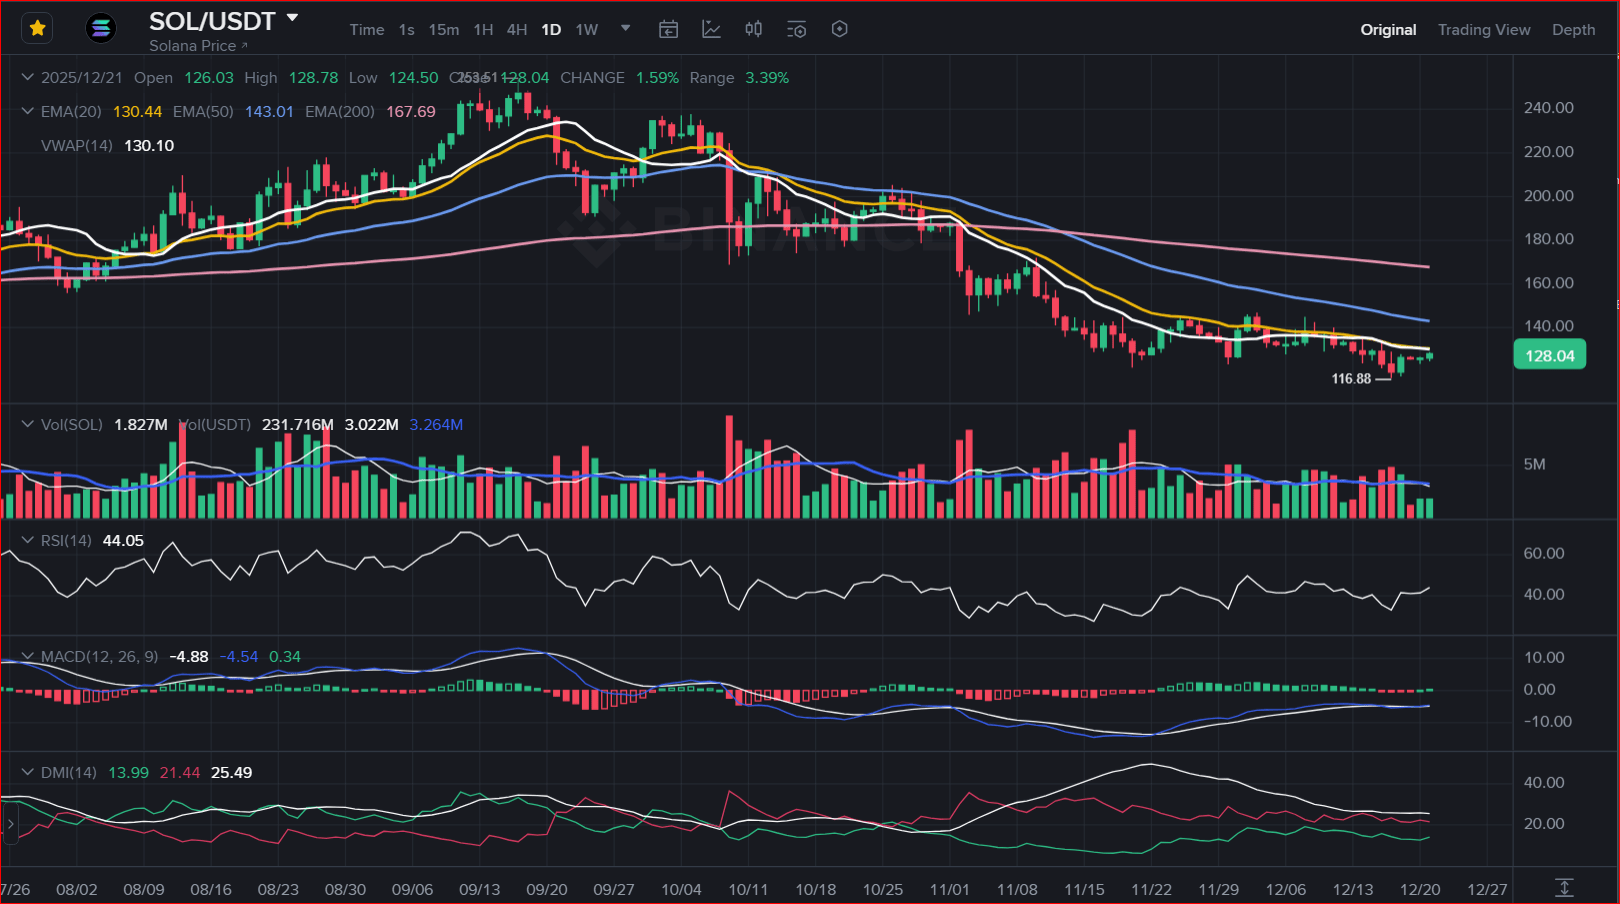
2️⃣ The Strategic Vision (Daily Chart): The Crucible Test
This is where we need to be careful. Although we are rising, we are still below the Daily 20 EMA (Yellow Line) located at $130.44.
This line acts as a strong dynamic resistance. The daily RSI (44.05) has a lot of room to rise, but we need to break $130 to confirm the medium-term trend change.
The Strategic Vision (Daily Chart): The Crucible Test
🎯 FINAL CONCLUSION:
The 4H structure is pushing strongly upwards. If we manage to break the $130.50 barrier today or tomorrow, we will confirm a definitive bottom.
Support Zone: $126 (We must not lose it).
👇 Do you think SOL has the strength to break $130 today?
#solana $SOL #tradingStrategy #altcoins #BinanceSquare
🇬🇧 English Summary:
SOL Deep Dive (4H vs 1D).
4H Chart: Bullish. SOL broke above the 50 EMA ($127.17), confirming the recovery from the bear trap.
Daily Chart: The Test. Price is approaching the critical 20 EMA ($130.44). Breaking this level is mandatory to confirm a mid-term trend reversal.
