

 Solana
Executive Summary
KkkkSOLUSD has declined approximately 52 percent from its November 2024 all-time high of 264 USD to current levels around 126 USD. This analysis examines the technical structure, on-chain metrics, and fundamental catalysts to determine high-probability trade zones. The evidence suggests further downside toward the 100-115 USD accumulation zone before a sustainable recovery can begin.
Technical Structure Analysis
Price Action Overview
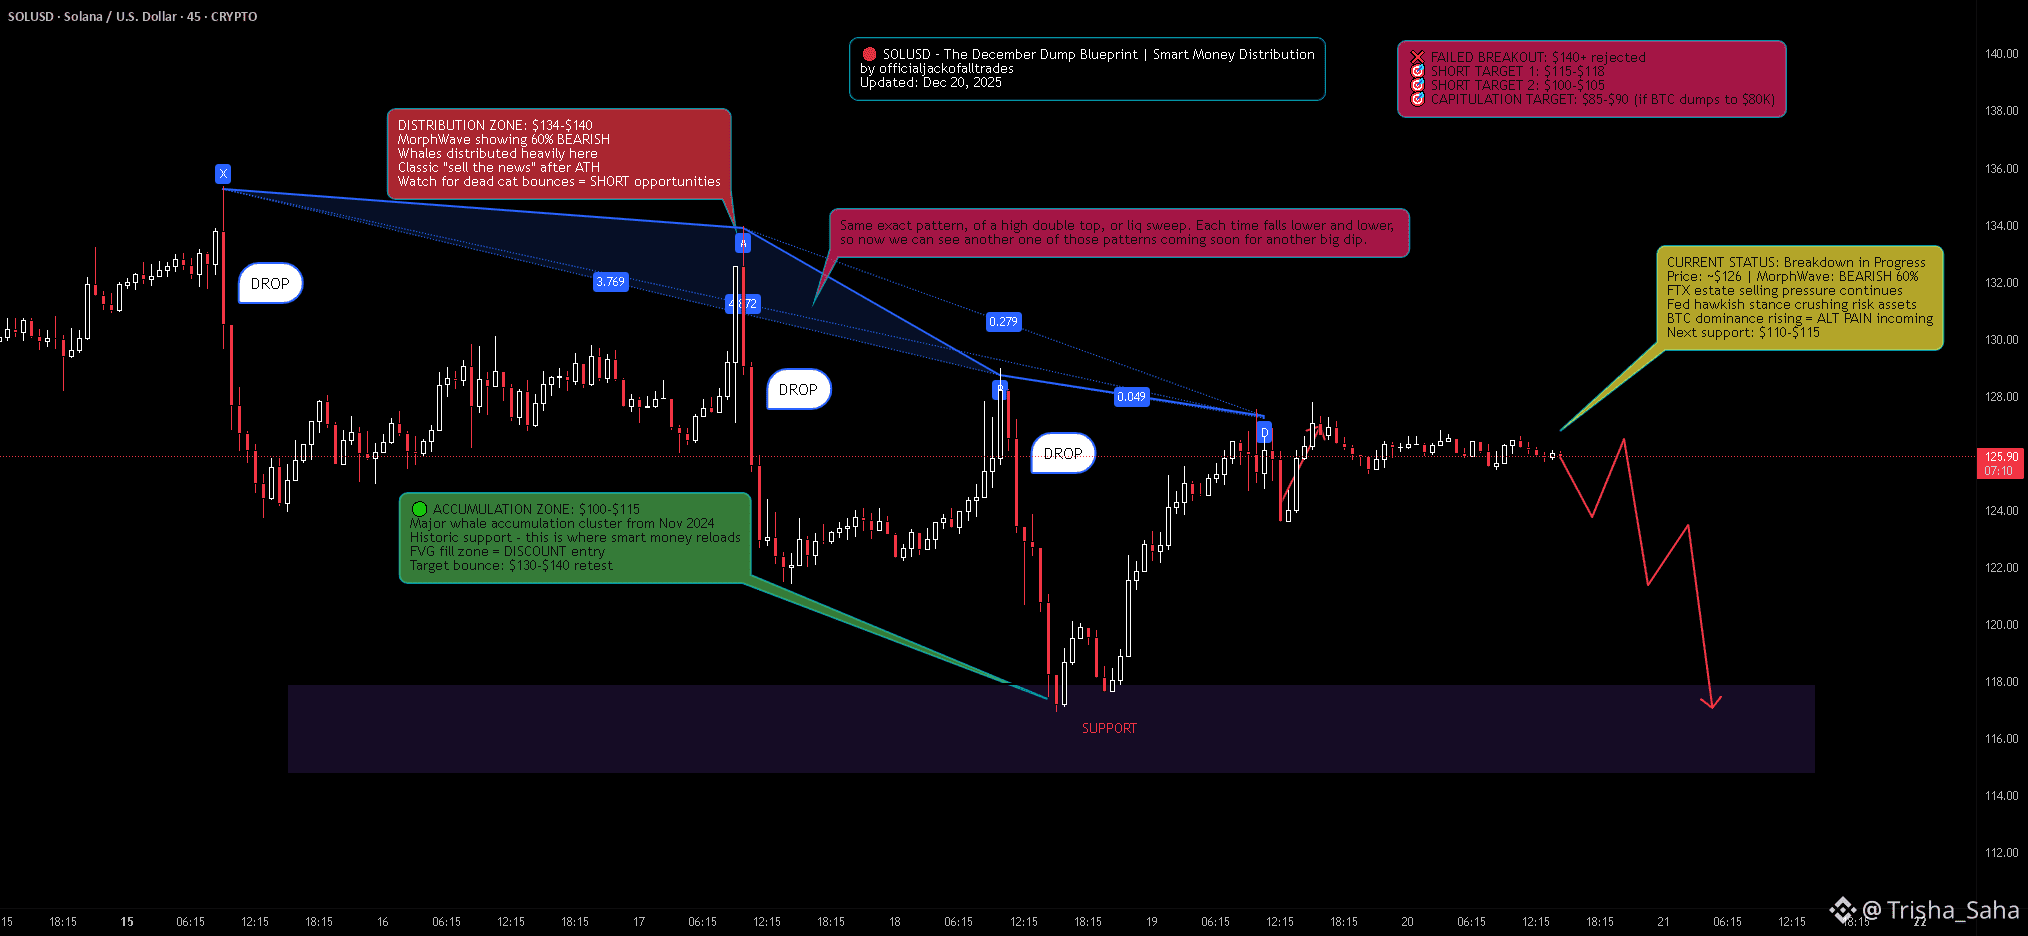
Solana is currently trading within a descending channel that formed after the November 2024 peak. The structure shows:
Lower highs at 264, 220, 180, and 145 USD forming clear descending resistance
Lower lows indicating sustained selling pressure
Current price testing the 125-130 USD zone which previously acted as resistance in October 2024
Volume declining on bounces and increasing on selloffs - classic distribution signature
Key Support and Resistance Levels
Resistance Zones:
140-145 USD - Recent swing high rejection zone
160-165 USD - Previous support turned resistance
180-185 USD - Major structural resistance
Support Zones:
115-120 USD - Minor support, likely to break
100-105 USD - Major support, November 2024 breakout origin
85-90 USD - Secondary support if macro deteriorates
Moving Average Analysis
Price is trading below the 20, 50, and 200 period moving averages on the daily timeframe
The 20 MA has crossed below the 50 MA, confirming short-term bearish momentum
The 200 MA is flattening and beginning to slope downward
Moving averages are fanning out in bearish alignment
RSI and Momentum
Daily RSI is currently in the 35-40 range, approaching oversold but not yet at extreme levels
RSI has been making lower highs alongside price, confirming the downtrend
No bullish divergence present yet - divergence at the 100-115 zone would be a strong buy signal
Weekly RSI has room to decline further before reaching oversold extremes seen at previous bottoms
Volume Profile
High volume node exists at the 100-115 USD zone from the November 2024 accumulation period
Current price zone shows relatively low volume, suggesting lack of strong buyer interest
Volume has been declining during recent bounce attempts - weak demand
A volume spike at the 100-115 zone would confirm institutional accumulation
Fibonacci Retracement
Measuring from the September 2024 low of 120 USD to the November 2024 high of 264 USD:
0.382 retracement: 209 USD - Already broken
0.5 retracement: 192 USD - Already broken
0.618 retracement: 175 USD - Already broken
0.786 retracement: 151 USD - Already broken
Full retracement: 120 USD - Currently testing
The breakdown through the 0.786 level suggests the move is corrective in nature and a full retracement to the 100-120 USD origin zone is probable.
On-Chain and Fundamental Analysis
Network Activity Metrics
Solana network statistics show mixed signals:
Daily active addresses have declined from peak levels during the meme coin mania
Transaction counts remain elevated compared to other Layer 1 networks
Total Value Locked in Solana DeFi protocols has decreased from highs
NFT trading volume on Solana marketplaces has cooled significantly
Supply Distribution
Large holder concentration remains high with significant whale wallet activity
Exchange inflows have increased in recent weeks, indicating selling pressure
Staking participation remains strong, reducing liquid supply
FTX bankruptcy estate continues systematic liquidation of SOL holdings
Macro Factors Affecting Solana
Bearish Catalysts:
Federal Reserve December 2025 meeting maintained hawkish stance with fewer rate cuts projected for 2026
Risk-off sentiment affecting high-beta assets disproportionately
BTCUSD dominance rising, indicating capital rotation from altcoins to Bitcoin
Regulatory uncertainty regarding Solana ETF approval timeline
FTX estate selling pressure creating persistent supply overhang
Meme coin speculation that drove the 2024 rally has cooled substantially
Bullish Catalysts:
Solana network upgrades improving transaction throughput and reliability
Growing institutional interest in Solana ecosystem projects
Potential Solana ETF approval could drive significant inflows
Strong developer activity and ecosystem growth metrics
Firedancer client development progressing, promising improved network performance
Solana remains the preferred chain for new DeFi and consumer applications
Competitive Positioning
Solana maintains advantages over competing Layer 1 networks:
Transaction costs remain significantly lower than ETHUSD mainnet
Transaction speed and finality superior to most competitors
Developer ecosystem continues expanding despite price decline
Institutional partnerships and integrations increasing
However, challenges persist:
Network outages and congestion issues have damaged reputation
Centralization concerns regarding validator distribution
Competition from Ethereum Layer 2 solutions intensifying
Regulatory classification uncertainty in United States
Whale and Institutional Activity
Recent on-chain data indicates:
Large wallets have been net sellers over the past 30 days
Exchange deposits from whale addresses have increased
Institutional funds have reduced Solana allocation according to fund flow data
However, accumulation signals are appearing at lower price levels
The pattern suggests distribution at current levels with potential accumulation beginning at the 100-115 USD zone.
Trade Framework
Primary Scenario - Bearish Continuation (Higher Probability)
The weight of evidence supports further downside before a sustainable bottom forms:
Technical structure remains bearish with lower highs and lower lows
Price below all major moving averages
Macro environment unfavorable for risk assets
On-chain metrics showing distribution
No bullish divergence on momentum indicators yet
Short Setup:
Entry Zone: 130-140 USD on relief bounces
Stop Loss: Above 148 USD
Target 1: 115-118 USD
Target 2: 105-108 USD
Target 3: 95-100 USD
Secondary Scenario - Accumulation at Support
The 100-115 USD zone represents a high-conviction long opportunity if confirmation signals appear:
This zone was the origin of the November 2024 rally
High volume node from previous accumulation period
Full Fibonacci retracement level
Psychological round number support at 100 USD
Long Setup:
Entry Zone: 100-115 USD
Stop Loss: Below 92 USD
Target 1: 130-135 USD
Target 2: 150-160 USD
Target 3: 180-200 USD
Confirmation Signals Required for Long Entry:
Bullish RSI divergence on daily timeframe
Volume spike on bullish candle at support
Price reclaiming the 20 period moving average
Higher low formation on 4-hour timeframe
Decrease in exchange inflows from whale wallets
Risk Management
Position sizing should not exceed 2-3 percent of portfolio for short setups
Long setups at the 100-115 zone warrant 3-5 percent allocation due to higher conviction
Scale into positions using 3 tranches rather than single entry
Move stop loss to breakeven after first target achieved
Avoid trading the 120-130 USD range without clear directional confirmation
Monitor BTCUSD price action as correlation remains high
Invalidation Levels
Bearish thesis invalidated if:
Daily close above 150 USD with increasing volume
Price reclaims 50 and 200 moving averages
RSI breaks above 60 with momentum
Bullish thesis invalidated if:
Daily close below 92 USD
Volume spike on breakdown below 100 USD
Bitcoin breaks below 75000 USD triggering broader market selloff
Timeline Expectations
Short-term (1-4 weeks): Expect continued weakness toward 100-115 USD support zone
Medium-term (1-3 months): Potential basing pattern formation if support holds
Long-term (3-6 months): Recovery rally possible if macro conditions improve and Solana-specific catalysts materialize
Conclusion
SOLUSD is in a clear distribution phase following the November 2024 peak. The technical structure, on-chain metrics, and macro environment all point to further downside before a sustainable bottom forms.
The 100-115 USD zone represents the highest probability accumulation area based on:
Historical significance as the November 2024 breakout origin
Fibonacci full retracement level
High volume node from previous accumulation
Psychological support at 100 USD round number
The recommended approach is patience. Avoid buying at current levels where distribution is occurring. Wait for price to reach the 100-115 USD zone and confirm with bullish divergence and volume signals before establishing long positions.
For traders seeking short exposure, relief bounces to the 130-140 USD zone offer favorable risk-reward entries with defined stops above 148 USD.
This is not financial advice. Always conduct independent research and manage risk appropriately.


