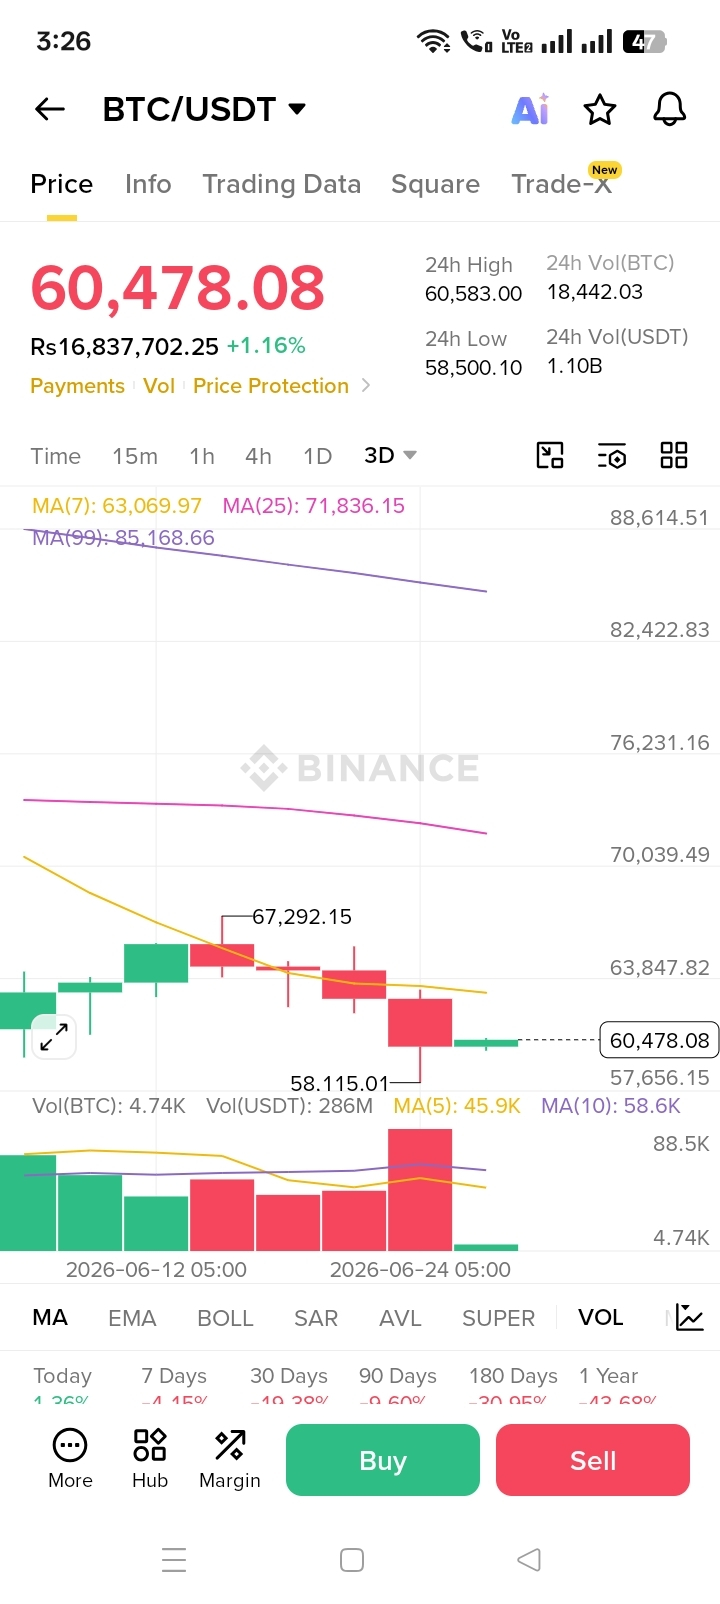
Based on the Binance 3D chart you shared, Bitcoin is currently facing bearish pressure. Here is the latest analysis:
### *1. Current Price Action*
- *Current Price*: $60,478.08, and in the past 24 hours it is up by +1.16%
- *In PKR*: Rs 16,837,702.25
- *24h Range*: Low $58,500.10 to High $60,583.00
- The price is consolidating around $60,478 on the chart, which is a slight recovery from the recent low of $58,115.01
### *2. What Are the Technical Indicators Saying*
- *Moving Averages Bearish*: MA(7) $63,069.97, MA(25) $71,836.15, and MA(99) $85,168.66 are all above the price. When the price is below all major MAs, it is called a bearish structure.
- *Volume Spike*: A large red volume candle formed around $58,115. This means heavy selling happened at that level, but buyers managed to hold it.
- *Recent Rejection*: Price rejected from $67,292.15 and moved lower. This level has now become immediate resistance.
### *3. Support & Resistance Levels*
- *Immediate Support*: $58,500.10 - The 24h low is near. If this breaks, the next target could be $57,656.15.
- *Immediate Resistance*: The MA(7) area at $63,847.82 and the recent swing high at $67,292.15.
- *24h Volume*: 18,442.03 BTC in BTC and 1.10B in USDT, showing good liquidity.
### *4. What Could Happen Next?*
The chart is on a 3D timeframe, meaning each candle represents 3 days. Right now, the price is trading below the sloping MAs. If the $58,500 support holds, a bounce up to $63K is possible. But if this support breaks, selling could increase.
*Note*: This is only technical analysis of the data available on the chart. The crypto market is highly volatile. Make trading or investment decisions with your own research and risk capacity.
Do you want me to also create a short 1-minute Facebook/YouTube script for this chart?