

🔍 Market Structure
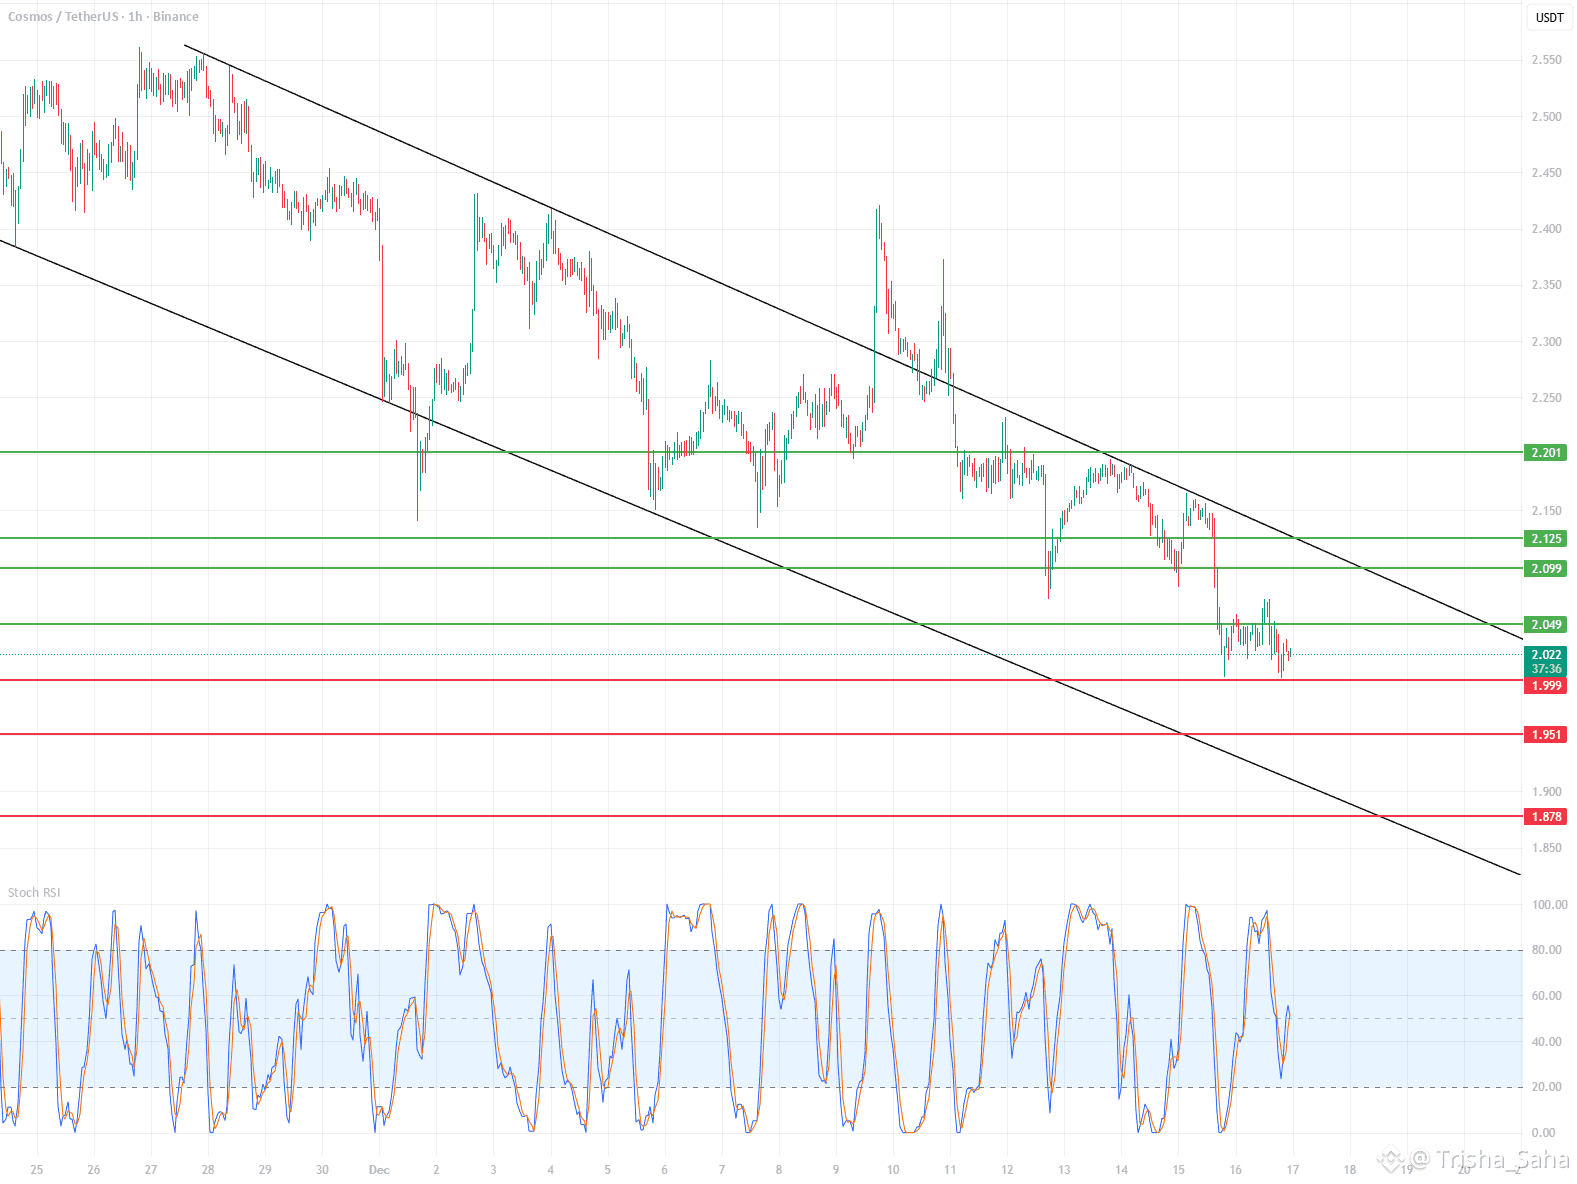
Clear downtrend – price is moving within a descending channel (lower highs and lows).
Each bounce is sold at the upper band of the channel.
No signal of a change in structure yet (no HH + HL).
📉 Current Price Status
Price is at the lower end of the channel.
Consolidation after a downward impulse → typical bearish continuation or short technical rebound.
Current Zone:
~2.02–2.05 USDT – local support + demand reactions.
🟢 Key Levels
Support
2.049 – local support (current reaction)
1.999 – strong psychological support
1.951
1.878 – lower demand zone (important!)
Resistance
2.099
2.125
2.201 – key resistance / S→R flip.
Upper channel line (~2.20–2.23)
📊 Stochastic RSI
Oscillator often in oversold territory.
Currently recovering from the low → possible short rebound.
BUT: in a downtrend. The Stoch RSI is not a long-term signal.
➡️ More likely a pullback, not a trend change.
🧠 Scenarios
🔴 Baseline scenario (most likely)
Bounce to:
2.09 → 2.12
Rejection + further decline:
1.99
then 1.95 / 1.88
➡️ Short at resistance levels in line with the trend.
🟢 Alternative scenario (less likely)
Breakout of 2.20 + close of the 1H candle above the channel
Retest from above
Then targets:
2.28
2.35–2.40
➡️ Only then can we talk about a change in structure.
