
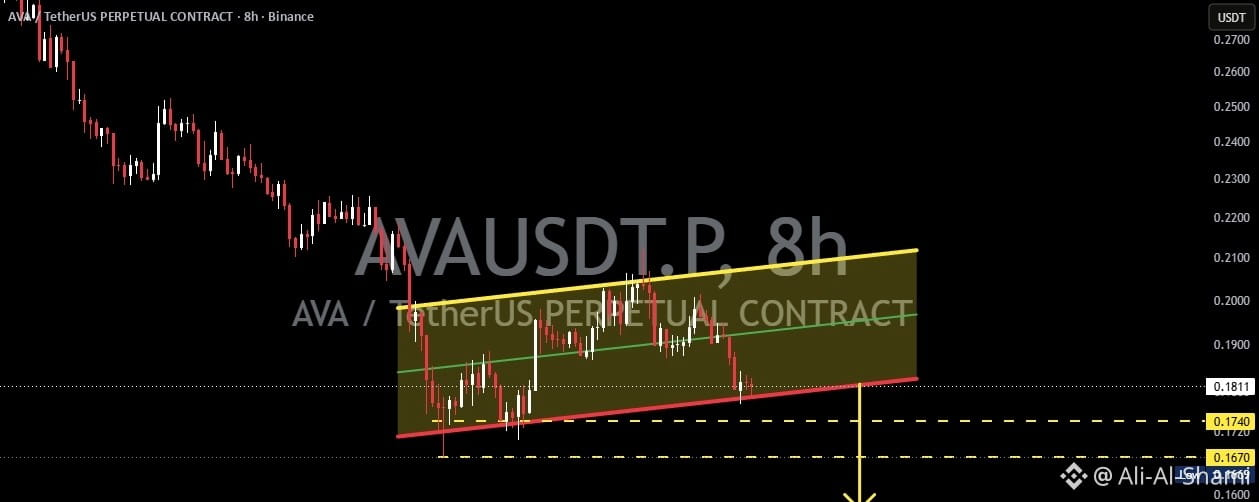
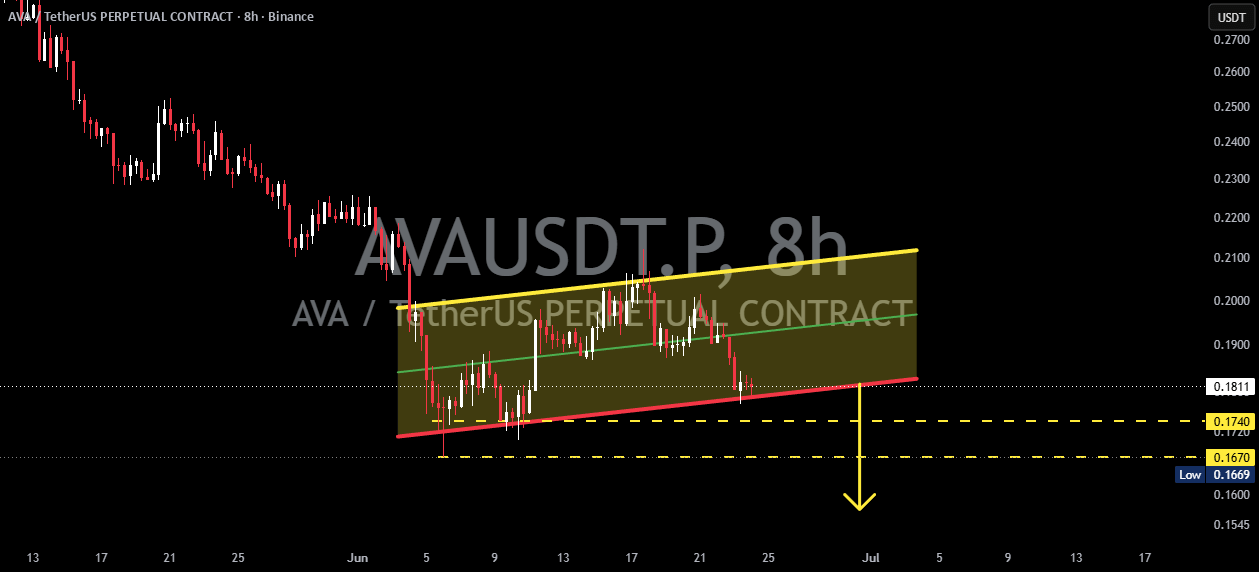
#AVAUSDT On the 8-hour chart, we are currently forming a 🐻 bear flag, which is a classic bearish continuation pattern that typically appears after a sharp pullback (📉 flagpole) followed by a temporary bullish consolidation within an ascending channel.
Right now, the price is testing the bottom of the channel and showing signs of weakness in bullish momentum. If this support fails to hold, the likelihood of further downside increases significantly.
---
🐻📉 Explanation of the bearish flag pattern
❓ What is a bearish flag?
A bearish flag is a continuation pattern that consists of three main stages:
1️⃣ 📉 Flag pole
- Strong and impulsive decline.
- Reflects aggressive selling pressure.
- Serves as a basis for predicting the next bearish target.
2️⃣ 📈 Flag (ascending channel)
- Prices are gradually moving up within a rising channel.
- Often represents a temporary bounce or correction.
- Often traps buyers before the bearish trend resumes.
3️⃣ ⚠️ Breakdown
- Occurs when prices break below the channel support.
- Confirms ongoing bearishness.
- Often triggers the next leg down in the previous trend direction.
On this candle, the bearish flag structure is clear as prices continue to consolidate within an ascending channel after a significant drop.
---
🎯 Key levels
🟢 Major support
📍 $0.1740
- Important horizontal support level.
- A key area that buyers must defend.
🟢 Next support
📍 $0.1670
- Previous low point.
- Primary bearish target if a breakdown occurs.
🔴 Dynamic resistance
📍 Upper bearish flag channel
📍 $0.2000 – $0.2100 Resistance zone
---
🚀🐂 Bullish scenario
To maintain a bullish stance:
✅ Prices must remain above $0.1740
✅ Buyers need to push prices back towards the middle of the channel.
✅ A breakout above the channel resistance around $0.2000 – $0.2100 will invalidate the bearish flag structure.
🎯 If a breakout occurs with strong volume confirmation, AVA may continue its recovery towards higher resistance levels.
---
🔻🐻 Bearish scenario
This remains the prevailing scenario based on the current market structure:
❌ Price failed to hold the channel support
❌ Breakdown below $0.1740
❌ Confirmation of the bearish flag occurs with a strong candle close below support.
🎯 Bearish Target
📍 $0.1670
If selling pressure increases, AVA may look for lower support levels before finding significant demand.
---
📈📌 Summary
AVAUSDT remains trapped within a 🐻 bearish flag structure on the 8-hour time frame.
As long as prices stay below the channel resistance and fail to reclaim the $0.2000 area, bearish pressure continues to dominate the market.
⚠️ The $0.1740 level is the key area to watch.
📉 A confirmed break below this support may validate the bearish flag pattern and open the door for a move towards $0.1670 or possibly lower.
💡 Traders should wait for either a confirmed breakout or breakdown before taking larger positions, as the current area may set the next main trend.

#SpaceXSharesFall #DeXeJumps70%In24h #EthereumFoundationToCutBudget40%