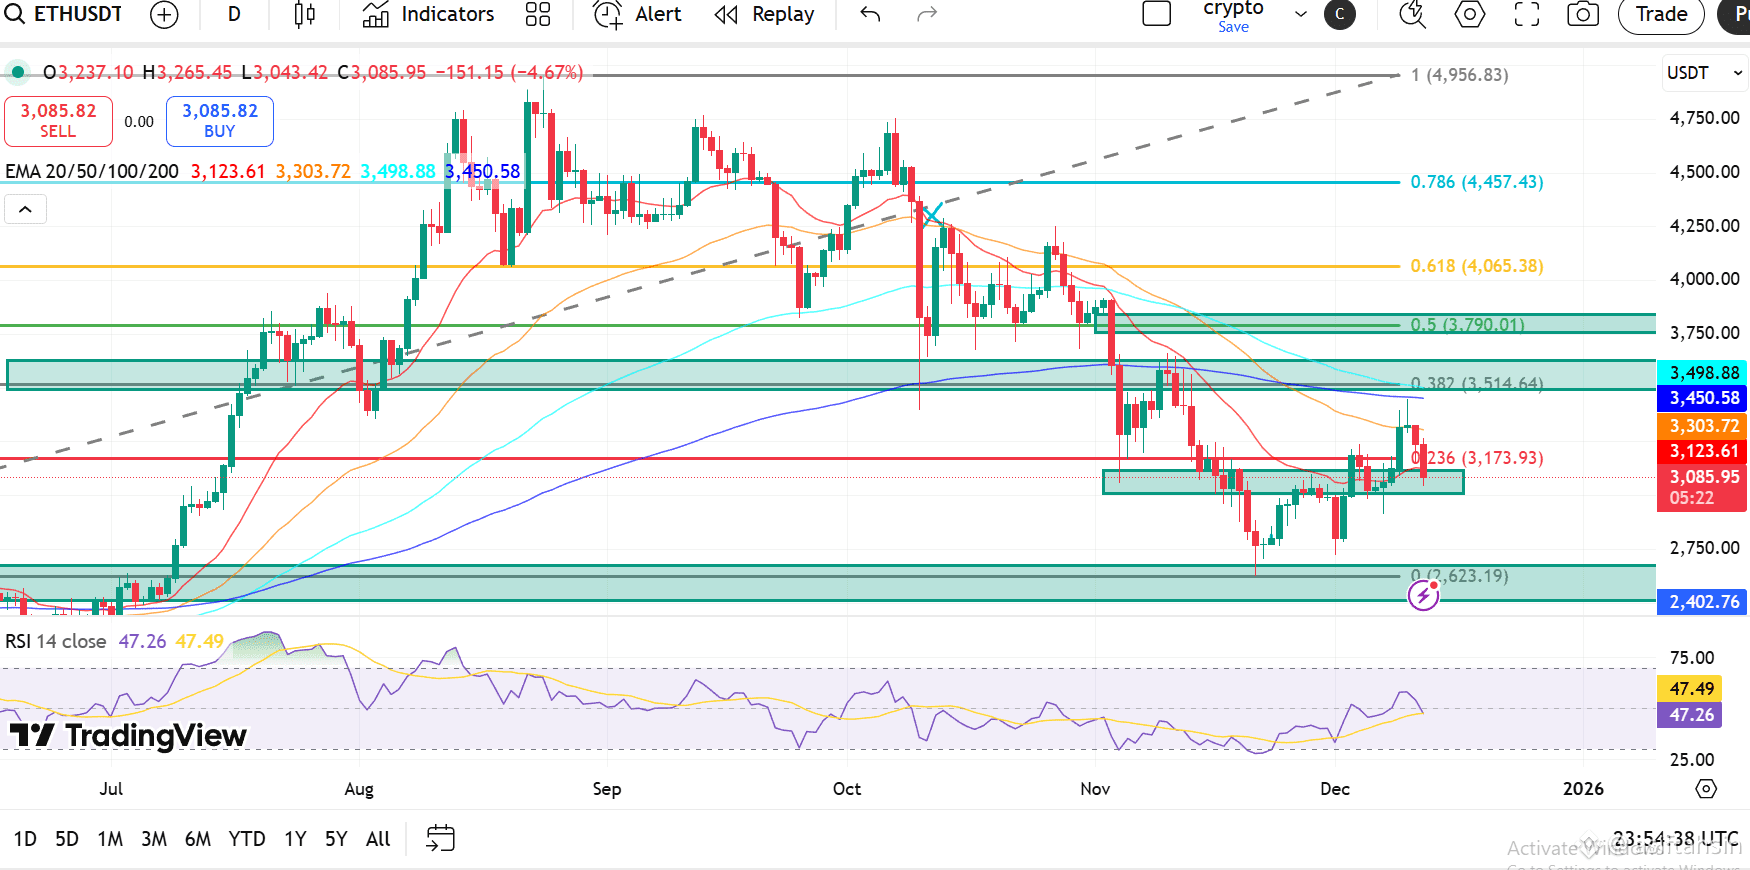
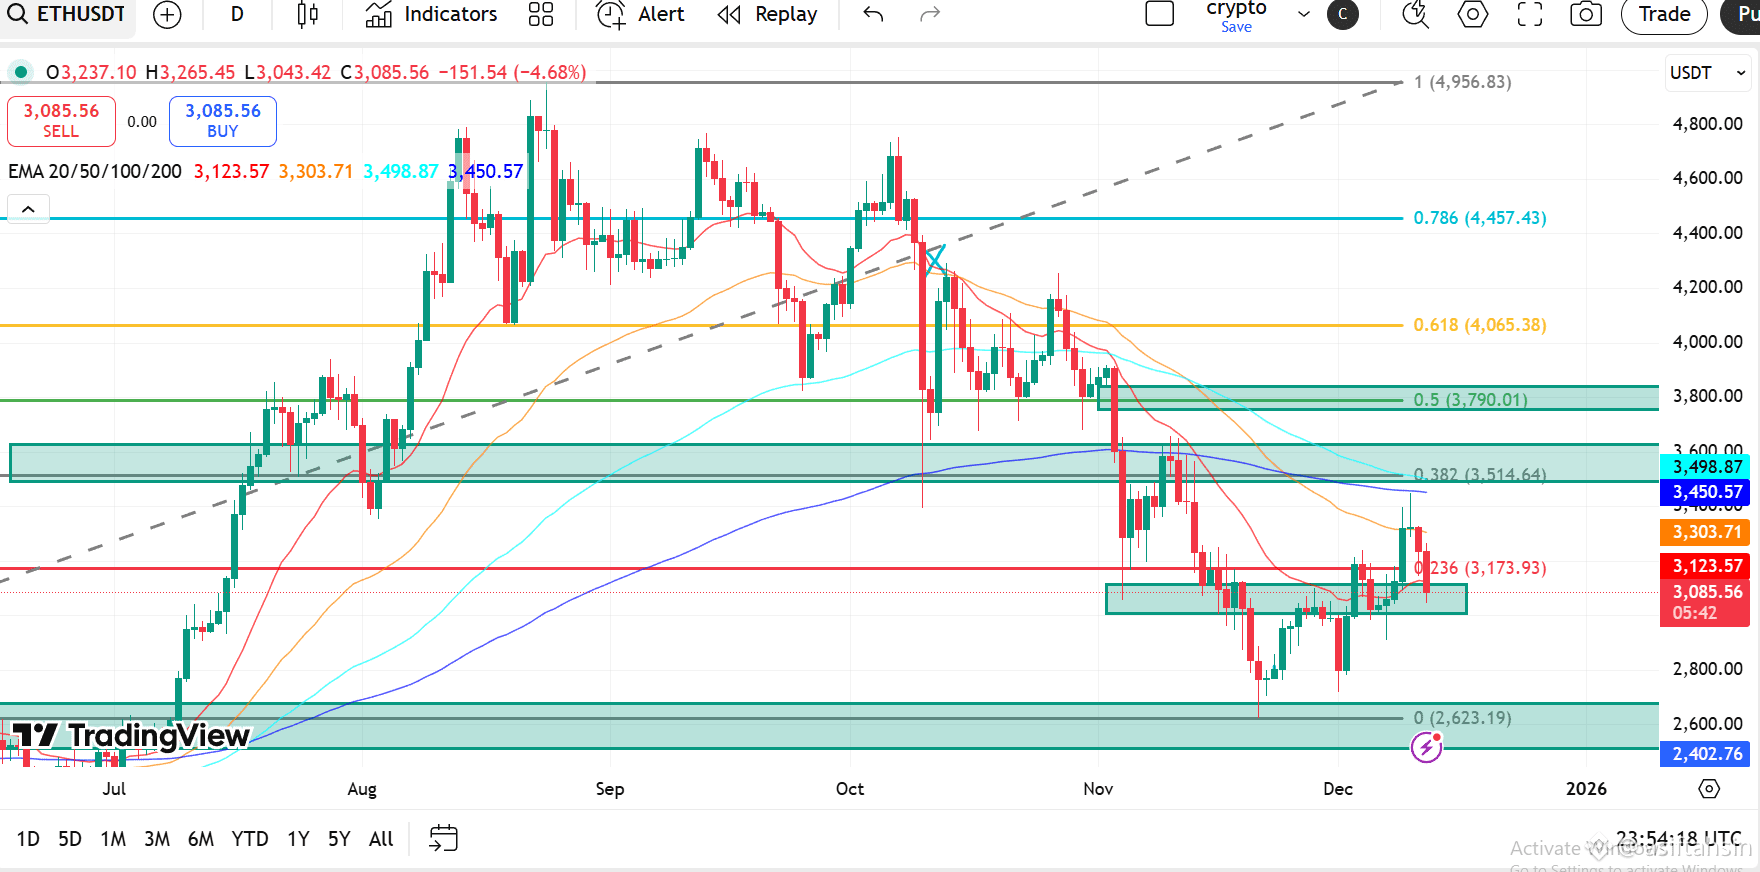
ETH is attempting to stabilize after a sharp sell-off that pushed price into the $2,750–$2,850 demand zone, where buyers stepped in to slow downside momentum. This area aligns with a historically strong support region and the Fib 0 level at $2,623, making it a critical zone for short-term structure.
The decline accelerated after ETH faced repeated rejection near the $3,790–$4,065 resistance range, corresponding to the 0.5 and 0.618 Fibonacci levels, confirming strong seller presence at higher prices.
ETH remains below all major EMAs:
20 EMA – $3,123
50 EMA – $3,304
100 EMA – $3,499
200 EMA – $3,451
This EMA stacking continues to cap upside moves and keeps the broader trend bearish.
The current rebound is constructive but still weak. A daily close above $3,174 (0.236 Fib) would signal early stabilization. However, trend recovery will only gain traction if ETH reclaims $3,514 (0.382 Fib) and then breaks above $3,790 (0.5 Fib).
A full bullish structure shift requires a sustained breakout above $4,065 (0.618 Fib) — a level where prior distribution occurred.
On the downside, failure to hold above $2,850 could send ETH back toward $2,623, with the next major demand zone near $2,400 if selling pressure resumes.
RSI at 47.2 shows neutral momentum, suggesting ETH is consolidating rather than trending aggressively.
📊 Key Levels
Resistance
$3,174 (0.236 Fib)
$3,514 (0.382 Fib)
$3,790 (0.5 Fib)
$4,065 (0.618 Fib)
$4,457 (0.786 Fib)
Support
$2,850
$2,623 (major Fib support)
$2,400 (extended demand zone)
RSI
47.2 — neutral, range-bound
📌 Summary
ETH is holding above a key demand zone after a steep correction, but the broader structure remains bearish as long as price stays below the $3,514–$3,790 resistance band. Bulls need a decisive breakout above $4,065 to confirm trend reversal, while failure to hold current support may reopen downside risk.
