This week, Bitcoin made a strong rebound from around $60,700 to near $64,400, closing the week up about 6%. The CPI data became a key catalyst for this market shift, as the bears' defense at the $64,000 level was breached. However, with institutional ETFs seeing over $4.4 billion in net outflows and the fear and greed index still in the extreme fear zone, is this rebound a trend reversal or just a technical correction? This article dissects this week's market logic using the latest on-chain data and macroeconomic insights, and looks ahead to the trends for next week.
1. This week's market overview: a textbook-level bull and bear showdown
This week's Bitcoin trend can be regarded as the most spectacular "bull and bear textbook" since 2026.
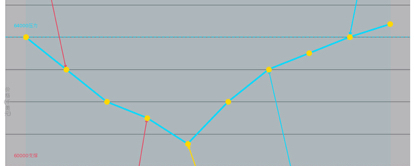
On Monday, after a deep drop, the market hit a high during a rebound, then started to pull back. The market's bullish and bearish forces are tending towards balance, with the Bollinger Bands contracting, creating a classic oscillating recovery pattern. At this point, being bullish could yield a short-term profit of over 700 points—but this is more like a "dead cat bounce" gift rather than a signal of a trend reversal.
From Tuesday to Wednesday, bears dominated the market. The price fell from the rebound high, breaking through the supports of $62,400 and $61,000, approaching the psychological level of $60,000. At that time, the bearish view towards $60,000 was technically sound: lower highs, refreshed lows, and the Bollinger Bands opening downwards—all indicators pointed to a continuation of the bearish trend.
However, on Wednesday night, the CPI data was released, showing inflation lower than expected, and the market reversed instantly. Bitcoin rebounded near $60,700, with a large bullish candle directly reversing the short-term trend. Those traders who had positioned shorts near $60,000 had to face tens of points in stop-losses—this isn’t a failure of technical analysis, but rather a "dimensional strike" from macro data against the technicals.
From Thursday to Friday, bulls completely took over the market. Prices steadily rose, with high and low points synchronously rising, and the Bollinger Bands opening upwards, creating a classic bullish trend structure. On Friday during the day, the $64,000 level faced some pressure and oscillation, with the market in a wait-and-see attitude. But at 10 PM that night, a spike directly broke through $64,000, tearing apart the bullish defense line and opening further upward space.
As of June 14, Bitcoin is priced at approximately $64,400, up 1.4% in 24 hours, with a weekly increase of nearly 6%. From $60,700 to $64,400, the rebound has exceeded 3,700 points in just three days, a strength that surpasses most bears' expectations.
Two, key turning point: Why could CPI data turn the tide?
The core turning point of this week's market is undoubtedly the release of US CPI data.
From a technical perspective, Bitcoin has formed a double bottom around $60,700, but this alone isn’t enough to trigger such a fierce reversal. What truly breaks the balance is the macro data's "pleasant surprise"—cooling inflation means rising expectations of Fed rate cuts, and the anticipation of liquidity easing ignites the bullish enthusiasm for risk assets.
This gives us a profound insight: in the market environment of 2026, pure technical analysis is no longer sufficient; macro data must be included in the trading framework. The correlation between Bitcoin and the S&P 500 has significantly increased during easing cycles; when real interest rates decline, the dollar weakens, and global liquidity expands, BTC often gains stronger upward momentum.
Looking back at this year's trend, Bitcoin has oscillated downwards from the $95,000 range at the start of the year, briefly hitting a monthly high of $81,875 in mid-May, followed by a deep correction. As of June 14, the price has dropped about 21% from the May high. The core driving force behind this decline has been the continuous withdrawal of institutional funds—over the past 30 days, the US spot Bitcoin ETF has seen a net outflow of up to $4.45 billion, with 22 trading days showing negative inflows.
CPI data comes at a time when institutional selling pressure is showing signs of exhaustion. On June 12, the ETF recorded a net inflow of $85.9 million, ending a five-day streak of net outflows. Although the single-day inflow is not enough to reverse the monthly downtrend, it signals a key message: the most panic-driven selling phase may be over.
Three, in-depth technical analysis: structural evolution after breaking $64,000.
From a purely technical perspective, this week's trend has completed several important structural conversions.
Gradual testing and breakthrough of support levels. At the beginning of this week, the lower support levels of $62,400 and $61,000 were broken one after the other, with bears charging ahead. However, $60,700 has become the "last line of defense"—not only is this near previous lows, but it is also approximately 9% above Bitcoin's realized price (around $53,600). Historically, levels near the realized price often mark the bottom of bear markets, indicating that even if bears are strong, they face significant psychological and technical resistance at the $60,000 round number.
Layered breakthroughs of resistance levels. After the CPI data was released, the upper resistance levels of $63,000, $63,500, and $64,000 were successively broken. Especially the breakout at $64,000 occurred on Friday night, accompanied by a significant upward spike, with increased trading volume indicating strong bullish intent. This breakout signifies that the short-term trend has shifted from short to long, with the Bollinger Bands opening upwards and high and low points synchronously rising—a typical bullish dominance pattern.
Current status of key technical indicators. The daily RSI is currently around 35, having exited the oversold zone but still below the neutral line of 50, indicating that medium-term momentum has not fully repaired. The daily MACD remains in negative territory, with no clear bullish crossover in sight. This suggests that the current rebound is more driven by "bear cover and technical recovery" rather than confirmation of a new trend bull market.
Insights from the Fear and Greed Index. The current reading of the Fear and Greed Index is 14, in the "extreme fear" range. This seems paradoxical—prices have rebounded, so why is sentiment still so fearful? The answer lies in the fact that this rebound has not been accompanied by a sustained return of institutional funds; rather, it is more about short-term bears being squeezed into a passive rise. Market participants remain skeptical about the medium- to long-term trend, and this divergence of "prices rising, sentiment cooling" is precisely a typical feature of bottom regions.
Four, institutional perspective and on-chain data: hidden worries behind the rebound.
Despite the encouraging price rebound, unveiling the "hidden cards" of institutions and on-chain data reveals that this rally isn't without its flaws.
ETF fund flows remain the biggest hidden danger. Over the past 7 days, there has been a net outflow of $642 million from ETFs, with only 2 trading days showing positive inflows. The cumulative net outflow over the past 13 trading days has reached $4.4 billion, marking the fastest decline in institutional demand since the US spot Bitcoin ETF launched in January 2024. The net inflow of $85.9 million on June 12 seems more like a "technical recovery" rather than a trend reversal. If subsequent ETF funds cannot continue to flow back, the foundation for this rebound will be very fragile.
Corporate crypto accumulation enthusiasm is cooling. Unlike earlier this year when MicroStrategy and other institutions were buying aggressively, corporate treasury purchases have nearly stalled in June. The only significant buyer, MicroStrategy, has only purchased around $100 million during this downturn, which is a drop in the bucket. This indicates that the "easy institutional demand" phase is over, and the market is entering a "hard mode."
On-chain selling pressure remains. Recent Bitcoin balances on exchanges have increased by about 114,000 coins, indicating that some chips are moving to exchanges in preparation for sale. Long-term holders (LTH) exhibit reluctance to sell, but the profit-taking pressure from short-term holders cannot be ignored.
Signals from the futures market. Open interest (OI) has decreased by 18.43% over the past 30 days to $46.83 billion. This indicates that the market has undergone significant deleveraging, with speculative enthusiasm cooling down. The funding rate is near neutral, with no extreme bullish crowding, which reduces the risk of a "long squeeze," but also means that the upside lacks the push of leveraged funds.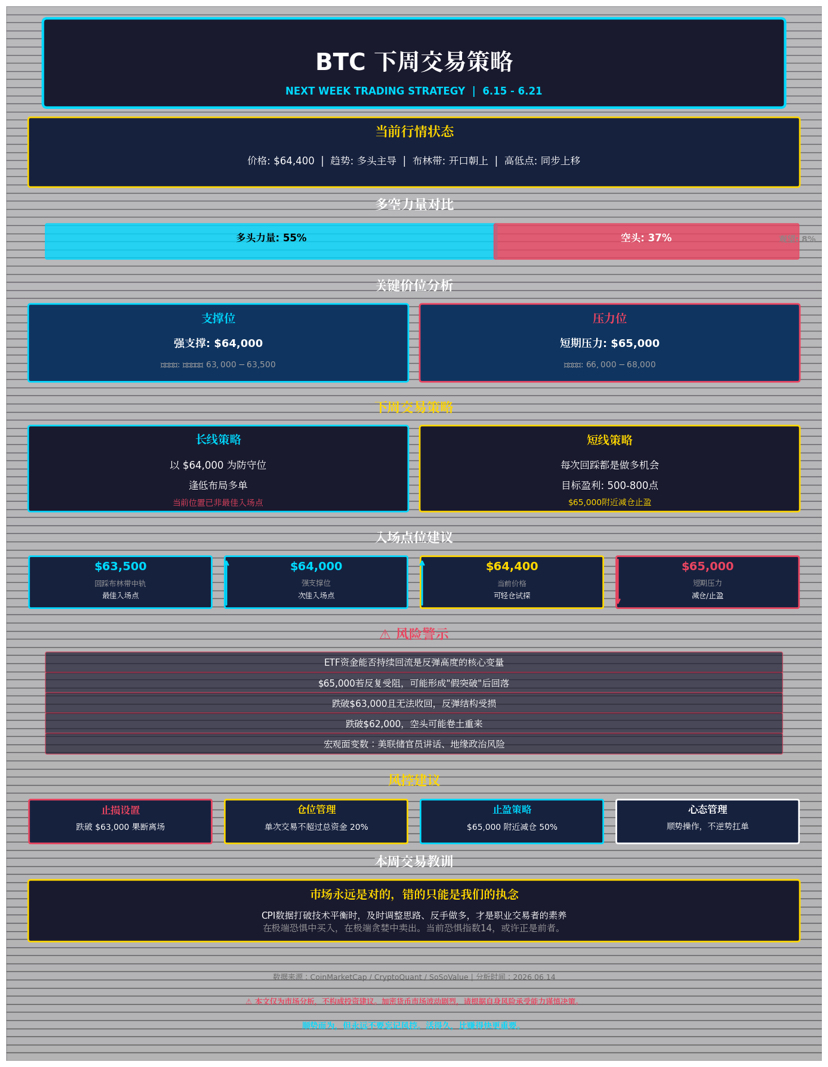
Five, outlook for next week: stay bullish with caution against "false breakouts."
Based on the analysis above, how should next week's trading strategy be adjusted?
Overall direction: shifting from short to long, but stay sharp. This week's breakout at $64,000 marks a reversal of the short-term trend. The Bollinger Bands are opening upwards, and the high and low points are rising, showcasing classic bullish characteristics. Trading with the trend is the first rule; next week’s long-term strategy should primarily focus on being bullish.
Key price levels:
• Strong support levels: $64,000 (just broken resistance turned into support), followed by the middle band of the Bollinger Bands (dynamic support, around $63,000-$63,500).
• Short-term resistance level: $65,000, where there is a dense trading area from prior times, likely to encounter resistance.
• Medium-term target: If it can effectively break through $65,000 and hold, the next target looks towards the $66,000-$68,000 range.
• Lower defensive line: If it breaks below $63,000, the rebound structure is damaged and needs to be reassessed; if it loses $62,000, bears may come back stronger.
Trading strategy:
• Long-term: Use $64,000 as a defensive level, buying on dips. The current position (around $64,400) is not the best entry point; wait for a pullback to $64,000 or near the middle band of the Bollinger Bands before considering increasing positions.
• Short-term: Every pullback is a buying opportunity; aim for a profit of 500-800 points, and don’t be overly greedy. Consider reducing positions or taking profits near $65,000.
• Risk control: Set strict stop-loss orders. If the price drops below $63,000 and fails to recover quickly, decisively exit and observe.
Risks to watch out for:
1. Can ETF funds continue to flow back? This is the core variable determining the height of the rebound. If institutions continue to sell, the price may come under pressure again.
2. Can $65,000 be effectively broken? If it repeatedly meets resistance at this level and forms a "false breakout" followed by a pullback, it will undermine bullish confidence.
3. Are there new variables in the macro landscape? Fed officials' speeches, geopolitical risks, etc., could all pose new "black swans."
Six, in closing: Stay rational amidst fear.
This week's market has taught all traders a lesson: the market is always right; our obsession is what can be wrong.
When I was bearish to $60,000 on Tuesday and Wednesday, there were no technical issues. However, when the CPI data broke the balance, the ability to adjust thoughts promptly, stop losses on shorts, and flip to long is the hallmark of a professional trader. The breakout at $64,000 on Friday was not accidental; it was a concentrated explosion of bullish strength after accumulation.
However, we cannot let the short-term rise cloud our judgment. The Fear and Greed Index remains at an extreme fear level of 14, and ETF funds have yet to confirm a return; on-chain selling pressure has not dissipated—these all remind us that this is more like a "rebound in a bear market" rather than a "restart of a bull market."
As a seasoned trader once said: "Buy in extreme fear, sell in extreme greed." The current market may be in the former. But after buying, can you hold on, and can you exit promptly when the trend reverses? That is the real test.
Next week, let’s go with the flow, but never forget risk control. After all, in this market, surviving long is more important than making quick profits.
Disclaimer: This article is market analysis and personal trading review, not investment advice. The cryptocurrency market is highly volatile; please make decisions based on your own risk tolerance. #比特币回升至64000美元 #Zcash恢复Orchard交易 #瑞波发布XRPL AI支付工具包 #SpaceXIPO各行承销费约1亿美元 #菲律宾禁止持牌交易所隐私币 $BTC