


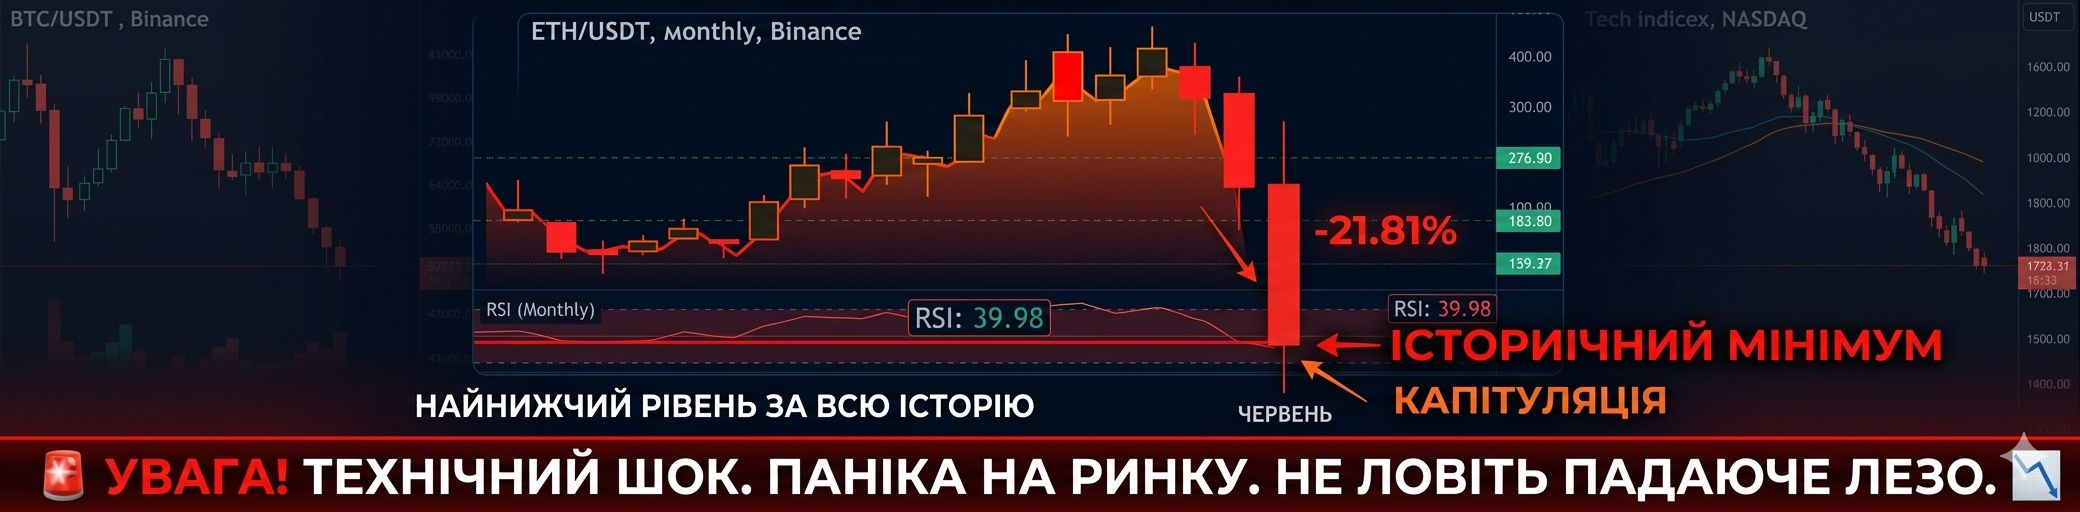
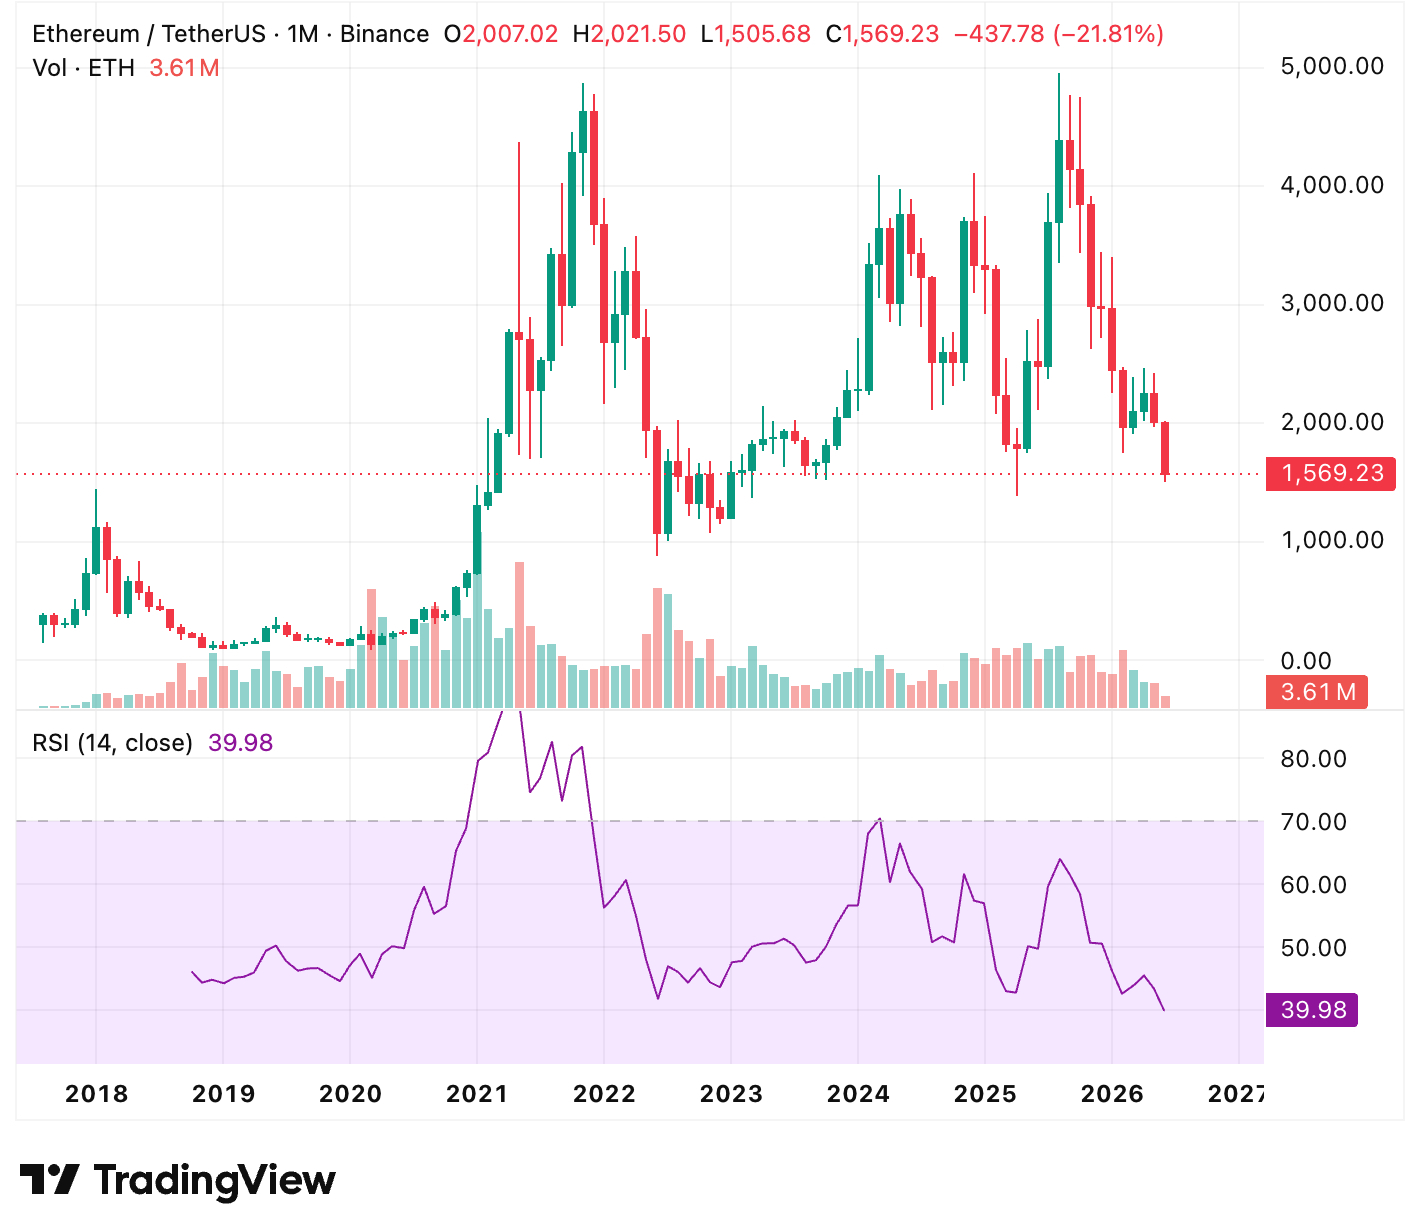
Leave the fairy tales about the "inevitable uptrend" for the influencers. We're looking at the monthly chart for ETH/USDT on Binance, and it’s recording a historical moment: the RSI has dropped to 39.98 — the lowest level ever observed. The red candlestick has already wiped the price down to $1,569, closing the month in a hefty loss of -21.81%.
Anatomy of capitulation:
Technical shock: An RSI indicator below 40 on the monthly timeframe is an extreme oversold zone that Ethereum hasn't seen even during the fierce bear markets of 2018 or 2022. The strength of the sellers is unprecedented right now.
Where the money is fleeing: This is a direct result of systemic capital outflows from crypto risks. While $1.7 billion is flying out of the Bitcoin ETF in a week, Ethereum is taking the brunt of retail panic. Institutions are reallocating liquidity into real AI hardware and Big Tech, leaving altcoins without fuel.
My conclusion: On paper, this is the 'perfect reversal point' due to historical oversold conditions. But in reality, when such fundamental levels break, technical analysis gives way to panic. If Bitcoin can't hold $60k, this historic RSI will drag us even deeper into the swamp. Keep your stops at breakeven and don't try to catch this falling knife with bare hands.
This has never happened before. The RSI on the monthly ETH chart has broken historical lows. Some are screaming about the "best discount of a lifetime" and buying at $1,569, while others are just locking in losses before their portfolio goes up in smoke.
I'm keeping a cool head and waiting for the market reaction to the weekly close. What about you? Are you stacking more Ethereum with everything you've got, or have your stops already been blown? Be honest, let's discuss survival strategies! 👇🧠
#Ethereum #NasdaqWorstDayInOverAYear
#USDTMarketCapOvertakesEthereum
#MorganStanleyGalaxyDigitalCryptoToETPReferral $ETH
