
The OBV trend line continues to reject XRP rebounds, and until OBV breaks above it, momentum remains weak despite repeated increases of 15–20%.
A large resistance wall at $2.52–$2.54 controls the breakout, and XRP needs a clean daily close above $2.56 to flip the short-term structure to bullish.
XRP price details are at risk at $2.21, with a potential slip to $2.06 if the outflow of coins from exchanges decreases further and sell-offs resume.
The price of the currency $XRP has risen by more than 4% in the last 24 hours, but this rise is not enough to change the trend. The XRP currency has made several sharp moves of 15% to 20% in recent weeks, but each faded before turning into a real rise.
The charts illustrate why these bounces have repeatedly failed, and the only level that determines whether this attempt can finally succeed in breaking through.
A recurring bounce pattern is forming, but selling still limits momentum
For several weeks, the XRP currency interacted whenever buying and selling pressure in the market increased — which is measured by the On-Balance Volume (OBV) indicator — against the same downward trend line. OBV tracks whether trading volume is coming into or out of the asset, and often leads its price direction.
Since October 14, the OBV has formed a line of lower highs. Whenever the OBV approaches that line, XRP gets a bounce.
One of the moves raised the XRP currency by 14.73% between October 22 and 26. Another pushed the price up by more than 20% on November 6. A similar approach to this trend line is now happening. This rise in volume may be due to the ETF trading fund hype.
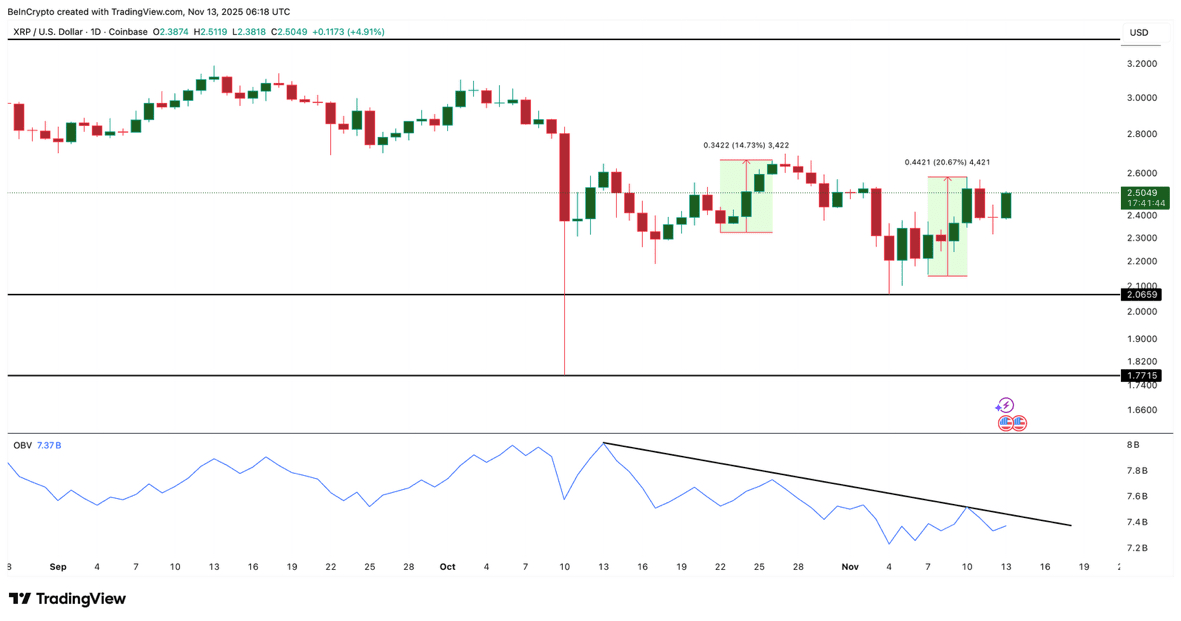
XRP price response to volume: TradingView
But this pattern also explains why every rise fades. Without closing the OBV above the trend line, momentum remains weak. The XRP currency needs this breakout first before any bounce turns into a sustainable move.
At the same time, new selling pressure limits the upward trend. Exchange data shows that outflows — which help the price — were strong until November 7 at around -1.39 billion XRP. By November 12, outflows had shrunk to around -690 million XRP, nearly a 50% drop.
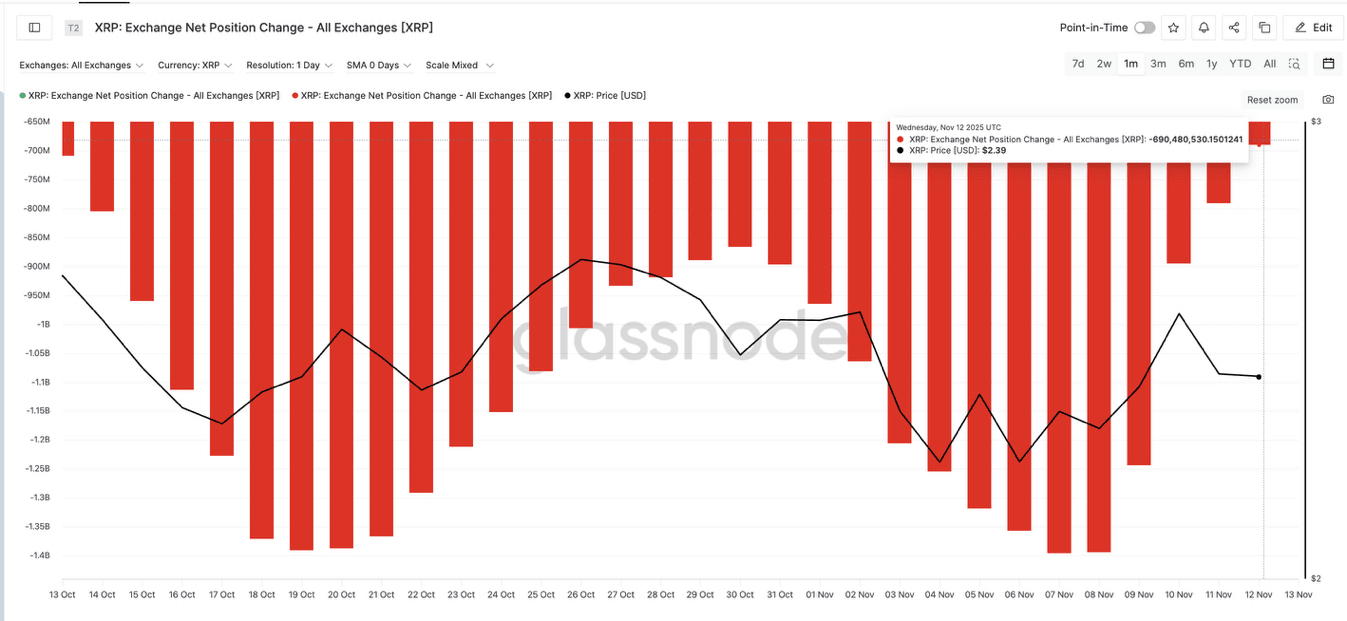
Net outflows decline: Glassnode
This means more tokens remain on exchanges, where they can be sold, making it difficult for Ripple to build gains.
The main supply barrier still dominates the XRP price rise window
The next question is simple: when can Ripple's bounces finally turn into a real recovery?
The answer lies on the heatmap of the basis cost, which highlights where the largest supply clusters are located. One of the strongest walls lies between $2.52 and $2.54, supported by approximately 1.53 billion Ripple. This range has halted every attempt to break through since early November.
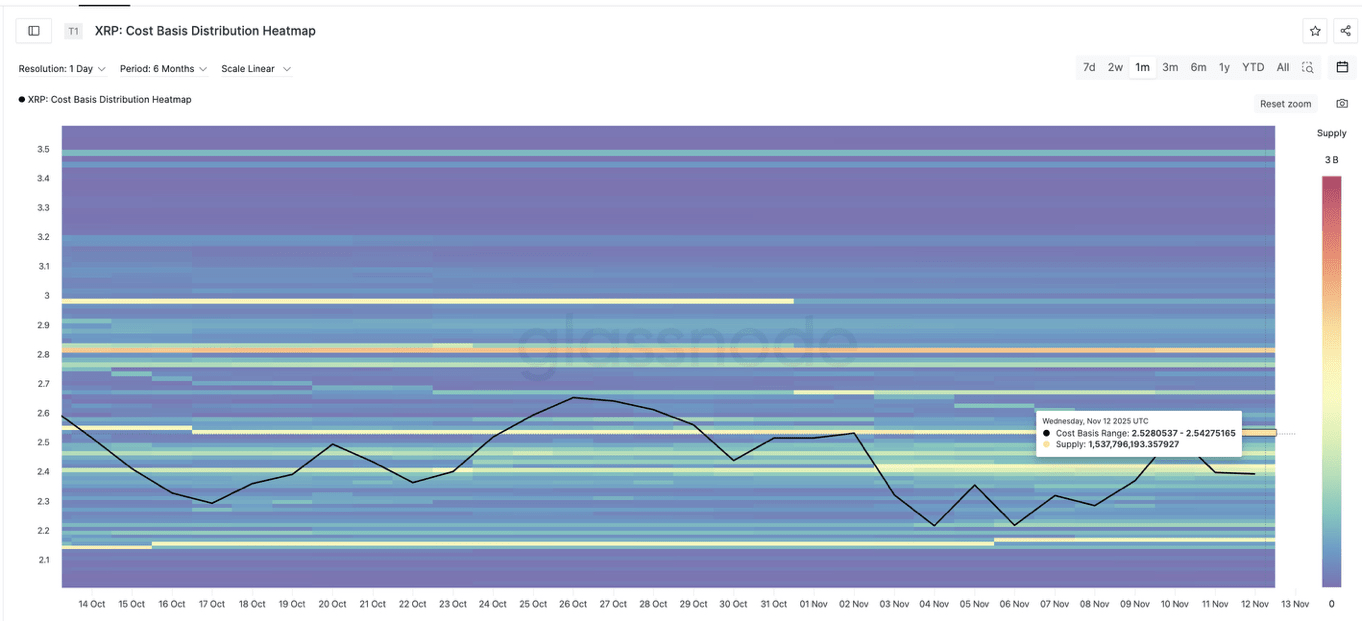
The price wall rises: Glassnode
To break the pattern, Ripple needs to close cleanly above $2.56 on a daily basis, not just a price tail. This move would remove the supply barrier and confirm buyers absorbing the pressure that has constrained the chart for weeks.
If this happens while the OBV indicator also breaks its trend line, the movement becomes much stronger. This would open the next target at $2.69, where the next major interaction area lies.
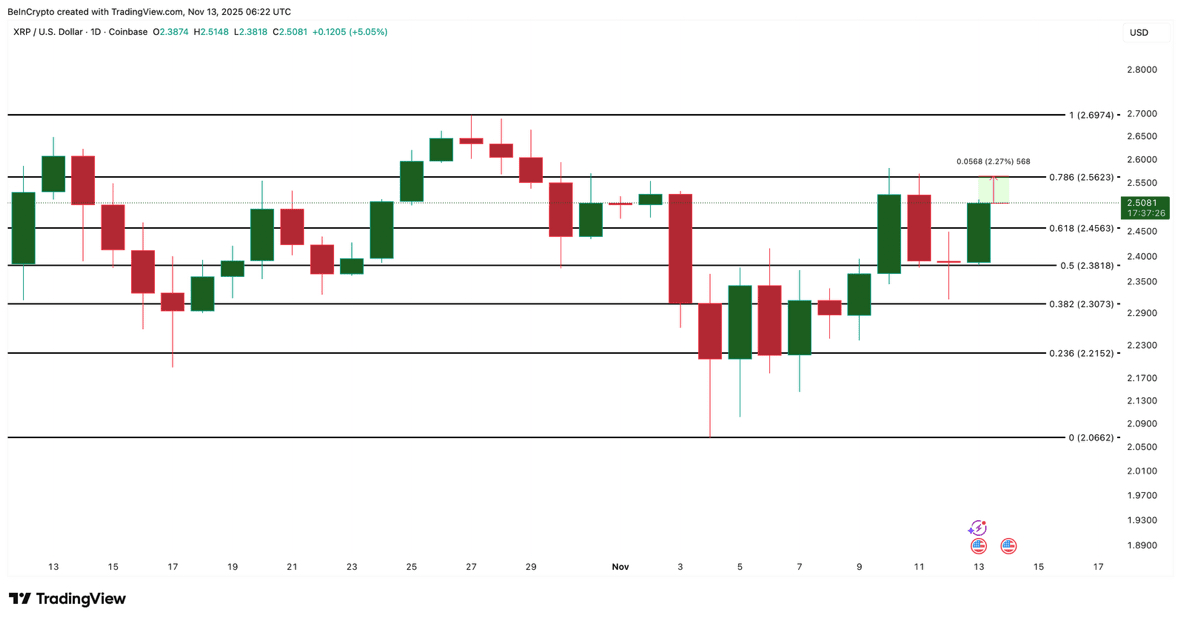
Ripple price analysis: TradingView
The cancellation level remains at $2.21. Closing below it would weaken the entire setup and expose $2.06 to risk, especially if outflows from the exchange decrease and selling returns. Currently, Ripple's price shows strength, but the story remains the same: bounces remain bounces until Ripple closes above $2.56. Only then can a real recovery begin.
#Xrp🔥🔥 #XRPBoom #BinanceSquare #BinanceSquareFamily #BinanceXRP